. 2020 May 20;40(21):4116-4129.
doi: 10.1523/JNEUROSCI.2468-19.2020. Epub 2020 May 8.

Increased Retinoic Acid Catabolism in Olfactory Sensory Neurons Activates Dormant Tissue-Specific Stem Cells and Accelerates Age-Related Metaplasia

Affiliations

Increased Retinoic Acid Catabolism in Olfactory Sensory Neurons Activates Dormant Tissue-Specific Stem Cells and Accelerates Age-Related Metaplasia

Sofia Håglin et al. J Neurosci. .

Abstract

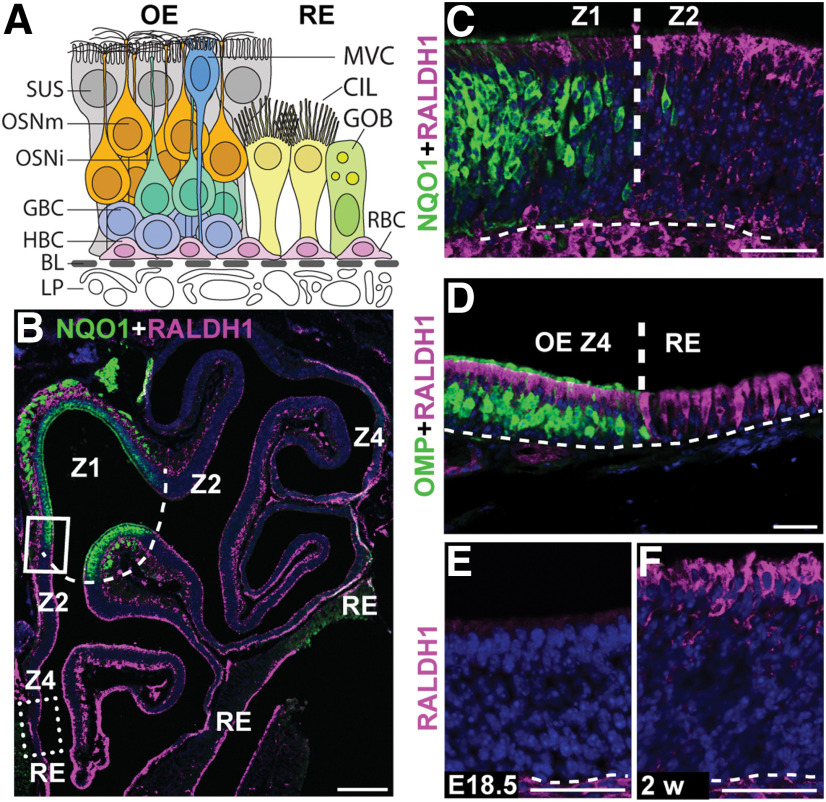
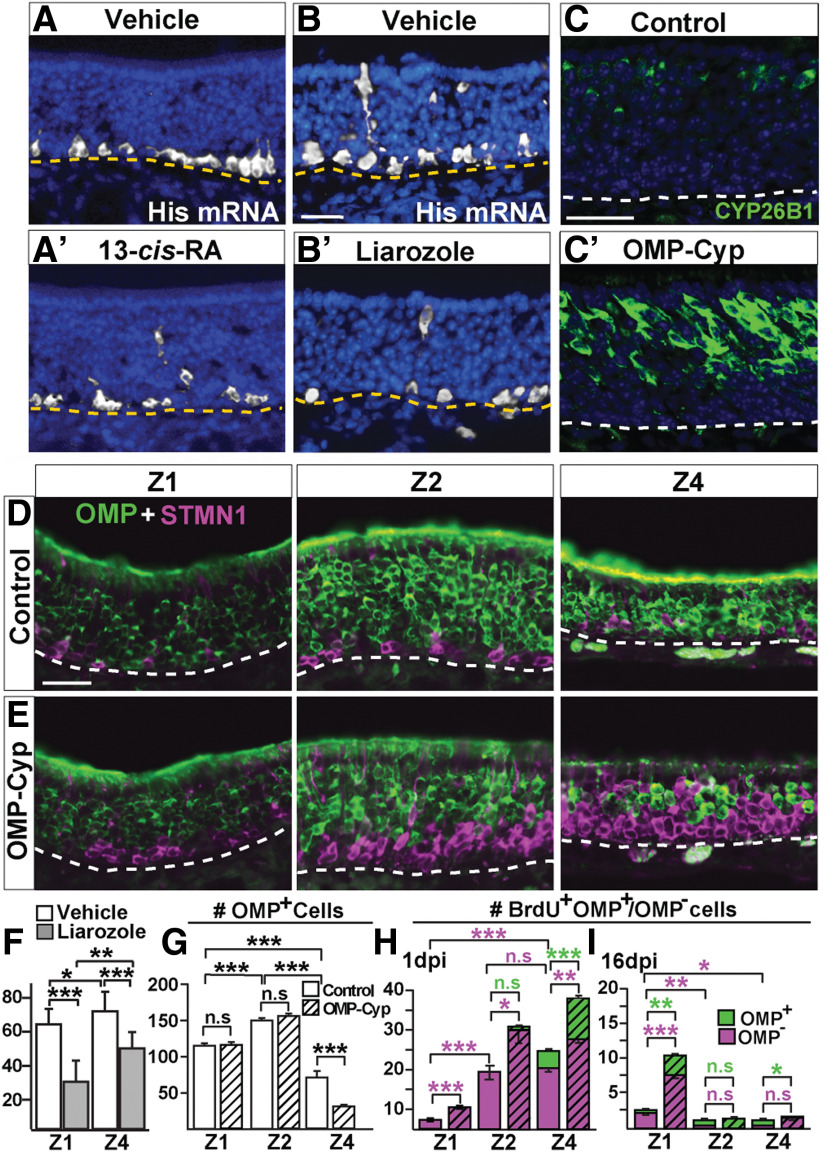
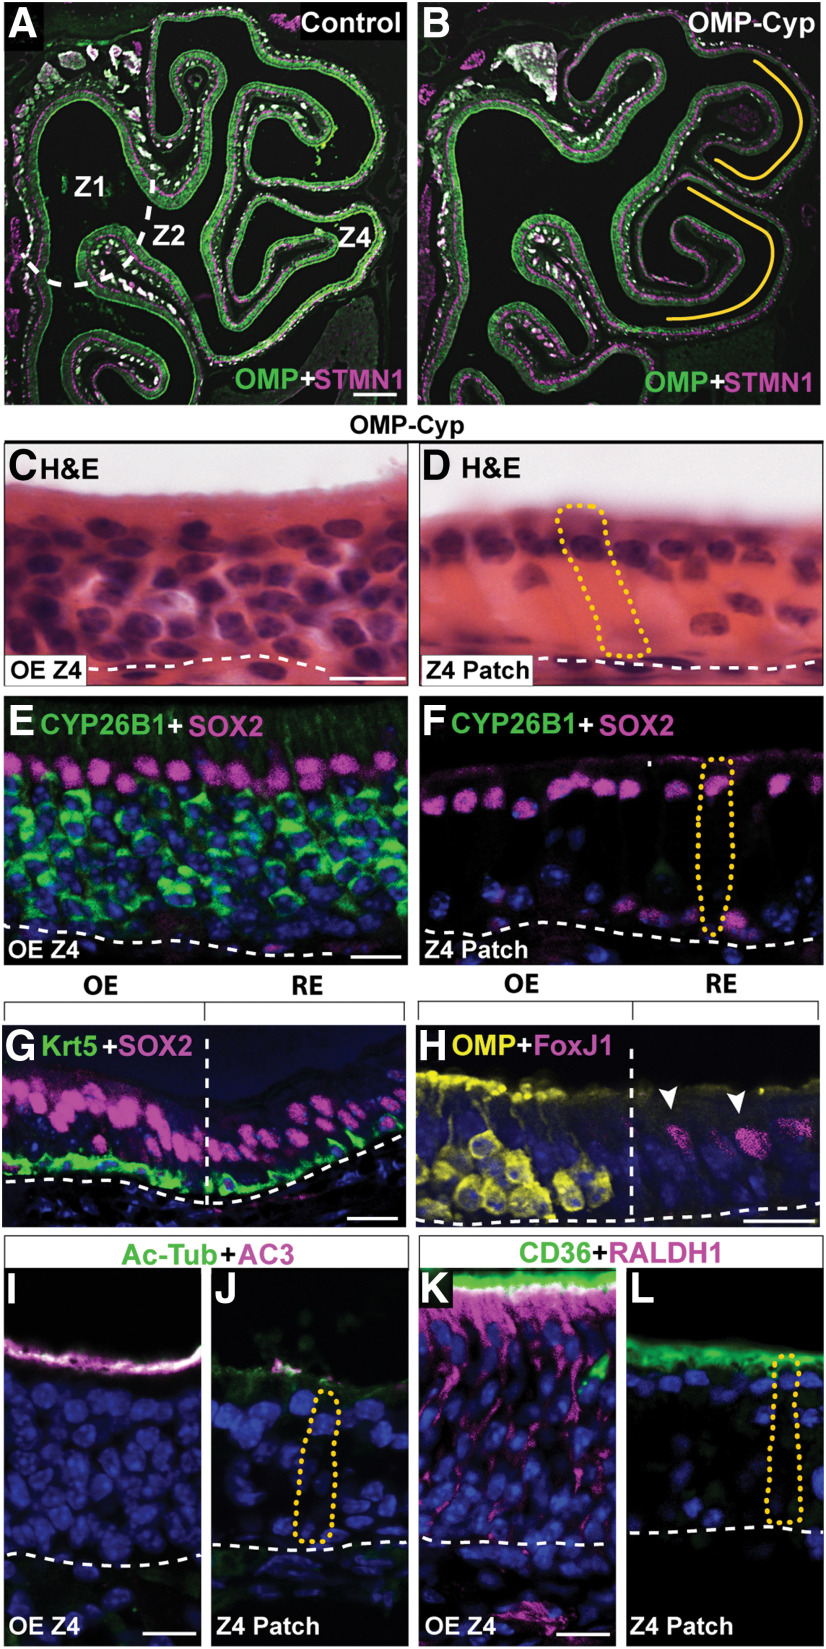
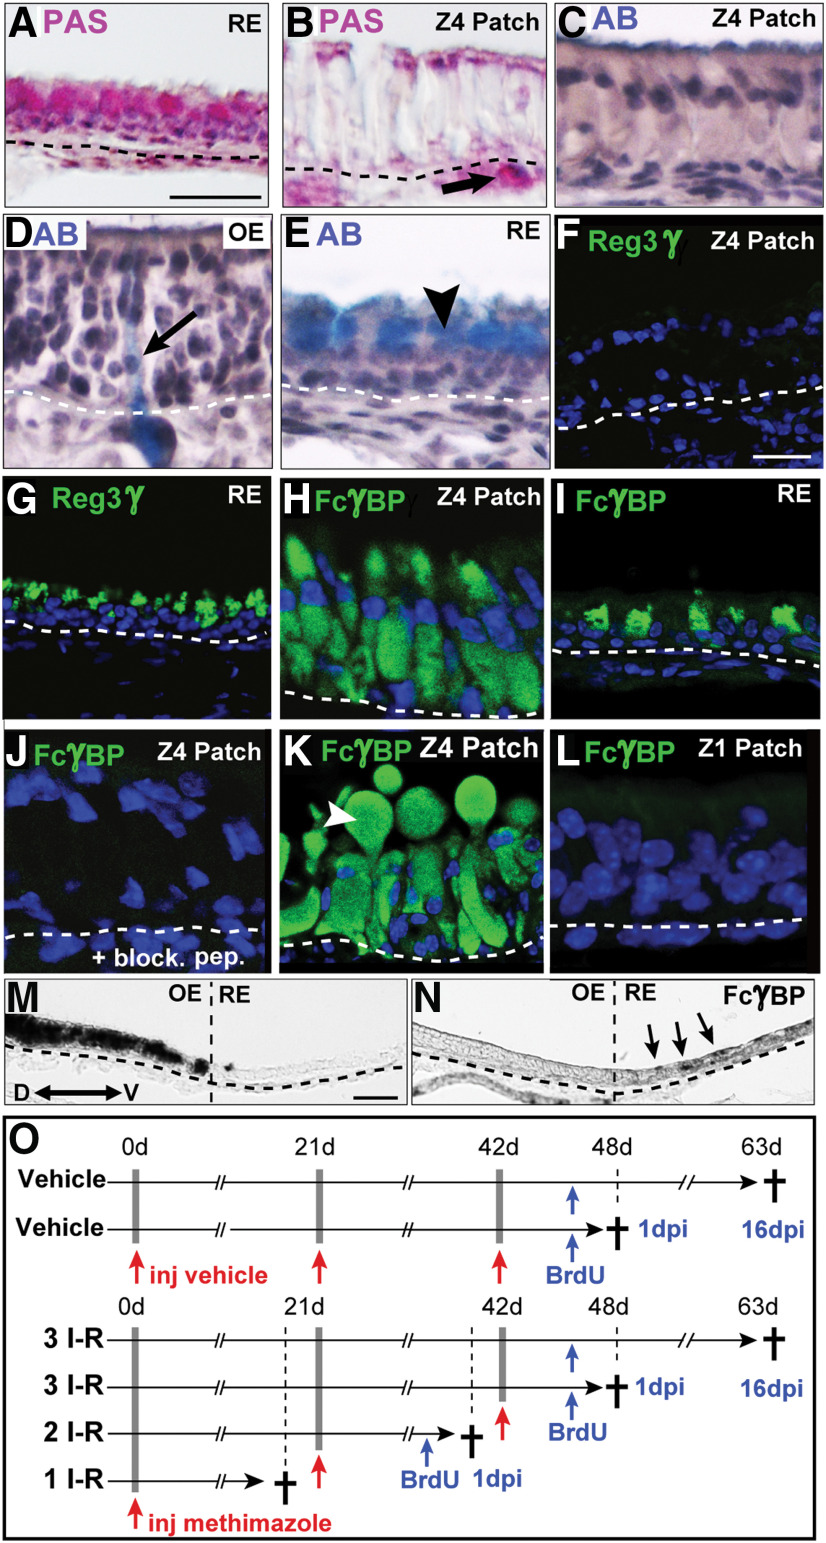
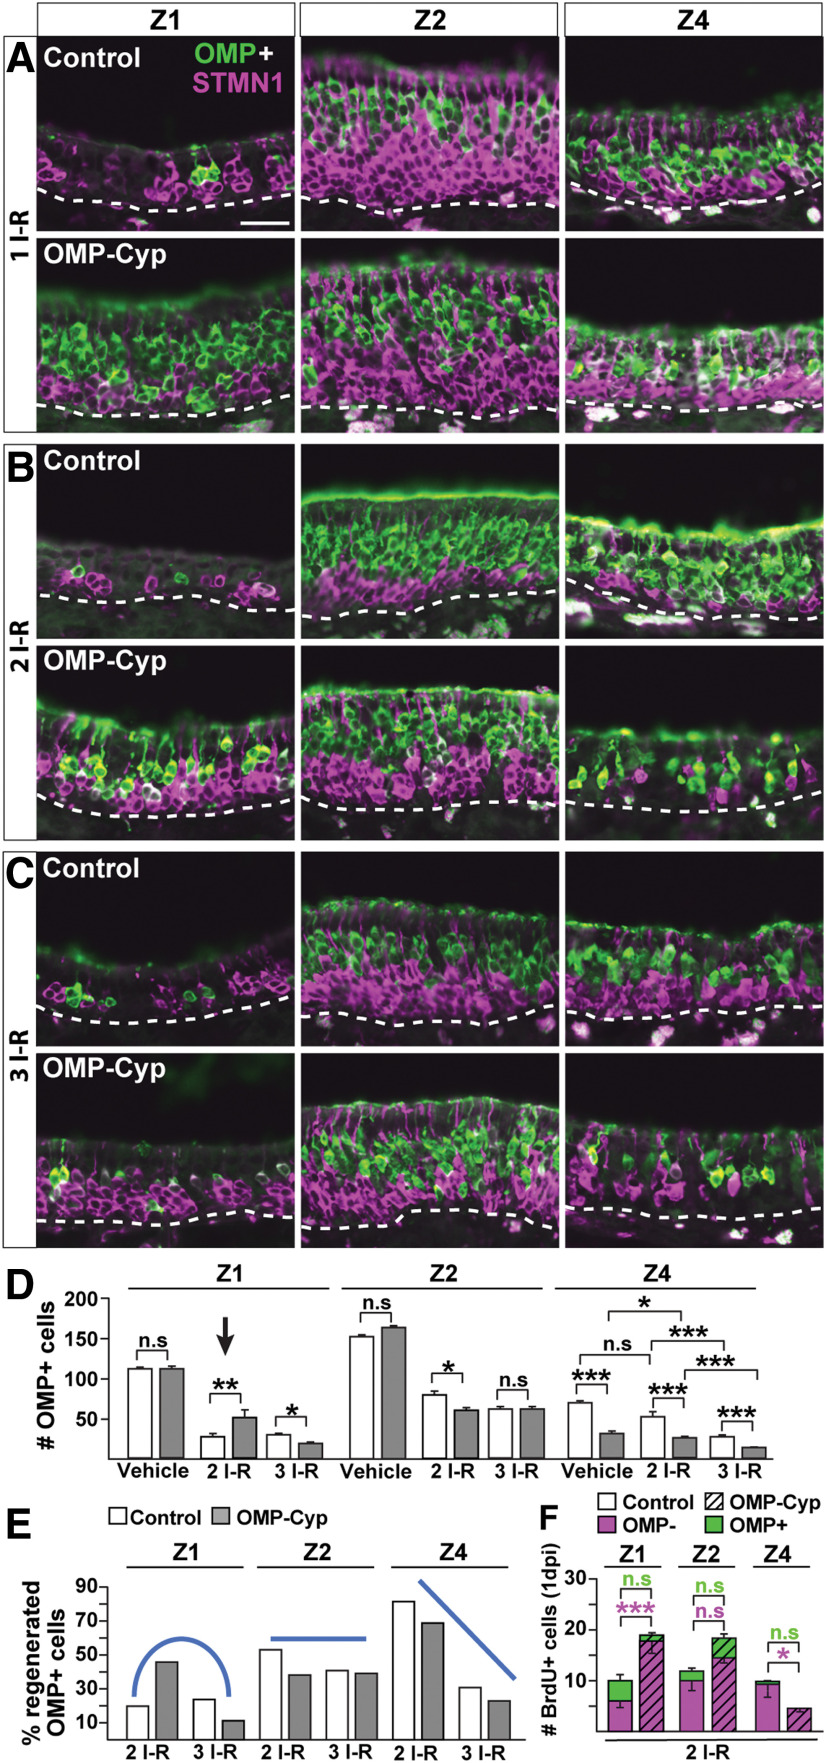
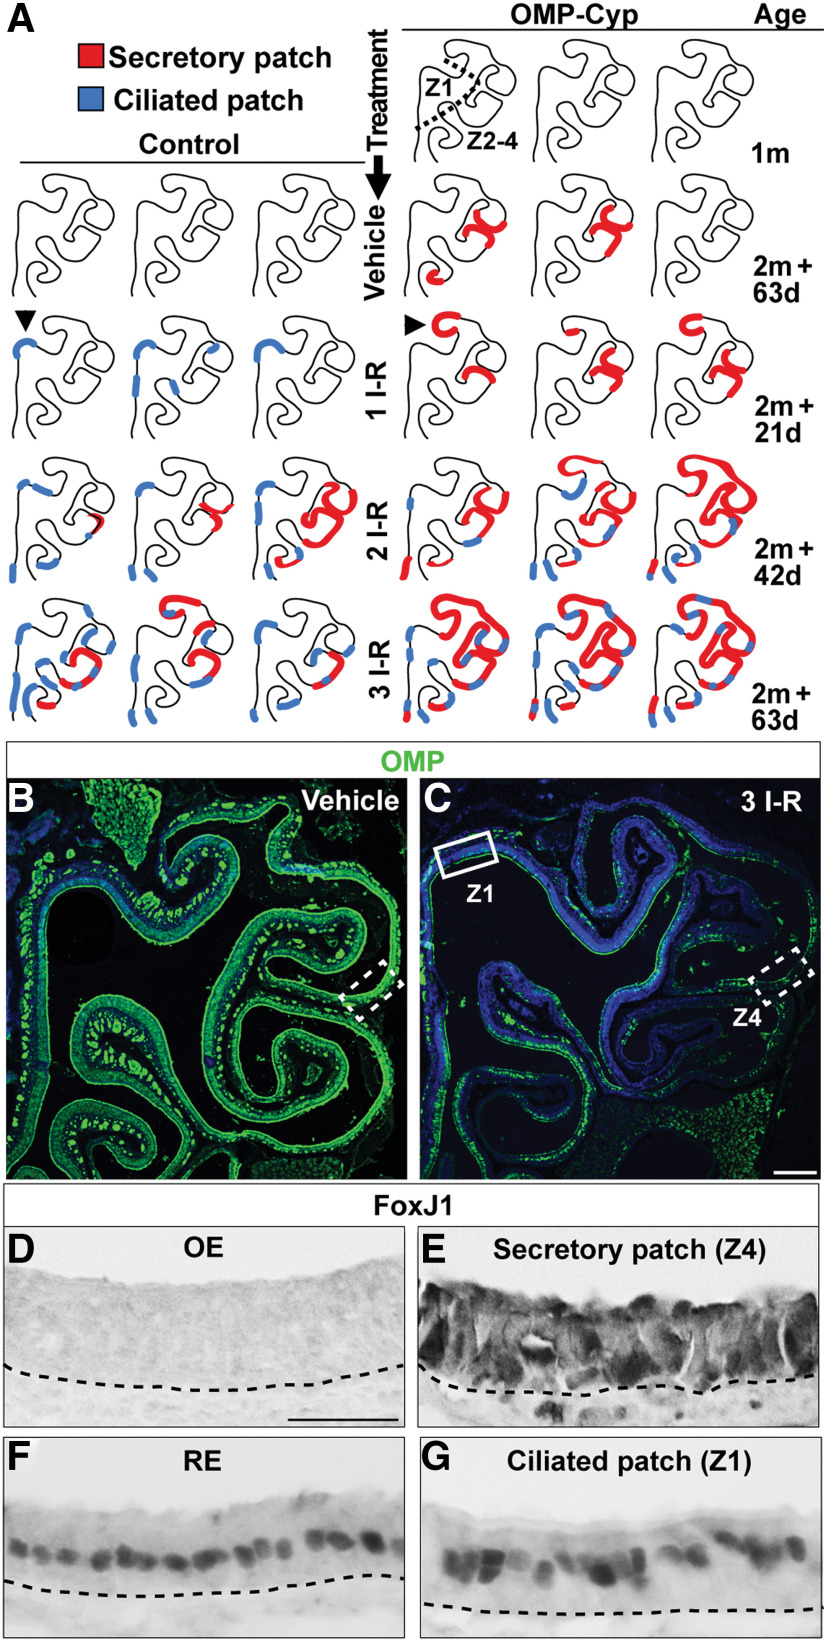
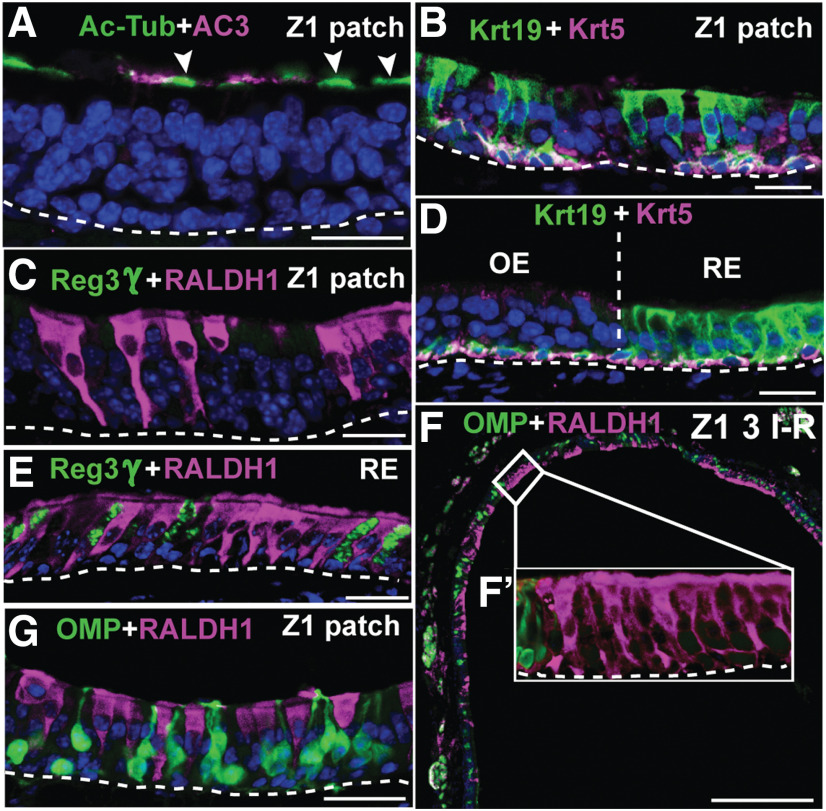
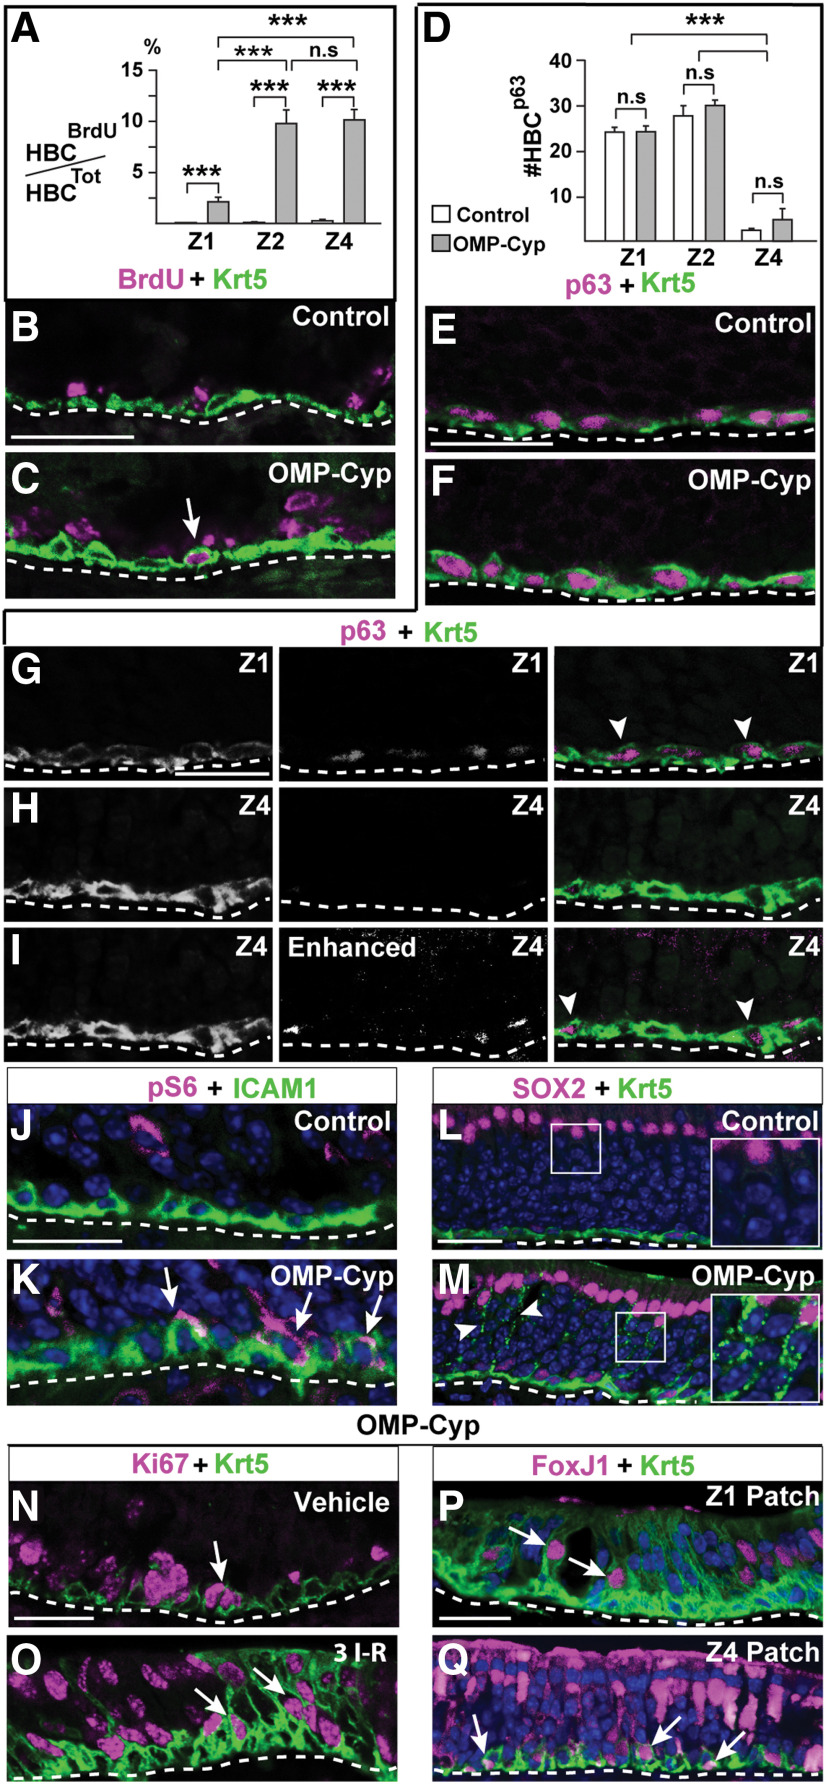
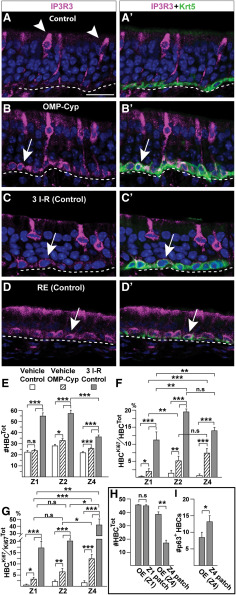
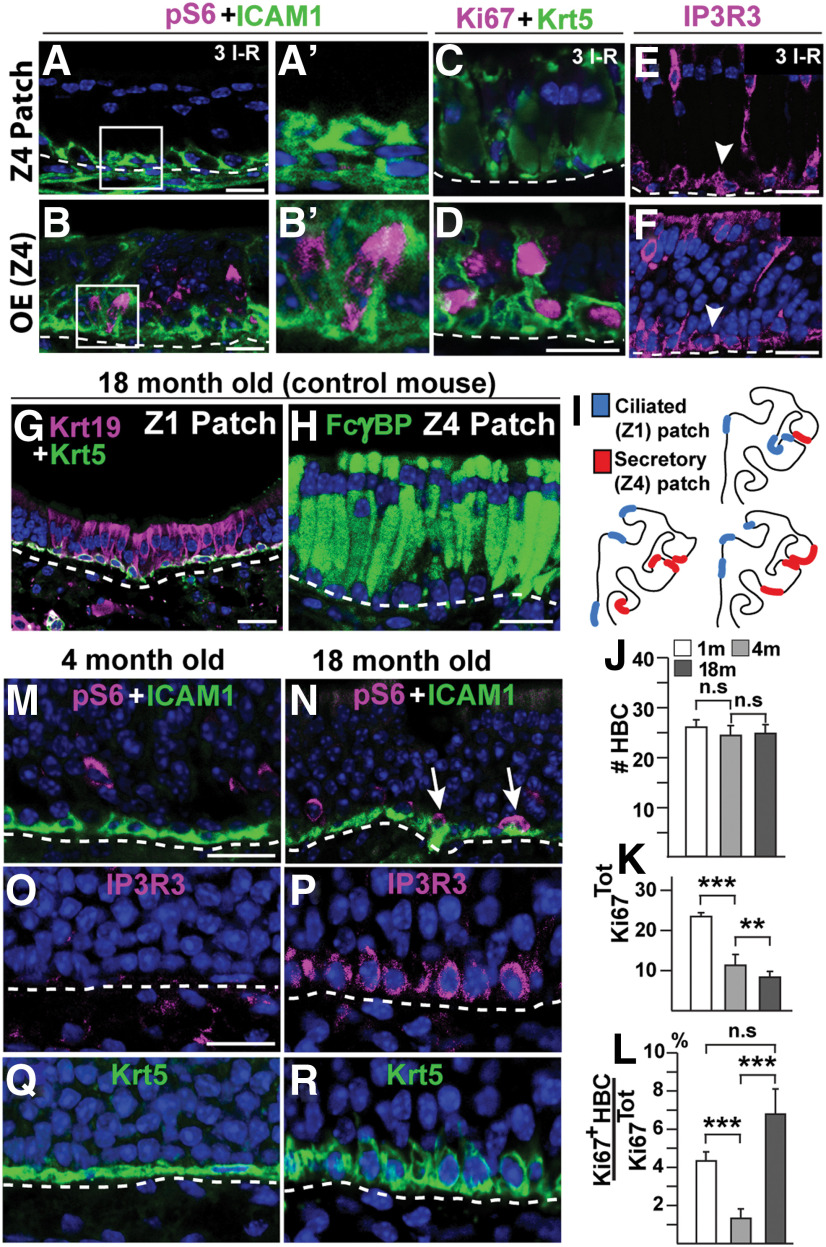
The cellular and molecular basis of metaplasia and declining neurogenesis in the aging olfactory epithelium (OE) remains unknown. The horizontal basal cell (HBC) is a dormant tissue-specific stem cell presumed to only be forced into self-renewal and differentiation by injury. Here we analyze male and female mice and show that HBCs also are activated with increasing age as well as non-cell-autonomously by increased expression of the retinoic acid-degrading enzyme CYP26B1. Activating stimuli induce HBCs throughout OE to acquire a rounded morphology and express IP3R3, which is an inositol-1,4,5-trisphosphate receptor constitutively expressed in stem cells of the adjacent respiratory epithelium. Odor/air stimulates CYP26B1 expression in olfactory sensory neurons mainly located in the dorsomedial OE, which is spatially inverse to ventrolateral constitutive expression of the retinoic acid-synthesizing enzyme (RALDH1) in supporting cells. In ventrolateral OE, HBCs express low p63 levels and preferentially differentiate instead of self-renewing when activated. When activated by chronic CYP26B1 expression, repeated injury, or old age, ventrolateral HBCs diminish in number and generate a novel type of metaplastic respiratory cell that is RALDH- and secretes a mucin-like mucus barrier protein (FcγBP). Conversely, in the dorsomedial OE, CYP26B1 inhibits injury-induced and age-related replacement of RALDH- supporting cells with RALDH1+ ciliated respiratory cells. Collectively, these results support the concept that inositol-1,4,5-trisphosphate type 3 receptor signaling in HBCs, together with altered retinoic acid metabolism within the niche, promote HBC lineage commitment toward two types of respiratory cells that will maintain epithelial barrier function once the capacity to regenerate OE cells ceases.SIGNIFICANCE STATEMENT Little is known about signals that activate dormant stem cells to self-renew and regenerate odor-detecting neurons and other olfactory cell types after loss due to injury, infection, or toxin exposure in the nose. It is also unknown why the stem cells do not prevent age-dependent decline of odor-detecting neurons. We show that (1) stem cells are kept inactive by the vitamin A derivative retinoic acid, which is synthesized and degraded locally by olfactory cells; (2) old age as well as repeated injuries activate the stem cells and exhaust their potential to produce olfactory cells; and (3) exhausted stem cells alter the local retinoic acid metabolism and maintain the epithelial tissue barrier by generating airway cells instead of olfactory cells.

Keywords: aging; inositol-1,4,5-triphosphate; metaplasia; olfactory epithelium; retinoic acid; stem cells.


Figures

Figure 1.
Figure 1.
Spatial expression of CYP26B1 and RALDH1 in the adult OE. A, Schematic illustration of cell types in the OE and RE. OE is a columnar pseudostratified neuroepithelium with underlying vascularized lamina propria (LP). Close to the basal lamina (BL; dashed line) are HBCs and GBCs. GBCs generate immature OSNs (OSNis), which mature into OMP+ OSNs (OSMm) with their cell bodies centrally in OE. In the apical layer are SUS cells and scattered MVCs, both of which are in contact with the BL by endfeet. Acinar and ductal cells of Bowman's glands are additional OE cells not included in the illustration. Main RE cell types are the ciliated respiratory cell (CIL), goblet cell (GOB), and respiratory basal cell (RBC). B, Immunofluorescence for NQO1 (green) in Z1 and RALDH1 (magenta) in Z2-4 at 2 months of age, showing the overall structure of the cartilaginous turbinates lined with OE in one nasal cavity. The dashed line represents the NQO1/RALDH1 border between Z1 and Z2. C, Close-up of region boxed in B showing the Z1 (NQO1)/Z2 (RALDH1) border. D, Region corresponding to the dashed box in B, showing the border between OMP+ OSNs and negative RE. Note that RALDH1 is in both OE SUS cells and RE cells. E, F, SUS cells are negative for RALDH1 at embryonic day 18.5 (EXVIII.5), but positive at 2 weeks (2 w) of age. Scale bars: B, 200 µm; C–F, 25 µm. Dashed line in C–F indicates BL. Nuclei are counterstained in blue.
Figure 2.
Figure 2.
Altered proliferation of basal cells in OE resulting from liarozole and 13-cis-RA treatment and CYP26B1 expression. AB′, In situ hybridization analysis showing a reduced number of histone mRNA+ S‐phase basal cells in OE after nasal instillation of 13-cis-RA (A, A′) and the CYP26B1 antagonist liarozole (B, B′) compared with vehicle (DMSO). C, C′, As expected, CYP26B1 (green) is increased in OSNs of transgenic OMP-Cyp (C′) compared with control mice (C). D, E, Double OMP (green, mature OSNs) and STMN1 (magenta, immature OSNs) immunofluorescence in Z1, Z2, and Z4 in 4-month-old OMP-Cyp mice and littermate controls, is shown. F, Quantification of basal cells positive for histone mRNA after nasal instillation of liarozole and vehicle shows that that there was significantly less proliferation in both Z1 and Z4 of liarozole-treated mice. G, Quantification of OMP+ OSNs in OMP-Cyp and controls is shown. H, I, The number of BrdU+/OMP (magenta) and BrdU+/OMP+ (green) cells in OMP-Cyp mice (striped bars) and controls (open bars) after 1 (H) or 16 (I) dpi of BrdU. Graphs show N = 3 mice and n = 8 hemisections per mouse. Error bars represent the mean ± SEM. Two-tailed Student's t test: n.s. nonsignificant; *p < 0.05, **p < 0.01, ***p < 0.001. Scale bars, 25 µm. Dashed line indicates basal lamina. Nuclei are counterstained in blue.
Figure 3.
Figure 3.
Increased expression of CYP26B1 results in patches without OSNs in Z4. A, B, Immunofluorescence for OMP (green) and STMN1 (magenta) on hemisections of OE in control and OMP-Cyp mice, is shown. Dashed line represents the Z1–Z2 border. Note the relative decrease of OMP in Z4 (marked by yellow lines) in OMP-Cyp mice (B) compared with controls (A). C–L, Analyses of OE, metaplastic patches in Z4 (Z4 patch), and RE of OMP-Cyp mice are shown. Where relevant, the shape of one Z4 patch cell is outlined by a dotted yellow line. C, D, Hematoxylin and eosin (H&E) staining shows the large volume of patch cells. E, F, Shows that patch cells express SOX2 (magenta) but not CYP26B1 (green). G, Double-immunofluorescence analysis of the OE/RE border (vertical line) shows that both SUS cells in OE and RE cells express SOX2 (magenta) and that both HBCs in OE and basal cells in RE express Krt5 (green). H, Analyses for OMP (yellow) in OE and FoxJ1 (magenta) demarcate the border between OE and RE cells with FoxJ1+ nuclei (arrowheads). I, J, Shows analyses for cilia markers Ac-Tub (green) and AC3 (magenta). Patch cells do not stain for AC3 or Ac-Tub, while cilia of OSNs in OE are positive for both (note that green plus magenta shows as white). K, L, SUS cells and patch cells both have CD36 (green) positive microvilli, while SUS cells but not Z4 patch cells express RALDH1 (magenta). Dashed lines in C–L indicate basal lamina. Scale bars: A, 300 µm; C–L, 12.5 µm.
Figure 4.
Figure 4.
Identification of the metaplastic Z4 cell type. AN, Analyses of OE, metaplastic patches in Z4 (Z4 patch), and RE of OMP-Cyp mice are shown. A, B, Shows PAS+ (pink) goblet cells in RE (A) and Bowman's glands in lamina propria of OE (B, arrow). Patch cells are negative (B). Nuclei are stained by hematoxylin (purple). CE, Alcian Blue (AB) staining (light blue) shows negative patch cells (C) while Bowman's duct/glands in OE (D, arrow) and goblet cells in RE (E, arrowhead) stain positive. F, G, Immunofluorescence for Reg3γ (green) shows that Z4 patch cells are negative (F) while RE cells are positive (G). H, I, FcγBP in patch cells (H) and in RE cells (I). J, Shows lack of FcγBP immunofluorescence in Z4 patch when blocking with the immunizing peptide (block. pep.). K, Secreted FcγBP+ (green) extracellular globule (arrowhead) that is present in a fraction of the patches. L, Cells in Z1 patches do not stain for FcγBP. M, N, In situ hybridization analysis showing OMP mRNA+ in OE (M) and FcγBP mRNA+ cells (N, arrows) on serial sections of the nasal septum. O, Experimental time lines for vehicle treatments of control mice (control) and methimazole-induced I–R cycles of OE in control and OMP-Cyp mice. Two-month-old mice received one (1 I–R), two (2 I–R), or three (3 I–R) injections (inj.) of vehicle or methimazole (red arrows) 21 d apart. Mice were killed (†) at 6 or 21 dpi following methimazole injections and received BrdU (blue arrows) 1 or 16 d before being killed. Dashed lines indicate basal lamina. Scale bars: AE, 25 µm; F–L, 12.5 µm; M, N, 50 µm.
Figure 5.
Figure 5.
RA-dependent OE regeneration shows zonal differences. AC, Double immunofluorescence for OMP (green) and STMN1 (magenta) in Z1, Z2, and Z4 of OE in littermate control and OMP-Cyp mice 21 d after methimazole-induced one (A), two (B), and three (C) I–R cycles. Scale bar, A, 25 µm. D, Quantification of OMP+ cells in Z1, Z2, and Z4 of littermate controls (open bars) and OMP-Cyp mice (gray bars) after vehicle, two I–R, and three I–R cycles is shown. E, Percentage of regenerated OMP+ cells after two I–R and three I–R cycles. The percentage was calculated relative to the number of OMP+ OSNs per 300 μm OE length in vehicle-treated control and OMP-Cyp mice, respectively. Blue lines indicate the trends of regenerative capacity in Z1, Z2, and Z4 in OMP-Cyp mice compared with control mice following two I–R and three I–R cycles, respectively. F, Quantification of the number of BrdU+/OMP (magenta) and BrdU+/OMP+ (green) double-positive cells in OMP-Cyp mice (striped bars) and littermate controls (open bars) after two I–R cycles at 1 dpi of BrdU. Graphs show result from N = 3 mice and n = 8 hemisections per mouse. Error bars represent the mean ± SEM. Two-tailed Student's t test: n.s. nonsignificant, *p < 0.05, **p < 0.01, ***p < 0.001.
Figure 6.
Figure 6.
Two types of metaplastic patches appear after methimazole injury or high-level transgenic expression of CYP26B1. A, Schematic illustrations of OE hemisections representing three OMP-Cyp mice at 1 month of age (1m). Also illustrated are OE hemisections of control and OMP-Cyp mice after one, two, and three I–R cycles according to the schedule outlined in Figure 4O. Red lines indicate patches with metaplastic secretory respiratory cells (secretory patch), whereas blue lines indicate patches with metaplastic ciliated respiratory cells (ciliated patch). Arrowheads indicate examples of OE regions without flanking RE where isolated patches within otherwise normal OE histologically were identified. B, C, Distribution of OMP+ OSNs (green) in control mice after vehicle (B) and after three I–R cycles (C) is shown. Nuclei are in blue. Indicated Z1 region (solid box) and Z4 region (dashed lined boxes) correspond to the regions analyzed in D, E, and G. DG, Show FoxJ1 immunostaining in Z4 (D), a patch of secretory respiratory metaplasia in Z4 (E), RE (F), and a patch of ciliated respiratory metaplasia in Z1 patch (G). Scale bars: C, 300; D, 12.5 µm.
Figure 7.
Figure 7.
Metaplastic cells in Z1 are ciliated respiratory cells. A, Ac-Tub (green) and AC3 (magenta) analyses of a Z1 patch showing that Ac-Tub cilia (arrowheads) staining of the metaplastic cells does not overlap with OSN-specific AC3+ cilia staining. B, D, Krt19 and Krt5 immunofluorescence shows that both Z1 patch cells (B) and RE cells (D) express Krt19. C, E, Analysis for Reg3γ (green) and RALDH1 (magenta) shows that the Z1 patch cell type is RALDH1+/Reg3γ (C), while both RALDH1+ and Reg3γ+ cells are present in RE (E). F, RALDH1+ ciliated respiratory cells (magenta) and OMP+ OSNs (green) along the dorsal nasal recess (i.e., Z1) of control mice after three I–R cycles. , Close-up of a patch with RALDH1+ respiratory cells that lacks OMP+ OSNs. G, A patch that has a mixture of RALDH1+ respiratory cells and OMP+ OSNs. Scale bars: A–E, G, 12.5 µm; F, 200 µm. Nuclei are in blue.
Figure 8.
Figure 8.
Increased CYP26B1 in OSNs activates HBCs. A, Quantification of the percentage of BrdU+ HBCs in Z1, Z2, and Z4 of in 5-month-old control (open bars) and OMP-Cyp (gray bars) mice. B, C, Double immunofluorescence for BrdU (magenta) and Krt5 (green). Arrow in C indicates a double-positive HBC. D, Quantification of the number of p63+ HBCs in Z1, Z2, and Z4 of OE. E, F, Krt5 and p63 (magenta) in Z1 of control and OMP-Cyp mice. G, H, Krt5 (green) and p63 (magenta) double-positive cells in Z1 (G, arrowheads) and Krt5+ cells with p63 immunofluorescence below detection threshold in Z4 (H) of OE. I, Enhanced exposure of the p63 signal in H showing that p63 immunofluorescence is present in Z4 HBCs (arrowhead), but with a significantly lower intensity compared with Z1 HBCs. J, K, pS6 (magenta) and ICAM1 (green) analyses of control (J) and OMP-Cyp (K) mice. Arrows in K show the presence of double-positive HBCs. Note that overlap in white is highly localized as ICAM and pS6 are in different cellular compartments. L, M, SOX2 (magenta) and Krt5 (green) analysis showing that SUS cells with Krt5+ puncta (arrowheads) are present in OMP-Cyp (M), but not in control mice (L). Magnified inserts have been resampled to increase resolution. N, O, Ki67 (magenta) and Krt5 (green) in OMP-Cyp mice treated either with vehicle (K) or after three I–R cycles. Arrows indicate double-positive HBCs. P, Q, FoxJ1 (magenta) and Krt5 (green) fluorescence in a Z1 (P) and a Z4 (Q) patch after three I–R cycles in OMP-Cyp mice. Arrows indicate double-positive HBCs. Scale bars, 25 μm. n.s. nonsignificant, ***p < 0.001.
Figure 9.
Figure 9.
Activating stimuli induce all HBCs to express IP3R3 and change morphology. A–D′, Double-immunofluorescence analyses for Krt5 (green) and IP3R3 (magenta). A, A′, IP3R3 in apically located MVCs (arrowheads) in controls. Note the lack of IP3R3 in Krt5+ HBCs with a flat cellular morphology at basal lamina. B, B′, IP3R3 and a rounded morphology characterize Krt5+ HBCs in OMP-Cyp mice (arrow). C, C′, IP3R3 is turned on in HBCs and HBCs also change to a rounded morphology in control mice after methimazole injury (6 d after three I–R cycles). D, D′, Krt5+ basal cells in RE of control mice constitutively express IP3R3 (arrow). E–I, Quantification of cell numbers in Z1, Z2, Z4, and metaplastic patches in vehicle-treated controls (open bars), OMP-Cyp mice (striped bars), and control mice 6 d after three I–R cycles (gray bars). E, The number of Krt5+ HBCs. F, G, The percentage of Ki67+ HBCs (HBCKi67) of the total number of HBCs (HBCTot; F), and the percentage of Ki67+ HBCs (HBCKi67) of the total number Ki67+ cells (Ki67Tot; G). H, The number of Krt5+ HBCs in Z1 patch, Z4 patch, and adjacent OE. I, The number of p63+ HBCs in Z4 patches and adjacent Z4 OE. Graphs show N = 3 mice and n = 8 hemisections per mouse. Error bars represent the mean ± SEM. Two-tailed Student's t test: n.s. nonsignificant, *p < 0.05, **p < 0.01, ***p < 0.001. Scale bar, A, 12.5 µm.
Figure 10.
Figure 10.
Quiescent HBCs in Z4 patches and HBC activation in old mice. A–F, Immunofluorescence analyses of control mice 6 d after three I–R cycles. AB′, pS6 (magenta) and ICAM1 (green) analysis of a Z4 patch (A, A′) and adjacent Z4 OE (B, B′). Boxed regions in A and B are magnified and resampled in A′ and B′. C, D, Lack of Ki67 (magenta) in Krt5+ (green) HBCs in a Z4 patch (C) while Ki67+/Krt5+ double-positive HBCs are found in adjacent Z4 OE (D). E, F, IP3R3+ HBCs (arrowheads) in both a Z4 patch and Z4 OE after three I–R cycles. G, Krt19 (magenta) in metaplastic ciliated respiratory cells in a Z1 patch of an 18-month-old control mouse. H, Immunofluorescence for FcγBP (green) in metaplastic secretory cells in a Z4 patch of an 18-month-old control mouse. I, Schematic illustration of the distribution of patches in OE hemisections of three different 18-month-old control mice is shown. J–L, Quantification of cell numbers in OE of 1- (open bars), 4- (gray bars), and 18-month-old (black bars) control mice is shown. J, The total number of Krt5+ HBCs. K, L, The total number of Ki67+ cells (K) and the percentage of Ki67+ HBCs of the total number of Ki67+ cells (Ki67Tot; L). M, N, An increase in the number of ICAM1+ HBCs (green) that are also positive for pS6 (magenta, arrows) in 4-month-old compared with 18-month-old controls. O–R, Induction of IP3R3 (magenta) in HBCs and change from a flat to a rounded cellular morphology of HBCs in control mice between 4 months (O, Q) and 18 months (P, R) of age. Graphs show data from N = 3 mice and n = 8 hemisections per mouse. Error bars represent the mean ± SEM. Two-tailed Student's t test: n.s. nonsignificant, **p < 0.01, ***p < 0.001. Scale bars, 25 µm.

Similar articles

Cited by

References

    1. Alenius M, Bohm S (1997) Identification of a novel neural cell adhesion molecule-related gene with a potential role in selective axonal projection. J Biol Chem 272:26083–26086. 10.1074/jbc.272.42.26083 - DOI - PubMed
    1. Asson-Batres MA, Zeng MS, Savchenko V, Aderoju A, McKanna J (2003) Vitamin A deficiency leads to increased cell proliferation in olfactory epithelium of mature rats. J Neurobiol 54:539–554. 10.1002/neu.10192 - DOI - PMC - PubMed
    1. Bergman U, Ostergren A, Gustafson AL, Brittebo B (2002) Differential effects of olfactory toxicants on olfactory regeneration. Arch Toxicol 76:104–112. 10.1007/s00204-002-0321-2 - DOI - PubMed
    1. Brann JH, Firestein SJ (2014) A lifetime of neurogenesis in the olfactory system. Front Neurosci 8:182. 10.3389/fnins.2014.00182 - DOI - PMC - PubMed
    1. Brittebo EB. (1995) Metabolism-dependent toxicity of methimazole in the olfactory nasal mucosa. Pharmacol Toxicol 76:76–79. 10.1111/j.1600-0773.1995.tb00107.x - DOI - PubMed

Publication types

LinkOut - more resources