. 2020 May 26;117(21):11471-11482.
doi: 10.1073/pnas.1921484117. Epub 2020 May 8.

ZBED2 is an antagonist of interferon regulatory factor 1 and modifies cell identity in pancreatic cancer

Affiliations

ZBED2 is an antagonist of interferon regulatory factor 1 and modifies cell identity in pancreatic cancer

Tim D D Somerville et al. Proc Natl Acad Sci U S A. .

Abstract

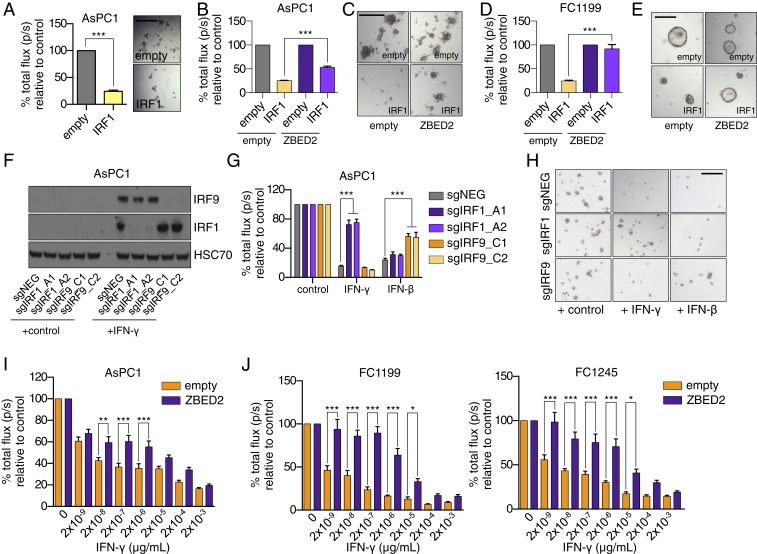
Lineage plasticity is a prominent feature of pancreatic ductal adenocarcinoma (PDA) cells, which can occur via deregulation of lineage-specifying transcription factors. Here, we show that the zinc finger protein ZBED2 is aberrantly expressed in PDA and alters tumor cell identity in this disease. Unexpectedly, our epigenomic experiments reveal that ZBED2 is a sequence-specific transcriptional repressor of IFN-stimulated genes, which occurs through antagonism of IFN regulatory factor 1 (IRF1)-mediated transcriptional activation at cooccupied promoter elements. Consequently, ZBED2 attenuates the transcriptional output and growth arrest phenotypes downstream of IFN signaling in multiple PDA cell line models. We also found that ZBED2 is preferentially expressed in the squamous molecular subtype of human PDA, in association with inferior patient survival outcomes. Consistent with this observation, we show that ZBED2 can repress the pancreatic progenitor transcriptional program, enhance motility, and promote invasion in PDA cells. Collectively, our findings suggest that high ZBED2 expression is acquired during PDA progression to suppress the IFN response pathway and to promote lineage plasticity in this disease.

Keywords: IRF1; ZBED2; interferon; lineage plasticity; pancreatic ductal adenocarcinoma.


Conflict of interest statement

Competing interest statement: C.R.V. has received funding from Boehringer-Ingelheim and is an advisor to KSQ Therapeutics.

Figures

Fig. 1.
Fig. 1.
Aberrant ZBED2 expression in pancreatic ductal adenocarcinoma correlates with inferior patient survival outcomes. (A) Expressed TFs ranked by mean log2 fold-change in primary PDA versus normal pancreas. Selected TFs are labeled along with their rank. (B) ZBED2 expression in normal pancreas and primary and metastatic PDA tumor samples. P value determined by one-way ANOVA. (C and D) ZBED2 expression across PDA patient samples. Scale bar indicates the standardized expression value. (E) ZBED2 expression in human organoids derived from normal pancreas or neoplastic PDA samples. (F and G) ZBED2 expression in normal tissues from the GTEx portal (F) or tumors from the TCGA Pan-Cancer Atlas (G). Arrow indicates pancreas tissue. ACC, adrenocortical carcinoma; BLCA, bladder urothelial carcinoma; BRCA, breast invasive carcinoma; CESC, cervical squamous cell carcinoma and endocervical adenocarcinoma; CHOL, cholangiocarcinoma; DLBC, lymphoid neoplasm diffuse large B-cell lymphoma; ESCA, esophageal carcinoma; GBM, glioblastoma multiforme; HNSC, head and neck squamous cell carcinoma; KICH, kidney chromophobe; KIRC, kidney renal clear cell carcinoma; KIRP, kidney renal papillary cell carcinoma; LAML, acute myeloid leukemia; LGG, brain lower-grade glioma; LIHC, liver hepatocellular carcinoma; LUAD, lung adenocarcinoma; LUSC, lung squamous cell carcinoma; MESO, mesothelioma; OV, ovarian serous cystadenocarcinoma; PAAD, pancreatic adenocarcinoma; PCPG, pheochromocytoma and paraganglioma; PRAD, prostate adenocarcinoma; SARC, sarcoma; SKCM, skin cutaneous melanoma; STAD, stomach adenocarcinoma; TGCT, testicular germ cell tumors; THCA, thyroid carcinoma; THYM, thymoma; UCEC, uterine corpus endometrial carcinoma; UCS, uterine carcinosarcoma; UVM, uveal melanoma. (H and I) Survival curves of patients stratified according to high or low ZBED2 expression. P value calculated using the log-rank (Mantel-Cox) test. (J) ZBED2 expression in cancer cell lines from the CCLE (44). Arrow indicates pancreas tissue. See also SI Appendix, Fig. S1.
Fig. 2.
Fig. 2.
ZBED2 inhibits the expression of genes in the IFN response pathway. (A) Western blot analysis for ZBED2 and IFN pathway components in human PDA cell lines. (B) GSEA following ZBED2 knockout in PANC0403 cells (Left) or ZBED2 cDNA expression in HPAFII cells (Right) versus their respective controls. Normalized enrichment score (NES) and family-wise error rate (FWER) P value were ranked and plotted for genes sets within MSigDB v7.0. Each gene set is depicted as a single dot. (C and D) GSEA plots evaluating the IFN response signature upon ZBED2 knockout in PANC0403 cells (C) or ZBED2 cDNA expression in HPAFII cells (D). (E) Gene-expression changes in HPAFII cells infected with ZBED2 cDNA versus empty vector control. ZBED2, STAT2, MX1, and CMPK2 are labeled along with their rank. (F) Western blot analysis for HSC70, ZBED2, STAT2, and MX1 following ZBED2 cDNA expression in HPAFII and PANC0403 cells. (G) ZBED2 expression versus the median expression value of IFN response genes across 15 PDA cell lines. (H) Median expression values of IFN response genes across all cancer cell lines within the CCLE database (Left) or in the indicated lineages stratified according to high or low ZBED2 expression. Each cell line is depicted as a single dot. **P < 0.01, ***P < 0.001 by Student’s t test. (I) Schematic representation of IFN signaling pathways. Modified from ref. . (J) Western blot analysis for HSC70, ZBED2, and the indicated IFN pathway components following 12-h stimulation with IFN-β or IFN-γ in AsPC1-ZBED2 cells or the empty vector. See also SI Appendix, Fig. S2.
Fig. 3.
Fig. 3.
ChIP-seq analysis implicates ZBED2 as a sequence-specific repressor of ISG promoters. (A) Density plots showing FLAG-ZBED2 and H3K27ac enrichment surrounding a 2-kb interval centered on the summit of 2,451 high-confidence ZBED2 peaks in AsPC1 and SUIT2 cells, ranked by FLAG-ZBED2 peak intensity in AsPC1 cells. (B) Pie chart showing the distribution of FLAG-ZBED2 peaks. TSS, transcription start site; TTS, transcription termination site; UTR, untranslated region. (C) GSEA plot evaluating ZBED2 bound genes upon ZBED2 cDNA expression in HPAFII cells. Leading edge, IFN response genes are listed. (D) GAL4 fusion reporter assay testing full-length ZBED2 and IRF1 transactivation activity normalized to Renilla luciferase internal control. Mean + SEM is shown. n = 3. **P < 0.01, ***P < 0.001 by Student’s t test. (E) ZBED2 ChIP-seq–derived de novo motif logo, distribution, and E-value for the ZBED2 binding. (F) Metaprofile comparing ZBED2 occupancy in AsPC1 cells around the center of peaks with 0, 1, or ≥2 motif counts. (G) GSEA evaluating ZBED2 bound genes at promoter regions with 0, 1, or ≥2 motif counts upon ZBED2 cDNA expression in 15 PDA cell lines. (H) ZBED2 motif density frequency in the human genome. (I) Gene ontology (GO) analysis for genes annotated by HOMER to promoter regions with ≥2 ZBED2 motif counts. Terms are ranked by their significance (P value) and the most significant term is highlighted. (J) ChIP-seq profiles of FLAG-ZBED2 in AsPC1 cells and H3K27ac in HPAFII cells at the promoters of MX1, CMPK2, and STAT2. See also SI Appendix, Fig. S3.
Fig. 4.
Fig. 4.
Antagonistic regulation of ISG promoters by ZBED2 and IRF1. (A) CentriMo analysis for JASPAR motifs at ZBED2 binding sites. (B) ZBED2 and IRF1 expression across 15 human PDA cell lines. (C) Density plot showing IRF1 and FLAG-ZBED2 enrichment surrounding a 2-kb interval centered on the summit of 140 intersecting IRF1 and FLAG-ZBED2 sites in AsPC1 cells, ranked by IRF1 peak intensity. (D) ChIP-seq profiles of IRF1 and FLAG-ZBED2 in AsPC1 cells at the promoters of CMPK2 and STAT2. (E) GO analysis of genes annotated by HOMER to IRF1/ZBED2 sites. Terms are ranked by their significance (P value) and the most significant terms (−log10 P > 12) are shown. (F) RT-qPCR analysis of CMPK2 in AsPC1-empty and AsPC1-ZBED2 cells following IRF1 cDNA expression. Mean+SEM is shown. n = 3. **P < 0.01 by Student’s t test. (G and H) GSEA plots evaluating protein coding genes annotated by HOMER to IRF1/ZBED2 sites upon IRF1 (G) or ZBED2 (H) cDNA expression in AsPC1 cells. (I) Expression levels of protein coding genes annotated to IRF1/ZBED2 sites following 12-h treatment with 0.2 ng/μL of IFN-β, IFN-γ, or control. ****P < 0.0001, **P < 0.01 *P < 0.05 by one-way ANOVA. (J) IRF1 motif logo from the JASPAR database (Upper) and the ZBED2 motif logo (Lower). (K) ChIP-seq analysis showing the log2 fold-change in IRF1 occupancy at IRF1 binding sites in AsPC1-ZBED2 versus AsPC1-empty cells. (L) ChIP-seq profiles of FLAG-ZBED2 and IRF1 at the promoters of CMPK2 (Left) and STAT2 (Right) in AsPC1-empty or AsPC1-ZBED2 cells. ZBED2 and IRF1 motifs recovered by Find Individual Motif Occurrences (P < 0.001) are highlighted in purple and yellow, respectively. See also SI Appendix, Fig. S4.
Fig. 5.
Fig. 5.
ZBED2 protects PDA cells from IRF1- and IFN-γ–induced growth arrest. (A) Luciferase-based quantification of cell viability of AsPC1 cells grown in Matrigel on day 7 postinfection with IRF1 cDNA or the empty vector. Representative bright-field images (Right) are shown. (Scale bar, 200 μm.) ***P < 0.001 by Student’s t test. (B) Luciferase-based quantification of cell viability of AsPC1-empty and AsPC1-ZBED2 cells following coexpression of IRF1 cDNA or empty vector for 7 d. ***P < 0.001 by Student’s t test. (C) Representative bright-field images from B. (Scale bar, 500 μm.) (D) Luciferase-based quantification of cell viability of KPC-derived FC1199 cells expressing ZBED2 or the empty vector following coexpression of IRF1 cDNA or empty vector for 7 d. (E) Representative bright-field images from D. (Scale bar, 200 μm.) ***P < 0.001 by Student’s t test. (FH) AsPC1 cells infected with sgRNAs targeting IRF1, IRF9, or a control sgRNA (sgNEG) were plated in Matrigel and grown for 7 d in the presence of 20 ng/μL of IFN-γ, IFN-β, or control. Representative Western blots following overnight stimulation with 20 ng/μL of IFN-γ (F), luciferase-based quantification (G), and bright-field images on day 7 (H) are shown. ***P < 0.001 by Student’s t test. (Scale bar, 500 μm.) (I and J) AsPC1 cells (I) or the indicated KPC cell lines (J) were infected with the ZBED2 cDNA or an empty vector and grown in Matrigel with the increasing concentrations of IFN-γ. Bar charts show luciferase-based quantification on day 7. Mean + SEM is shown. n = 3. For I and J, ***P < 0.001, **P < 0.01, *P < 0.05 by one-way ANOVA. See also SI Appendix, Fig. S5.
Fig. 6.
Fig. 6.
ZBED2 represses pancreatic progenitor lineage identity in PDA. (AC) TF expression in molecular subtypes of PDA. TFs are ranked by their mean log2 fold-change in Basal-like vs. classic (A and C) or bquamous vs. progenitor (B) patient samples from the indicated studies. (DF) ZBED2 expression in PDA patient samples stratified according to molecular subtype. Each dot represents one patient sample. P value was calculated using Student’s t test. (G) GSEA evaluating the progenitor PDA Identity signature upon ZBED2 cDNA expression in 15 PDA cell lines. (H and I) GSEA plots evaluating the progenitor-PDA Identity signature following expression of ZBED2 (H) or IRF1 (I) in AsPC1 cells. (J) Overlap of progenitor PDA identity genes with protein coding genes associated with IRF1/ZBED2 sites. (K) ChIP-seq profiles of IRF1 and FLAG-ZBED2 at the promoter of GATA6 in AsPC1 cells. (L) Overlap of leading edge (LE) genes associated with IRF1/ZBED2 sites that are repressed by ZBED2 or activated by IRF1 in AsPC1 cells. (M) Quantification of colony size in Matrigel assays. Means + SEM are shown. n = 3. Representative images at day 7 are shown (Right). (N) Quantification of scratch assays at the indicated time points postseeding and representative images (Right). (Scale bar, 500 μm.) Means + SEM are shown. n = 3. ***P < 0.001, **P < 0.01 *P < 0.05 by Student’s t test; ns, not significant. See also SI Appendix, Fig. S6.

References

    1. Yuan S., Norgard R. J., Stanger B. Z., Cellular plasticity in cancer. Cancer Discov. 9, 837–851 (2019). - PMC - PubMed
    1. Merrell A. J., Stanger B. Z., Adult cell plasticity in vivo: De-differentiation and transdifferentiation are back in style. Nat. Rev. Mol. Cell Biol. 17, 413–425 (2016). - PMC - PubMed
    1. Grippo P. J., Nowlin P. S., Demeure M. J., Longnecker D. S., Sandgren E. P., Preinvasive pancreatic neoplasia of ductal phenotype induced by acinar cell targeting of mutant Kras in transgenic mice. Cancer Res. 63, 2016–2019 (2003). - PubMed
    1. Kopp J. L., et al. , Identification of Sox9-dependent acinar-to-ductal reprogramming as the principal mechanism for initiation of pancreatic ductal adenocarcinoma. Cancer Cell 22, 737–750 (2012). - PMC - PubMed
    1. De La O J. P., et al. , Notch and Kras reprogram pancreatic acinar cells to ductal intraepithelial neoplasia. Proc. Natl. Acad. Sci. U.S.A. 105, 18907–18912 (2008). - PMC - PubMed

Publication types

MeSH terms