. 2020 May 8;11(1):2266.
doi: 10.1038/s41467-020-16135-6.

Par complex cluster formation mediated by phase separation

Affiliations

Par complex cluster formation mediated by phase separation

Ziheng Liu et al. Nat Commun. .

Abstract

The evolutionarily conserved Par3/Par6/aPKC complex regulates the polarity establishment of diverse cell types and distinct polarity-driven functions. However, how the Par complex is concentrated beneath the membrane to initiate cell polarization remains unclear. Here we show that the Par complex exhibits cell cycle-dependent condensation in Drosophila neuroblasts, driven by liquid-liquid phase separation. The open conformation of Par3 undergoes autonomous phase separation likely due to its NTD-mediated oligomerization. Par6, via C-terminal tail binding to Par3 PDZ3, can be enriched to Par3 condensates and in return dramatically promote Par3 phase separation. aPKC can also be concentrated to the Par3N/Par6 condensates as a client. Interestingly, activated aPKC can disperse the Par3/Par6 condensates via phosphorylation of Par3. Perturbations of Par3/Par6 phase separation impair the establishment of apical-basal polarity during neuroblast asymmetric divisions and lead to defective lineage development. We propose that phase separation may be a common mechanism for localized cortical condensation of cell polarity complexes.


Conflict of interest statement

The authors declare no competing interests.

Figures

Fig. 1
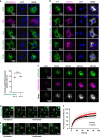
Fig. 1. Endogenous Par proteins form condensed puncta in Drosophila larval NBs in a cell cycle-dependent manner.
a Schematic diagram showing the view planes. b Representative image of endogenous Baz, Par6, aPKC, and Mira at different cell cycle stages (n = 10 neuroblasts collected from ten larval brains over three independent experiments). ToPro-3 in blue. Yellow arrowheads indicate condensed puncta on the apical cortex. Scale bars, 5 μm. Experiments were performed three times independently with similar results.
Fig. 2
Fig. 2. Par proteins spontaneously form condensed and dynamic puncta in COS7 cells.
a, b Representative images showing subcellular localizations of GFP- or mCherry-tagged Par complex components, including various Par3 fragments (full length, Δ4N12, and Par3N), Par6β, and PKCι, when expressed individually a or mutually b in COS7 cells. Yellow arrowheads indicate condensed puncta in the cytoplasm. Nuclei were stained by DAPI. The lower panel of a is the statistical data for the puncta formation of GPF-tagged Par3 Δ4N12 and Par3N. n = number of independent experimental cell culture batches, with 800 cells counted for each batch. Specimens’ statistics are presented as mean ± SEM; ns, not significant, using one-way ANOVA with Tukey’s multiple comparison test. c Representative time-lapse images showing that the GFP-Par3N and mCherry-Par6β-positive puncta undergo time-dependent fusion. d Representative time-lapse FRAP images showing that GFP-Par3N signal within the GFP-Par3N/Flag-Par6β condensed puncta recovered within a few minutes. e Representative time-lapse FRAP images of GFP-Par6β in the HA-Par3N/GFP-Par6β condensed puncta. f Statistical data for d and e. The red curve represents the averaged FRAP data of 20 puncta from 14 cells. The black curve represents the averaged FRAP data of 25 puncta from 13 cells. Time 0 refers to the time point of the photobleaching pulse. Experiments were performed three times independently with similar results. All data are represented as mean ± SD. All the constructs are listed in Supplementary Table 1. Source data are provided as a Source data file.
Fig. 3
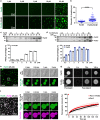
Fig. 3. Par6β promoted LLPS of Par3N in vitro.
a Protein concentration-dependent LLPS of Par3N or Par3N/Par6β complex. Only Par3N was iFluorTM 488 labeled. The fluorescence imaging settings were identical for easy comparison. Images were acquired at ~2 min after injecting the mixture into the chamber. b Column scatter charts show the droplet size of Par3N (25 µM, n = 250 droplets examined over five independent observation fields) or Par3N/Par6β complex (25 µM, n = 250 droplets examined over five independent observation fields). Data are shown as mean ± SEM. ns, not significant; *p < 0.05, **p < 0.01, ***p < 0.001, and ****p < 0.0001 using one-way ANOVA with Tukey’s multiple comparison test. c, d Representative SDS–PAGE analysis and quantification data showing the distribution of proteins between aqueous solution/supernatant (S) and condensed liquid phase/pellet (P) fractions. Par3N and Par6β were mixed at a 1:0 f or 1:1 g molar ratio at various concentrations. Experiments were performed three times independently with similar results. Data are expressed as mean ± SD. e, f The time-lapse images showing the localization of iFluorTM 488-Par3N e or co-localization of iFluorTM 488-Par3N and Cy3-Par6β complex f in the droplets with enriched concentrations. The enlarged images at right show that small droplets undergo time-dependent coalescence into larger ones. The 0 min images were acquired at ~5 min after injecting the mixture into the chamber. g FRAP analysis of iFluorTM 488-Par3N droplets in the absence or presence of Par6β in vitro showing the exchange kinetics of the protein in droplets with the surrounding aqueous solution. The curves below represent FRAP recovery curves of iFluorTM 488-Par3N (with or without Par6β) by averaging signals of 20 droplets with similar sizes each after photobleaching. Time 0 refers to the time point of the photobleaching pulse. Experiments were performed three times independently with similar results. Data are represented as mean ± SD. Source data are provided as a Source data file.
Fig. 4
Fig. 4. Par3 recognizes Par6 via the interaction between Par3 PDZ3 and Par6 PBM.
a Schematic diagrams showing the domain organizations of Par3, Par6β, and PKCι. Amino acid sequences of the PBM from mouse Par6α, Par6β, Par6γ, and Drosophila Par6 are present bellow, with the completely conserved residues colored in red. b Cell lysate GST pull-down assay of various GST-tagged rat Par3 fragments (NTD, PDZ1, PDZ2, PDZ3, or Par3N) with Flag-Par6β. Par3 PDZ3 specifically bound to Par6β, and the interaction was strongly enhanced by Par3 NTD. c Cell lysate GST pull-down assay of various GST-tagged mouse Par6β fragments (PB1, Crib-PDZ, PBM, PB1-Crib-PDZ, Crib-PDZ-PBM, or full-length Par6β) with Flag-Par3N. Par6β PBM specifically bound to Par3, which was sharply enhanced by Par6β PB1. d Fluorescence polarization-based measurements of the binding affinities between Par3 PDZs (PDZ1, PDZ2, PDZ3, or PDZ3 G600, 602 A) and various Par6 (Par6α, Par6β, or Par6γ) PBM peptide. e Ribbon representation of the Par3 PDZ3 (green)/Par6β PBM (purple) complex. Key residues involved in Par3/Par6 binding are shown as a ball-and-stick model. f Combined surface (Par3 PDZ3) and stick (Par6β PBM) diagram of the complex. In the surface map, hydrophobic residues are colored in yellow, positively charged residues in blue, negatively charged residues in red, and other residues in white. Experiments were performed three times independently with similar results. All the constructs are listed in Supplementary Table 1. Source data are provided as a Source data file.
Fig. 5
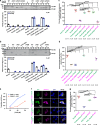
Fig. 5. Multivalent and specific protein–protein interactions drive LLPS of Par3N/Par6β complex.
a Sedimentation assay of various Par3N fragments (WT, ΔNTD, ΔPDZ1, and ΔPDZ3), Par6β, or both proteins mixed at a 1:1 molar ratio at 3 μM. The NTD and PDZ3 domains of Par3 are critical for the phase separation of the Par3N/Par6β complex. b Sedimentation assay of Par3N, various Par6β fragments (WT, ΔPB1, ΔCrib-PDZ, and ΔPBM), or both proteins mixed at a 1:1 molar ratio at 3 μM. The PB1 and PBM of Par6β are critical for the phase separation of the Par3N/Par6β complex. All statistic data in a and b represent the results from three independent batches of experiments and are expressed as mean ± SD. c Puncta formation summary for co-expression of GFP-Par3 WT or various mutants (Par3N, Par3N NTDmu, Par3N ΔPDZ1, Par3N ΔPDZ2, Par3N ΔPDZ12, and Par3N ΔPDZ3) with mCherry-Par6β or mCherry vector (Mock) in COS7 cells. Statistical data for Supplementary Fig. 4a. d Puncta formation summary for co-expression of GFP-Par3N with various mCherry-Par6 fragments (Par6β, Par6β ΔPB1, Par6β ΔCrib-PDZ, Par6β ΔPBM, Par6γ, Par6γ ΔPBM, Par6α, and Par6α chimera) in COS7 cells. Statistical data for Supplementary Fig. 4b. e Phase separation/turbidity diagram for FUSL (1–214) and FUSS (1–141). Error bars, mean ± SEM, n = 5. f Representative images showing expression of GFP-Par3N WT or various mutants (Par3N NTDmu, FUSL-Par3N with NTD replaced by FUSL, FUSS-Par3N with NTD replaced by FUSS) with mCherry-Par6β in COS7 cells. Nuclei were stained by DAPI. g Statistical data for f. n = number of independent experimental cell culture batches, with 800 cells counted for each batch. Specimens’ statistics are presented as mean ± SEM; ns, not significant; *p < 0.05, **p < 0.01, ***p < 0.001, and ****p < 0.0001 using one-way ANOVA with Tukey’s multiple comparison test. All the constructs are listed in Supplementary Table 1. Source data are provided as a Source data file.
Fig. 6
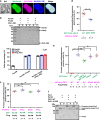
Fig. 6. PKCι activity may regulate the LLPS of Par3N/Par6β.
a The fluorescent images showing that the co-localization of iFluorTM 488-Par3N, Cy3-Par6β, and 405-PKCι PB1 in the droplets with enriched concentration. b Sedimentation assay and quantification data showing that PKCι PB1 can participate the LLPS of Par3N/Par6β complex as a client with no effect on the extent of LLPS. n = 3 biologically independent experiments. Data are represented as mean ± SD. c Puncta formation summary for co-localization and condensation of Par3N, Par6β, and PKCι in COS7 cells. Statistical data for Supplementary Fig. 5a. Co-expression of PKCι full-length protein did not enhance or impair LLPS of Par3N/Par6β. d Puncta formation summary for co-expression of GFP-Par3 Δ4N12 WT or the aPKC phospho-mimetic S827,829E mutant with mCherry-Par6β in COS7 cells. Statistical data for Supplementary Fig. 5b. e Puncta formation summary for co-expression of GFP-Par3 WT, Δ4N12 or the phospho-mimetic Δ4N12 S827,829E with Flag-Par6β, and mCherry-PKCι WT, the constitutively active A120E, or the kinase-dead K273R mutant in COS7 cells. Statistical data for Supplementary Fig. 5c. n = number of independent experimental cell culture batches, with 800 c, d or 600 e cells counted for each batch. Specimens’ statistics are presented as mean ± SEM; ns, not significant; *p < 0.05, **p < 0.01, ***p < 0.001, and ****p < 0.0001 using one-way ANOVA with Tukey’s multiple comparison test. f Sedimentation assay showing the distribution of proteins (Par3 1–854, Par6β, PKCι WT, or A120E mutant) between aqueous solution/supernatant (S) and condensed liquid phase/pellet (P) fractions. Both PKCι WT and A120E mutant phosphorylated Par3 1–854 in the supernatant fraction but not in the pellet fraction. The band of phosphorylated Par3 1–854 was resolved by Phos-tag PAGE. Experiments were performed three times independently with similar results. Source data are provided as a Source data file.
Fig. 7
Fig. 7. LLPS of Baz/Par6 complex is required for their apical condensation during ACD of Drosophila larval NBs.
ToPro-3 in white. Red arrowheads indicate apical cortex. Scale bars, 5 μm. a, b Expressing Flag-Baz WT or mutant variants (a, using an actin “Flip-out” system marked by GFP) or Flag-Par6 WT or ∆PB1 (b, using a UAS/GAL4 system driven by insc-gal4) in WT NBs of larval brains. Flag-Baz WT, Flag-Baz ∆PDZ2, and Flag-Par6 WT are localized on the apical cortex. Flag-Baz NTDmu and Flag-Baz PDZ3mu are diffused on the whole cortex and cytoplasm, whereas Flag-Par6 ∆PB1 is largely diffused in the cytoplasm. c Statistical data for a. For Flag-Baz WT, Flag-Baz NTDmu, Flag-Baz ∆PDZ2, and Flag-Baz PDZ3mu, n = 11, 23, 19, or 17 NBs collected from 30 larval brains for each genotype over three independent experiments, respectively. d Statistical data for b. For Flag-Par6 WT and Flag-Par6 ∆PB1, n = 20 or 19 NBs collected from ten larval brains for each genotype over three independent experiments, respectively. e Representative images showing Flag and Baz localization in NBs (marked by GFP using MARCM technique, see Methods section) from WT, baz mutant, or baz mutant expressing a Flag-Baz WT or mutant variants. f Statistical data for e. For WT, baz;Flag-Baz WT, baz;Flag-Baz NTDmu, baz;Flag-Baz ∆PDZ2, and baz;Flag-Baz PDZ3mu, n = 20, 5, 5, 5, and 8 NBs collected from 30 larval brains for each genotype over three independent experiments, respectively. g Representative images showing Flag and Par6 localization in NBs derived from WT, par6 mutant, or par6 mutant expressing a Flag-Par6 WT or ΔPB1 mutant. h Statistical data for g. For WT, par6;Flag-Par6 WT and par6;Flag-Par6 ∆PB1, n = 20, 5, and 9 NBs collected from 30 larval brains for each genotype over three independent experiments, respectively. For all the statistical data, mean ± 95% confidence interval is shown; ns, not significant; *p < 0.05, **p < 0.01, ***p < 0.001, and ****p < 0.0001 using one-way ANOVA with Tukey’s multiple comparison test. All the constructs are listed in Supplementary Table 1. Source data are provided as a Source data file.
Fig. 8
Fig. 8. LLPS of Baz/Par6 is critical for neuronal differentiation in Drosophila NBs.
ToPro-3 is in white, GFP in green. Scale bars, 5 µm. a Representative images showing NB lineage marked by MARCM method for WT, baz mutant clone, or baz mutant clone rescued with WT or different variants. It is noted that the defective lineage development phenotype of baz mutant NBs could be largely rescued with Flag-Baz WT and Flag-Baz ΔPDZ2, and only partially rescued by the LLPS less efficient Flag-Baz NTDmu and Flag-Baz PDZ3mu, but could not be rescued with Flag-Par6. b Statistical data for a. For WT, baz, baz;Flag-Baz, baz;Flag-Baz NTDmu, baz;Flag-Baz ∆PDZ2, baz;Flag-Baz PDZ3mu, and baz;Flag-Par6, n = 20, 20, 20, 20, 20, 10, and 20 NBs collected from 30 larval brains for each genotype over three independent experiments, respectively. c Representative images showing that par6 mutant NB lineage harboring less progeny that is largely reverted by expression of Flag-Par6 WT but cannot be rescued by the LLPS less efficient Flag-Par6 ΔPB1 variant or Flag-Baz. d Statistical data for c. For WT, par6, par6;Flag-Par6, par6;Flag-Par6 ∆PB1, and par6;Flag-Baz, n = 20, 20, 20, 15, and 16 NBs collected from 30 larval brains for each genotype over three independent experiments, respectively. For all the statistical data, mean ± 95% confidence interval is shown. ns, not significant; *p < 0.05, **p < 0.01, ***p < 0.001, and ****p < 0.0001 using one-way ANOVA with Tukey’s multiple comparison test. All the constructs are listed in Supplementary Table 1. Source data are provided as a Source data file.
Fig. 9
Fig. 9. NTD-mediated Par clustering relies on its oligomerization-dependent LLPS behavior.
a Representative images of knock-in larval NBs expressing GFP-tagged Baz WT, Baz ΔNTD, or FUSS-Baz chimera visualized with GFP, Par6, aPKC, or Mira. ToPro-3 in blue. Scale bars, 5 μm. b Statistical analysis of ACD protein localization for a. For Baz apical cortical intensity, Baz WT, Baz ΔNTD, and FUSS-Baz, n = 24, 67, and 29 NBs collected from 30 larval brains for each genotype over three independent experiments, respectively. For Par6 apical cortical intensity, w1118, Baz WT, Baz ΔNTD, and FUSS-Baz, n = 10, 10, 26, and 14 NBs collected from 15 larval brains for each genotype over three independent experiments, respectively. For aPKC apical cortical intensity, w1118, Baz WT, Baz ΔNTD, and FUSS-Baz, n = 10, 25, 39, and 32 NBs collected from 15 larval brains for each genotype over three independent experiments, respectively. For Mira basal cortical intensity, w1118, Baz WT, Baz ΔNTD, and FUSS-Baz, n = 10, 34, 46, and 21 NBs collected from 15 larval brains for each genotype over three independent experiments, respectively. c Representative images showing overview of larval brains expressing knock-in GFP-tagged Baz WT, Baz ΔNTD, or FUSS-Baz chimera. d Statistical data measuring brain size presented in for c. n = 10 larval brains over three independent experiments. e, f Representative time-lapse FRAP images showing that recovery of knock-in GFP-Baz WT e or GFP-FUSS-Baz f signal within the preformed crescent occurred within a few minutes. g Statistical data for e and f. For GFP-Baz WT and GFP-FUSS-Baz, n = 13 and 9 NBs collected from 15 larval brains for each genotype over three independent experiments, respectively. h Model for Par proteins local condensation during the ACD of Drosophila NBs. For simplicity, the basal daughter cell was omitted. All the constructs are listed in Supplementary Table 1. For all the statistical data, mean ± 95% confidence interval is shown. ns, not significant; *p < 0.05, **p < 0.01, ***p < 0.001, and ****p < 0.0001 using one-way ANOVA with Tukey’s multiple comparison test. Source data are provided as a Source data file.

References

    1. Nelson WJ. Adaptation of core mechanisms to generate cell polarity. Nature. 2003;422:766–774. doi: 10.1038/nature01602. - DOI - PMC - PubMed
    1. St Johnston D, Ahringer J. Cell polarity in eggs and epithelia: parallels and diversity. Cell. 2010;141:757–774. doi: 10.1016/j.cell.2010.05.011. - DOI - PubMed
    1. Rodriguez-Boulan E, Macara IG. Organization and execution of the epithelial polarity programme. Nat. Rev. Mol. Cell Biol. 2014;15:225–242. doi: 10.1038/nrm3775. - DOI - PMC - PubMed
    1. Wen W, Zhang M. Protein complex assemblies in epithelial cell polarity and asymmetric cell division. J. Mol. Biol. 2018;430:3504–3520. doi: 10.1016/j.jmb.2017.09.013. - DOI - PubMed
    1. Kemphues K. PARsing embryonic polarity. Cell. 2000;101:345–348. doi: 10.1016/S0092-8674(00)80844-2. - DOI - PubMed

Publication types

MeSH terms

LinkOut - more resources