. 2020 May 8;11(1):2280.
doi: 10.1038/s41467-020-16158-z.

Distinct fate, dynamics and niches of renal macrophages of bone marrow or embryonic origins

Affiliations

Distinct fate, dynamics and niches of renal macrophages of bone marrow or embryonic origins

Fengming Liu et al. Nat Commun. .

Abstract

Renal macrophages (RMs) participate in tissue homeostasis, inflammation and repair. RMs consist of embryo-derived (EMRMs) and bone marrow-derived RMs (BMRMs), but the fate, dynamics, replenishment, functions and metabolic states of these two RM populations remain unclear. Here we investigate and characterize RMs at different ages by conditionally labeling and ablating RMs populations in several transgenic lines. We find that RMs expand and mature in parallel with renal growth after birth, and are mainly derived from fetal liver monocytes before birth, but self-maintain through adulthood with contribution from peripheral monocytes. Moreover, after the RMs niche is emptied, peripheral monocytes rapidly differentiate into BMRMs, with the CX3CR1/CX3CL1 signaling axis being essential for the maintenance and regeneration of both EMRMs and BMRMs. Lastly, we show that EMRMs have a higher capacity for scavenging immune complex, and are more sensitive to immune challenge than BMRMs, with this difference associated with their distinct glycolytic capacities.


Conflict of interest statement

The authors declare no competing interests.

Figures

Fig. 1
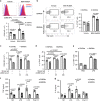
Fig. 1. Postnatal expansion and maturation of RMs parallel renal growth.
a Representative flow cytometry plots show the percentage of CD11b+F4/80high (cycled area) RMs among CD45 + leukocytes at different ages. b, c Absolute CD11b+F4/80high RMs cell counts (b) and density of RMs (counts/kidney weight) (c) at different ages. Data are pooled from two independent experiments (b: n = 3 mice for P7,14,21; n = 4 mice for P1,105; n = 5 mice for P56. c: n = 3 mice for P1,7,14,21; n = 4 mice for P105; n = 5 mice for P56). d Intracellular staining of Ki67 (proliferative marker) in RMs. Ki67 was detected after surface staining of RMs and the percentage of Ki67+ RMs at different ages is quantified. Data are pooled from two independent experiments (n = 4 mice for P1,91; n = 3 mice for P7,14,21,56). e Representative flow cytometry plots show major histocompatibility II (MHCII) and CD11b expression on RMs over time at P1, 7, 14, 21, and 56. All data are presented as mean ± s.e.m. Source data are provided as a Source Data file.
Fig. 2
Fig. 2. RMs are mainly derived from fetal liver and self-maintain through adulthood with a consistent contribution from peripheral monocytes.
a Schematic overview of tamoxifen (Tam) injection at embryonic (E) stage followed by analysis after birth. b Histogram of Tdtomato or hCD59 expression by microglia of newborn (P0) Cx3cr1CreER+/−/R26Tdt+/− (left) or Cx3cr1CreER+/−/ihCD59+/− mice (right) treated with Tam on E8.5, E13.5, or E18.5. Data are pooled from three independent Tam injections (n = 5 P0 pups for E18.5-hCD59 group; n = 3 P0 pups for all other groups). c Histogram of hCD59 expression by RMs of newborn (P0) Cx3cr1CreER+/−/ihCD59+/ mice treated with Tam on E8.5, E13.5, or E18.5. Data are pooled from two independent Tam injections (n = 3 P0 pups for E8.5/13.5 group; n = 5 P0 pups for E18.5 group). d The percentages of hCD59+ microglia, renal macrophage and blood monocyte at various time points after labeling on E18.5 (n = 5 mice per time point per group). e Ki67 staining of hCD59+ embryo-derived renal macrophages (EMRMs) and hCD59- bone-marrow-derived renal macrophages (BMRMs) at P28 and P91 after labeling on E18.5 (n = 3 mice for P28; n = 6 mice for P91). f 2-month-old Cx3cr1CreER+/−/ihCD59+/− mice were treated with Tam and analyzed for hCD59+ microglia, renal macrophage, and blood monocyte from 7 to 378 days after labeling. The percentages of hCD59+ microglia, renal macrophage, and blood monocyte are quantified. Data are pooled from two independent experiments (n = 4 mice per time point per group). All data are presented as mean ± s.e.m. p-values by two-tailed unpaired t-test are indicated in e, n.s. indicates p > 0.05. Source data are provided as a Source Data file.
Fig. 3
Fig. 3. Localization of EMRMs and BMRMs in kidney.
a Representative immunofluorescence (IF) staining of EYFP (green) and DAPI (blue) and b quantification of EYFP+ cells in kidney cortex and medulla/pelvis of adult Cx3cr1CreER+/− mice. Asterisk indicate glomerulus in cortex. Each dot in b represents the average cell numbers per field (×20 magnification) from one mouse (mean ± s.e.m., two-tailed unpaired t-test, n = 4 mice per group). c Representative IF staining of EYFP (green) and Tdtomato (Tdt, red) in cortex and medulla/pelvis of adult E18.5-Tam-Cx3cr1CreER+/−/R26Tdt+/− mice. Yellow staining cells in merged image are EMRMs. Asterisk indicate glomerulus in cortex. d Quantification of the percentage of Tdt+ EMRMs in all RMs of cortex and medulla/pelvis. Each dot represents the average cell numbers per field (×20 magnification) from one mouse (mean ± s.e.m., two-tailed unpaired t-test, n = 5 mice per group). Source data are provided as a Source Data file.
Fig. 4
Fig. 4. Peripheral monocytes rapidly differentiate into long-lived RMs after niche is emptied.
a Representative flow cytometry plots of the percentage of CD11b+F4/80high (cycled area) RMs among CD45+ leukocytes and b RMs cell counts at different days (D1, D3, and D7) after ILY injection (120 ng/g body weight, i.v.) or without ILY (No ILY). Data are representative of two independent experiments (n = 3 mice per time point per group). c hCD59 expression on original (D0) and regenerated RMs (D7 after ILY; n = 3 mice per group). d Schematic overview of generation and treatment of chimeric mice by partially irradiating recipient (CD45. 2+) male mice followed by reconstitution with the CD45.1+ wild type (WT), bone marrow (BM), and ILY injection. Dot plots show CD45.1 (Donor) and CD45.2 (Host) expression on peripheral monocyte (upper panels) and RMs (lower panels) before, 1 day (d) or 2 weeks (w) after ILY-mediated RMs depletion (dpI). e No significant difference in donor chimerism (CD45.1/CD45.1+CD45.2) between monocyte and regenerated RMs at 2 weeks after ILY injection (also shown in the right panel of the dot plots, n = 4 mice per group). f Schematic overview of bone marrow transplantation (BMT) and tamoxifen (Tam) injection. g Cell counts of CD45.2+ RMs in age-matched CD45.2+Cx3cr1CreER+/−/ihCD59+/− and chimeric CD45.1+ male mice 5 weeks after BMT (n = 4 mice per group). h hCD59 expression on original CD45.2+ RMs and regenerated RMs in chimeric mice 16 weeks after tamoxifen (n = 4 mice per group). All data are presented as mean ± s.e.m. p-values by two-tailed unpaired t-test are indicated in b, c, e, g, h, n.s. indicates p > 0.05. Source data are provided as a Source Data file.
Fig. 5
Fig. 5. CX3CR1/CX3CL1 axis is required for RMs regeneration under normal and pathologic conditions.
a Serum CX3CL1 level after ILY injection (120 ng/g b.w.) in Cx3cr1CreER+/− and Cx3cr1CreER+/−/ihCD59+/− mice. Day-0 indicates no ILY injection. Data are pooled from three independent experiments (Cx3cr1CreER+/− group: n = 5 mice for Days 0, 2, and 7 and n = 8 mice for Days 1 and 3; Cx3cr1CreER+/−/ihCD59+/− group: n = 8 mice for Days 0, 1, and 3 and n = 5 mice for Days 2 and 7). b CX3CL1 level in kidney homogenate at 1-day post ILY injection. CX3CL1 protein level was normalized by total protein of homogenate (n = 4 mice per group). c Percentage of RMs (circled area) in CD45+ cells (left, dot plots) and absolute cell counts (right, column graph) at 7 days after ILY injection under CX3CR1 sufficient (+/−) and deficient (−/−) conditions. Data are pooled from two independent experiments. (n = 7 mice per group). d Schematic overview of the experiment. CD45.1+ WT male mice were lethally irradiated and reconstituted with WT, Cx3cr1−/− or Ccr2−/− BM (CD45.2+). Regeneration of tissue macrophages (mac) or monocytes in kidney, spleen, and lung was determined 5 weeks later. e, f Number of donor-derived TMs and monocytes in kidney, spleen, and lung 5 weeks after BMT. e WT vs Cx3cr1−/− (f) WT vs Ccr2−/− (n = 4 mice per group). All data are presented as mean ± s.e.m. p-values by two-tailed unpaired t-test are indicated in ac, e, f. Source data are provided as a Source Data file.
Fig. 6
Fig. 6. EMRMs have higher capacity to scavenge immune complex than BMRMS.
a Flow cytometry analysis of BSA-RαBSA immune complex (IC) uptake by renal myeloid cells at 2 h after i.v. injection of 50 μg BSA-Alexa 647 + 110 μg RαBSA complex. b Gating strategy of EMRMs and BMRMs by hCD59 expression. c Flow cytometry analysis of BSA-RαBSA (Alexa647-IC) uptake by hCD59+ EMRMs and hCD59- BMRMs 2 h after injection (left: representative histogram. right: mean fluorescent intensity [MFI]). Data are pooled from three independent experiments. (n = 10 mice per group). d MFI of BSA-RαBSA (Alexa-647-IC) in Tdt+ EMRMs and Tdt- BMRMs 2 h after injection. Data are pooled from two independent experiments (n = 7 mice per group). e MFI of Fcγreceptors expression on hCD59+ EMRMs and hCD59- BMRMs (n = 4 mice per group). f MFI of CX3CR1, CCR2, F4/80 and CD11c on hCD59+ EMRMs and hCD59− BMRMs (n = 10 mice for F4/80; n = 9 mice for CX3CR1 and CD11c; n = 7 mice for CCR2). All data are presented as mean ± s.e.m. p-values by two-tailed unpaired t-test are indicated in c, d, e, f, n.s. indicates p > 0.05. Source data are provided as a Source Data file.
Fig. 7
Fig. 7. EMRMs have higher immune capacity than BMRMs.
EMRMs are more sensitive to immune challenges than BMRMs in vivo (ae) and in vitro (f, g). a Representative histogram (upper panel) and MFI (lower panel) of CD86 expression on hCD59+ EMRMs and hCD59− BMRMs 2 h after PBS (Vehicle) or BSA-RαBSA injection. (n = 7 mice per group). b The percentage of TNF positive staining in EMRMs and BMRMs 2 h after PBS (Vehicle) or BSA-RαBSA injection. Left panel is representative dot plots. Right panel is the percentage of TNF+ cells (n = 4 mice for vehicle group; n = 6 mice for BSA-RαBSA group). c MFI of CD86 expression and d TNF staining in EMRMs and BMRMs 2 h and 24 h after αGBM serum injection in sheep IgG-preimmunized female mice. Data are pooled from two independent experiments (n = 4 mice per time point per group). e TNF staining in EMRMs and BMRMs 3 h after PBS or 5 µg/g b.w. LPS injection in male mice. Data are pooled from two independent experiments. (n = 4 mice for PBS group; n = 5 for LPS group). f TNF and g IL-6 level in the supernatant of sorted EMRMs and BMRMs treated with medium (NC), 100 ng/ml LPS, 5 µg/ml LTA, or 5 µg/ml Poly (I:C) for 18 h. Data are pooled from three independent experiments, each dot represents cells obtained from individual sorting pooled from two mice. (n = 5 for NC; n = 6 for LPS; n = 3 for LTA and Poly (I:C)). All data are presented as mean ± s.e.m. p-values by two-tailed unpaired t-test are indicated in ag. Source data are provided as a Source Data file.
Fig. 8
Fig. 8. EMRMs have a greater glycolytic capacity than BMRMs.
a, b Real-time changes and quantifications of the ECAR (a) and OCR (b) in EMRMs and BMRMs at baseline or stressed with oligomycin/FCCP. Data are representative of three independent experiments (n = 3 per group). c Real-time changes and quantification of the ECAR in EMRMs and BMRMs sorted from Immune complex (IC)-treated mice at baseline or stressed with oligomycin/FCCP. Data are pooled from two independent experiments. (n = 5 for IC-EMRMs; n = 6 for IC-BMRMs). d Ex vivo glucose uptake in EMRMs and BMRMs sorted from PBS (Vehicle) or IC-treated mice. RMs were sorted and treated with 2-DG for 30 min, followed by measuring the level of its product 2DG6P by luminescence reader. Data are pooled from two independent experiments. (Vehicle: n = 7 for EMRMs and BMRMs; IC: n = 6 for EMRMs and n = 8 for BMRMs). e TNF production in LPS-stimulated EMRMs and BMRMs as in Fig. 7f together with or without glucose analog 2-DG. Data are pooled from two independent experiments and each dot represents cells obtained from individual sorting. (2-DG - group: n = 4 for EMRMs and n = 6 for BMRMs; 2-DG-1:1 group: n = 6 for EMRMs and n = 4 for BMRMs; 2-DG-2:1 group: n = 2 for EMRMs and BMRMs). All data are presented as mean ± s.e.m. p-values by two-way ANOVA analysis are indicated in the left panel of ac and by two-tailed unpaired t-test in the right panel of ac and d, e. Source data are provided as a Source Data file.

References

    1. Munro DAD, Hughes J. The origins and functions of tissue-resident macrophages in kidney development. Front. Physiol. 2017;8:837. doi: 10.3389/fphys.2017.00837. - DOI - PMC - PubMed
    1. Viehmann SF, Bohner AMC, Kurts C, Brahler S. The multifaceted role of the renal mononuclear phagocyte system. Cell. Immunol. 2018;330:97–104. doi: 10.1016/j.cellimm.2018.04.009. - DOI - PubMed
    1. Stamatiades EG, et al. Immune monitoring of trans-endothelial transport by kidney-resident macrophages. Cell. 2016;166:991–1003. doi: 10.1016/j.cell.2016.06.058. - DOI - PMC - PubMed
    1. Ginhoux F, Guilliams M. Tissue-resident macrophage ontogeny and homeostasis. Immunity. 2016;44:439–449. doi: 10.1016/j.immuni.2016.02.024. - DOI - PubMed
    1. Guilliams M, Scott CL. Does niche competition determine the origin of tissue-resident macrophages? Nat. Rev. Immunol. 2017;17:451–460. doi: 10.1038/nri.2017.42. - DOI - PubMed

Publication types