. 2020 May 8;11(1):2293.
doi: 10.1038/s41467-020-16210-y.

Spider venom-derived peptide induces hyperalgesia in Nav1.7 knockout mice by activating Nav1.9 channels

Affiliations

Spider venom-derived peptide induces hyperalgesia in Nav1.7 knockout mice by activating Nav1.9 channels

Xi Zhou et al. Nat Commun. .

Abstract

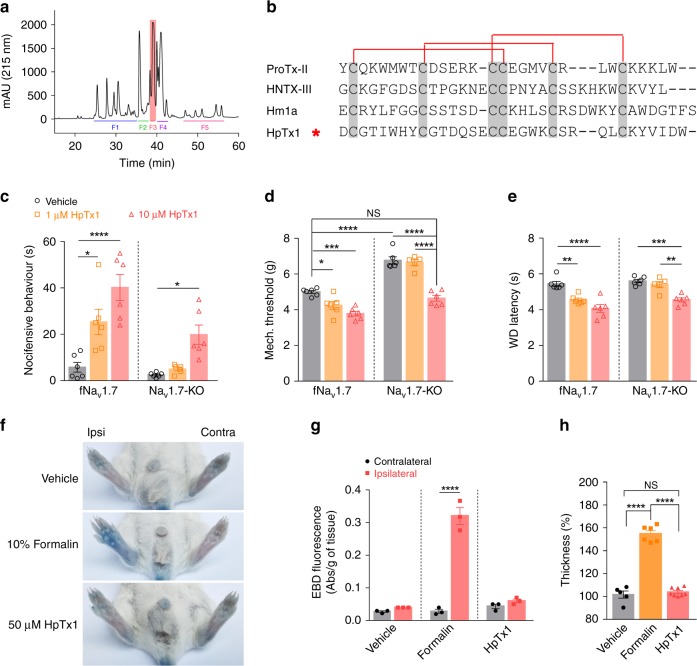
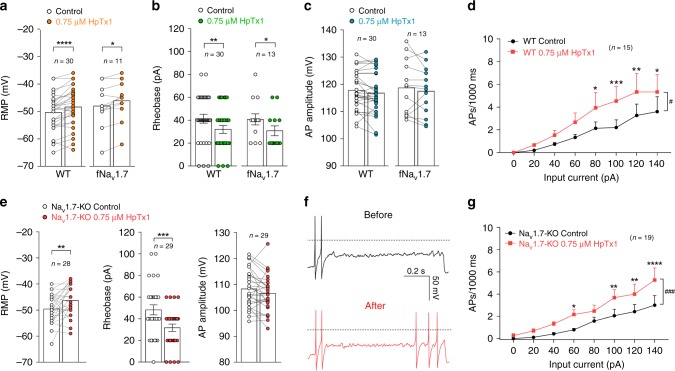
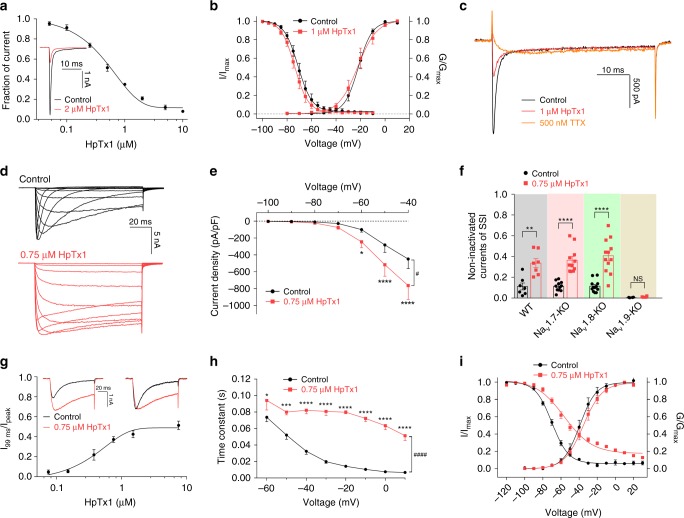
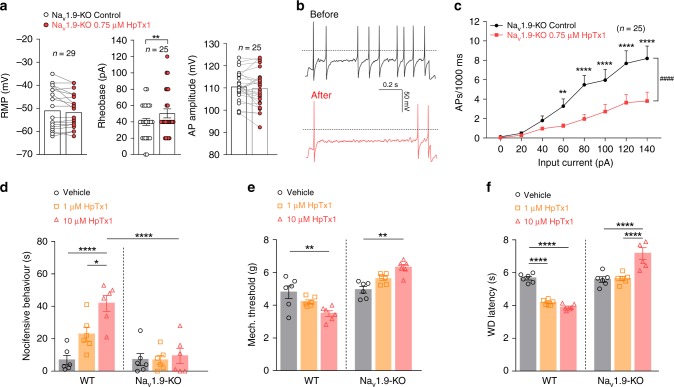
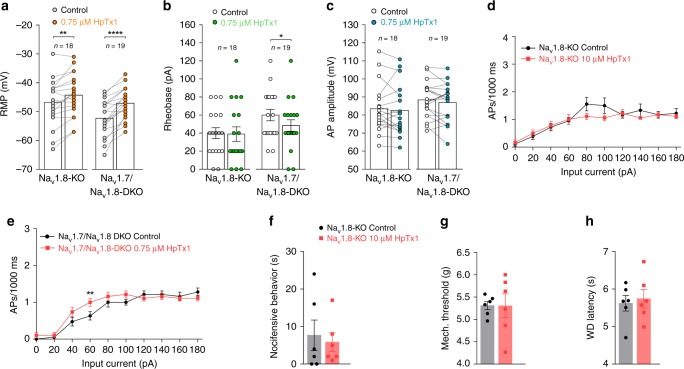
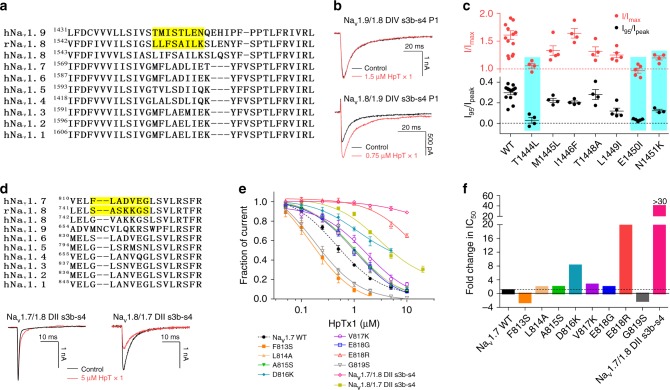
The sodium channels Nav1.7, Nav1.8 and Nav1.9 are critical for pain perception in peripheral nociceptors. Loss of function of Nav1.7 leads to congenital insensitivity to pain in humans. Here we show that the spider peptide toxin called HpTx1, first identified as an inhibitor of Kv4.2, restores nociception in Nav1.7 knockout (Nav1.7-KO) mice by enhancing the excitability of dorsal root ganglion neurons. HpTx1 inhibits Nav1.7 and activates Nav1.9 but does not affect Nav1.8. This toxin produces pain in wild-type (WT) and Nav1.7-KO mice, and attenuates nociception in Nav1.9-KO mice, but has no effect in Nav1.8-KO mice. These data indicate that HpTx1-induced hypersensitivity is mediated by Nav1.9 activation and offers pharmacological insight into the relationship of the three Nav channels in pain signalling.


Conflict of interest statement

The authors declare no competing interests.

Figures

Fig. 1
Fig. 1. HpTx1 rescues the pain response in Nav1.7-KO mice.
a RP-HPLC profile of the venom from the spider H. venatoria. The F3 fraction contains HpTx1 (pink). b Sequence alignment of HpTx1 with several ICK toxins; red lines show the disulfide linkage. c Comparison of nocifensive behaviors (licking or biting) following intraplantar injection of vehicle (10 μl 0.9% saline, n = 6) versus HpTx1 (1 μM or 10 μM in 10 μl saline, n = 6) (two-way ANOVA followed by Tukey’s multiple comparisons test, treatment × genotype: F(2,30) = 3.447, P = 0.0449; treatment: F(2,30) = 24.05, P < 0.0001; genotype: F(1,30) = 23.09, P < 0.0001). d Mechanical response thresholds measured in paws in response to vehicle (black circles, n = 6), 1 μM HpTx1 (yellow squares, n = 6 for fNav1.7 mice; n = 5 for Nav1.7-KO mice) or 10 μM HpTx1 (red triangles, n = 6) injections (two-way ANOVA followed by Tukey’s multiple comparisons test, treatment × genotype: F(2,29) = 10.52, P = 0.0004; treatment: F(2,29)  = 54.72, P < 0.0001; genotype: F(1,29) = 150.2, P < 0.0001). e Latency of paw withdrawal (WD) to a noxious thermal stimulus measured after intraplantar injection of vehicle (black circles, n = 6), 1 μM HpTx1 (yellow squares, n = 6 for fNav1.7 mice; n = 5 for Nav1.7-KO mice) or 10 μM HpTx1 (red triangles, n = 6) (two-way ANOVA followed by Tukey’s multiple comparisons test, treatment ×  genotype: F(2,29) = 2.857, P = 0.0737; treatment: F(2,29) = 36.83, P < 0.0001; genotype: F(1,29) = 17.71, P = 0.0002). f Images of hind paws with Evans blue staining. Ipsi ipsilateral paws, Contra contralateral paws. g Quantification of Evans blue staining in ipsilateral and contralateral hind paws (n = 3, two-way ANOVA followed by Tukey’s multiple comparisons test, treatment × paw: F(2,12) = 96.1, P < 0.0001; treatment: F(2,12) = 87.79, P < 0.0001; paw: F(1,12) = 128.9, P < 0.0001). h Relative thickness of injected hind paws normalized to that of uninjected ones (n = 5 for vehicle, n = 6 for formalin, n = 8 for HpTx1, one-way ANOVA followed by Tukey’s multiple comparisons test: F(2,16) = 160.9, P < 0.0001). Data are represent the mean ± S.E.M. *P < 0.05, **P < 0.01, ***P < 0.001, ****P < 0.0001. Exact P (ce, g, h) are presented in Supplementary Data 1. Source data are provided as a Source Data file. Source Data file.
Fig. 2
Fig. 2. HpTx1 activates some small DRG neurons in WT and Nav1.7-KO mice.
ad Current-clamp recording shows that HpTx1 enhances the excitability of small (<30 μm) DRG neurons from WT and fNav1.7 mice. Bars show significant changes for RMP (a, two-way repeated measures ANOVA followed by Bonferroni’s multiple comparisons test, treatment × genotype: F(1,39) = 0.02197, P = 0.8829; treatment: F(1,39) = 22.12, P < 0.0001; genotype: F(1,39) = 0.9114, P = 0.3456) and rheobase (b, two-way repeated measures ANOVA followed by Bonferroni’s multiple comparisons test, treatment × genotype: F(1,41) = 0.01839, P = 0.8928; treatment: F(1,41) = 15.47, P = 0.0003; genotype: F(1,41) = 0.02329, P = 0.8795), but no effect on AP amplitude (c) in the presence of 0.75 μM HpTx1. d Statistics plots show significant increases in AP spike number in the presence of 0.75 μM HpTx1 (n = 15, two-way repeated measures ANOVA followed by Bonferroni’s multiple comparisons test, treatment × inject current: F(7,98) = 2.228, P = 0.0382; treatment: F(1,14) = 7.716, #P = 0.0148; inject current: F(7,98) = 8.916, P < 0.0001). eg Current-clamp recordings show that HpTx1 increases the excitability of small DRG neurons from Nav1.7-KO mice. e Bars show significant changes for RMP (left, n = 28, parametric paired two-tailed t test: t27 = 3.0, P = 0.006) and rheobase (middle, n = 29, nonparametric Wilcoxon matched-pairs signed-rank test: P = 0.0003), but no effect for AP amplitude (right, n = 29, parametric paired two-tailed t test: t28 = 1.7, P = 0.093) in the presence of 0.75 μM HpTx1. f AP traces recorded from a representative Nav1.7-KO mouse DRG neuron before (black) and after (red) the application of HpTx1. The dashed lines indicate 0 mV. g Statistics plots show significant increases in AP spike number in the presence of 0.75 μM HpTx1 (n = 19, two-way repeated measures ANOVA followed by Bonferroni’s multiple comparisons test, treatment × inject current: F(7,126) = 2.313, P = 0.0298; treatment: F(1,18) = 17.69, ###P = 0.0005; inject current: F(7,126) = 14.2, P < 0.0001). All DRG neurons recorded were held at −53 ± 2 mV. Error bars represent the mean ± S.E.M. *P < 0.05, **P < 0.01, ***P < 0.001, ****P < 0.0001. Exact P (a, b, d, g) are presented in Supplementary Data 1. Source data are provided as a Source Data file. Source Data file.
Fig. 3
Fig. 3. HpTx1 inhibits Nav1.7 currents and enhances Nav1.9 activity.
a The dose-dependent inhibition of hNav1.7 currents by HpTx1 (n = 7). The inset shows representative current traces in the presence (red) or absence (black) of 2 μM HpTx1. b Voltage-dependent steady-state activation (G/Gmax, n = 4) and fast inactivation (I/Imax, n = 7) of hNav1.7 are not altered by 1 μM HpTx1. c Representative currents show the effect of 1 μM HpTx1 on TTX-S Navs in mouse small DRG neurons. d, e HpTx1 increases TTX-R Nav currents in mouse small DRG neurons and inhibits their fast inactivation, as shown by representative current traces (d) and current density (e, n = 6, two-way repeated measures ANOVA followed by Bonferroni’s multiple comparisons test, treatment × voltage: F(6,30) = 9.099, P < 0.0001; treatment: F(1,5) = 15.41, #P = 0.0111; voltage: F(6,30) = 16.25, P < 0.0001). f Bars show noninactivated components observed in the steady-state inactivation (SSI) curve (at −20 mV) of multiple mouse TTX-R channels in the presence of 0.75 μM HpTx1 (unpaired two-tailed t test, WT mice: t12 = 4.09, P = 0.0015, n = 7; Nav1.7-KO mice: t20 = 6.447, P < 0.00001, n = 11; Nav1.8-KO mice: t22 = 5.905, P < 0.00001, n = 12; Nav1.9-KO mice: t6 = 1.999, P = 0.0925, n = 4). Note that 1 μM TTX was applied in these experiments (df). g The dose–response curves for the HpTx1-induced inhibition of the fast inactivation of hNav1.9 expressed in ND7/23 cells (n = 5). The inset shows representative current traces (left) and normalized current traces (right) in the absence (black) and presence of 0.75 μM HpTx1 (red). h HpTx1 significantly slows the fast inactivation time of hNav1.9 (n = 6 for control, n = 5 for HpTx1, two-way ANOVA followed by Bonferroni’s multiple comparisons test, treatment × voltage: F(7,66) = 6.386, P < 0.0001; treatment: F(7,66) = 27.35, ####P < 0.0001; voltage: F(1,66) = 411.9, P < 0.0001). i Voltage dependence of the steady-state activation (G/Gmax) and inactivation (I/Imax) of hNav1.9 for the control (black dots, n = 5 for activation, n = 6 for inactivation) and with 0.75 μM HpTx1 application (red diamonds, n = 5 for activation, n = 9 for inactivation). Data are presented as the mean ± S.E.M. *P < 0.05, **P < 0.01, ***P < 0.001, ****P < 0.0001, NS not significant. Exact P (e, h-i) are presented in Supplementary Data 1. Source data are provided as a Source Data file. Source Data file.
Fig. 4
Fig. 4. HpTx1-evoked pain hypersensitivity relies on Nav1.9 activity.
ac Current-clamp recordings show that HpTx1 decreases the membrane excitability of small DRG neurons from Nav1.9-KO mice. a Bars show no significant changes in RMP (left, n = 29) or AP amplitude (right, n = 25), but a significant increase in rheobase (middle, n = 25, nonparametric Wilcoxon matched-pair signed-rank two-tailed test: P = 0.008) in the presence of 0.75 μM HpTx1. b AP traces recorded from a representative small Nav1.9-KO DRG neuron before (black) and after (red) application of 0.75 μM HpTx1. The dashed lines indicate 0 mV. c Statistics plots show significant decreases in AP spike number in the presence of 0.75 μM HpTx1 (n = 25, two-way repeated measures ANOVA followed by Bonferroni’s multiple comparisons test, treatment × inject current: F(7,168) = 8.834, P < 0.0001; treatment: F(1,24) = 25.49, ####P < 0.0001; inject current: F(7,168) = 25.28, P < 0.0001). d Comparison of nocifensive behaviors (licking or biting) following intraplantar injection of vehicle (10 μl 0.9% saline, n = 6) versus HpTx1 (1 μM or 10 μM in 10 μl saline, n = 6) (two-way ANOVA followed by Tukey’s multiple comparisons test, treatment × genotype: F(2,30) = 8.551, P = 0.0012; treatment: F(2,30) = 11.04, P = 0.0003; genotype: F(1,30) = 24.37, P < 0.0001). e Mechanical response thresholds measured in paws in response to vehicle (black circles, n = 6), 1 μM HpTx1 (yellow squares, n = 6) or 10 μM HpTx1 (red triangles, n = 6) injections (two-way ANOVA followed by Tukey’s multiple comparisons test, treatment × genotype: F(2,30) = 18.68, P < 0.0001; treatment: F(2,30) = 0.0356, P = 0.9651; genotype: F(1,30) = 67.3, P < 0.0001). f Latency of WD to noxious heat stimuli measured after intraplantar injection of vehicle (black circles, n = 6), 1 μM HpTx1 (yellow squares, n = 6) or 10 μM HpTx1 (red triangles, n = 6) (two-way ANOVA followed by Tukey’s multiple comparisons test, treatment × genotype: F(2,30) = 44.54, P < 0.0001; treatment: F(2,30) = 9.701, P = 0.0006; genotype: F(1,30) = 113.5, P < 0.0001). All DRG neurons recorded were held at −53 ± 2 mV. Data are presented as the mean ± S.E.M. *P < 0.05, **P < 0.01, ***P < 0.001, ****P < 0.0001. Exact P (cf) are presented in Supplementary Data 1. Source data are provided as a Source Data file. Source Data file.
Fig. 5
Fig. 5. HpTx1 has no effect on pain responses in Nav1.8-KO mice.
ae Current-clamp recordings show the effects of HpTx1 on the excitability of small DRG neurons from Nav1.8-KO mice and Nav1.7/Nav1.8-DKO mice. a RMP (two-way repeated measures ANOVA followed by Bonferroni’s multiple comparisons test, treatment × genotype: F(1,35) = 5.792, P = 0.0215; treatment: F(1,35) = 52.44, P < 0.0001; genotype: F(1,35) = 3.389, P = 0.0741), b rheobase (two-way repeated measures ANOVA followed by Bonferroni’s multiple comparisons test, treatment × genotype: F(1,35) = 3.465, P = 0.0711; treatment: F(1,35) = 5.092, P = 0.0304; genotype: F(1,35) = 2.656, P = 0.1121), and c AP amplitude (Nav1.8-KO mice, n = 18; Nav1.7/Nav1.8-DKO mice, n = 19). d, e HpTx1 has no effect on the AP firing frequency of small DRG neurons from Nav1.8-KO mice (d, n = 18) or Nav1.7/Nav1.8-DKO mice (e, n = 19, two-way repeated measures ANOVA followed by Bonferroni’s multiple comparisons test, treatment × inject current: F(7,126) = 3.141, P = 0.0043; treatment: F(1,18) = 4.275, P = 0.0534; inject current: F(7,126) = 79.17, P < 0.0001). fh 10 μM HpTx1 (red diamonds) has no effect on nocifensive behaviors (f, n = 6) or mechanical (g, n = 6) or thermal pain (h, n = 6). All DRG neurons recorded were held at −53 ± 2 mV. Data are presented as the mean ± S.E.M. *P < 0.05, **P < 0.01, ****P < 0.0001. Exact P (a, b, e) are presented in Supplementary Data 1. Source data are provided as a Source Data file. Source Data file.
Fig. 6
Fig. 6. The molecular mechanism of HpTx1 action on Nav1.9 and Nav1.7 channels.
a Sequence alignments corresponding to the DIV s3b-s4 region of Nav subtypes. The highlighted sequences show the regions swapped between Nav1.8 and Nav1.9. b Representative current traces from Nav1.9/1.8 DIV s3b-s4 P1 (top) and Nav1.8/1.9 DIV s3b-s4 P1 (bottom) chimaera channels in the absence (black) and presence (red) of HpTx1. c Effects of HpTx1 on WT and mutant hNav1.9 channels. Dot plots display the effect of 0.75 μM HpTx1 on the peak current (top, n = 14 for WT; n = 4 for T1444L, M1445L, I1446F, and T1448A; n = 5 for L1449I and E1450L; n = 3 for N1451K) and the persistent current (bottom, n = 14 for WT; n = 4 for T1444L, I1446F, T1448A, and N1451K; n = 5 for M1445L, L1449I, and E1450L). Key residues involved in the interaction between HpTx1 and hNav1.9 are labeled (one-way ANOVA with Dunnett’s multiple comparison test, I95/Ipeak: F(7,35) = 17.72, P < 0.0001; I/Imax: F(7,38) = 8.157, P < 0.0001). d (top) Sequence alignments corresponding to the DII s3b-s4 region of Nav subtypes. The highlighted sequences show the regions swapped between Nav1.7 and Nav1.8. Representative current traces from Nav1.7/1.8 DII s3b-s4 (bottom left) and Nav1.8/1.7 DII s3b-s4 (bottom right) chimaera channels in the absence (black) or presence of 5 μM HpTx1 (red). e Dose-dependent inhibitory curves show the effect of HpTx1 on WT (n = 7) and mutant hNav1.7 channels (n = 4 for F813S, n = 6 for L814A and A815S, n = 3 for D816K, n = 6 for V817K, n = 7 for E818G, n = 4 for E818R, n = 5 for G819S and n = 3 for Nav1.7/1.8 DII s3b-s4) and the Nav1.8/1.7 DII s3b-s4 chimaera channel (n = 5). f Bars show the fold changes in IC50 values of HpTx1 for mutant channels compared with that for the WT hNav1.7 channel. Data are presented as the mean ± S.E.M. Exact P (c) are presented in Supplementary Data 1. Source data are provided as a Source Data file. Source Data file.

References

    1. Treede RD. The international association for the study of pain definition of pain: as valid in 2018 as in 1979, but in need of regularly updated footnotes. Pain Rep. 2018;3:e643. doi: 10.1097/PR9.0000000000000643. - DOI - PMC - PubMed
    1. Cox JJ, et al. An SCN9A channelopathy causes congenital inability to experience pain. Nature. 2006;444:894–898. doi: 10.1038/nature05413. - DOI - PMC - PubMed
    1. Leipold E, et al. A de novo gain-of-function mutation in SCN11A causes loss of pain perception. Nat. Genet. 2013;45:1399–1404. doi: 10.1038/ng.2767. - DOI - PubMed
    1. Chen YC, et al. Transcriptional regulator PRDM12 is essential for human pain perception. Nat. Genet. 2015;47:803–808. doi: 10.1038/ng.3308. - DOI - PMC - PubMed
    1. Nilsen KB, et al. Two novel SCN9A mutations causing insensitivity to pain. Pain. 2009;143:155–158. doi: 10.1016/j.pain.2009.02.016. - DOI - PubMed

Publication types

MeSH terms