. 2020 May 8;11(1):2301.
doi: 10.1038/s41467-020-16022-0.

A phenome-wide association and Mendelian Randomisation study of polygenic risk for depression in UK Biobank

Collaborators, Affiliations

A phenome-wide association and Mendelian Randomisation study of polygenic risk for depression in UK Biobank

Xueyi Shen et al. Nat Commun. .

Abstract

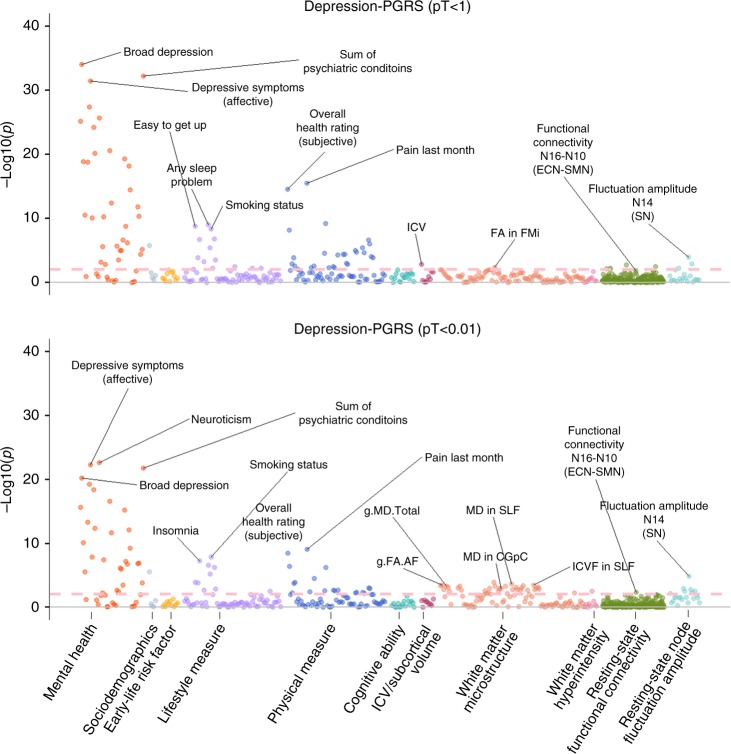
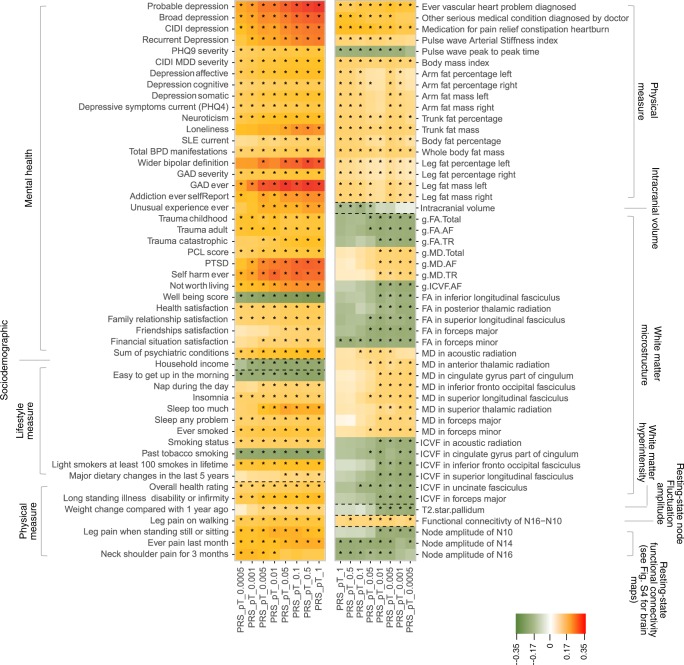
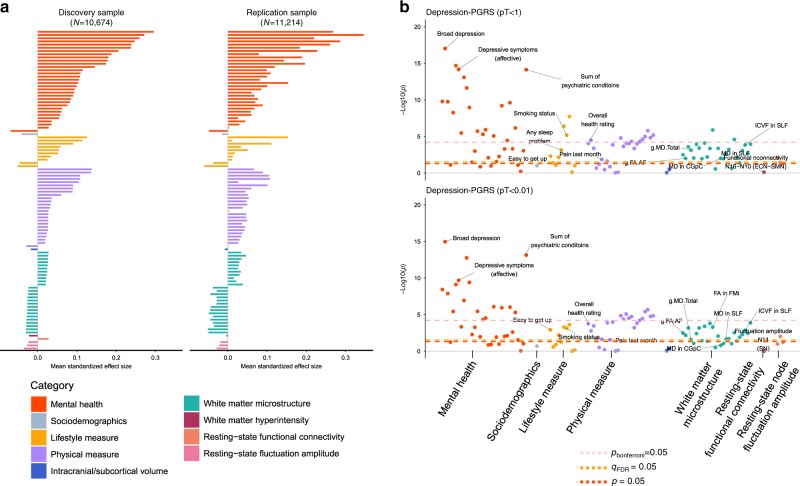
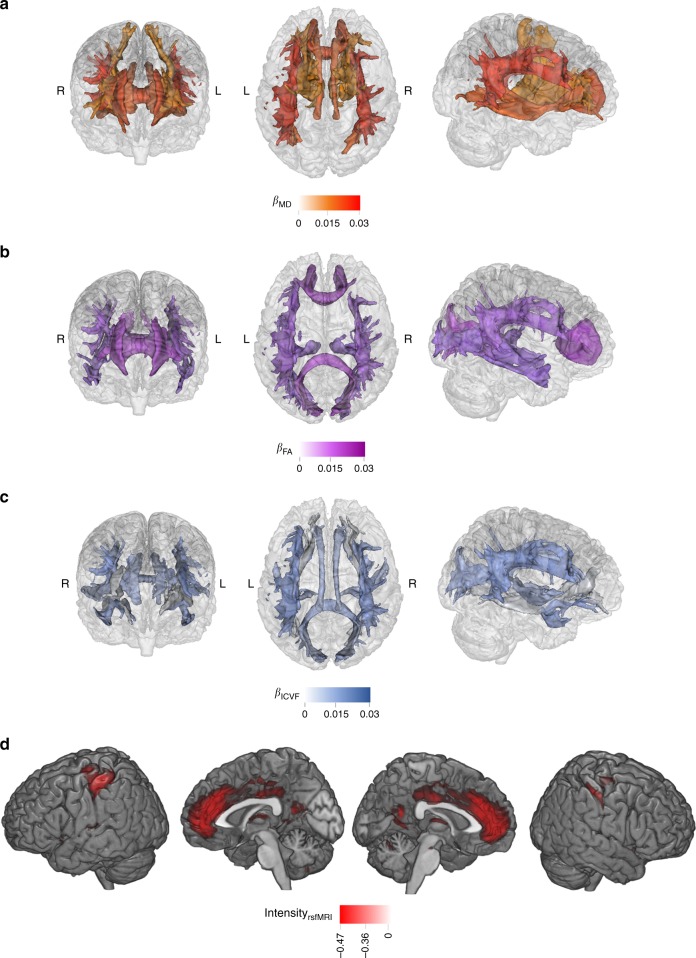
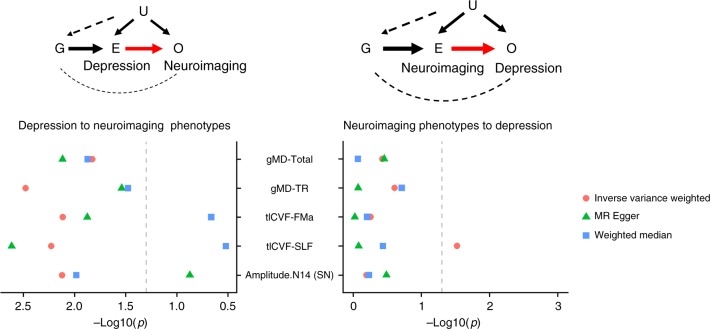
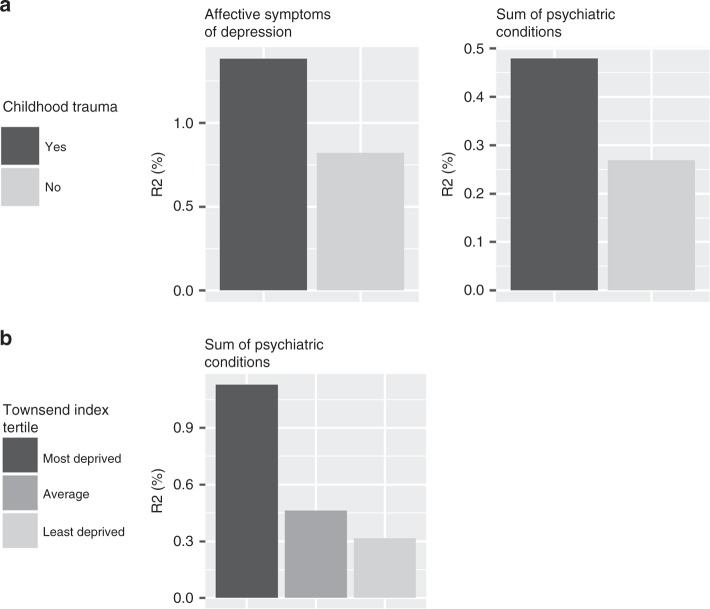
Depression is a leading cause of worldwide disability but there remains considerable uncertainty regarding its neural and behavioural associations. Here, using non-overlapping Psychiatric Genomics Consortium (PGC) datasets as a reference, we estimate polygenic risk scores for depression (depression-PRS) in a discovery (N = 10,674) and replication (N = 11,214) imaging sample from UK Biobank. We report 77 traits that are significantly associated with depression-PRS, in both discovery and replication analyses. Mendelian Randomisation analysis supports a potential causal effect of liability to depression on brain white matter microstructure (β: 0.125 to 0.868, pFDR < 0.043). Several behavioural traits are also associated with depression-PRS (β: 0.014 to 0.180, pFDR: 0.049 to 1.28 × 10⁻¹⁴) and we find a significant and positive interaction between depression-PRS and adverse environmental exposures on mental health outcomes. This study reveals replicable associations between depression-PRS and white matter microstructure. Our results indicate that white matter microstructure differences may be a causal consequence of liability to depression.


Conflict of interest statement

The authors declare no competing interests.

Figures

Fig. 1
Fig. 1. Significance plot for all phenotypes for depression-PRS at p threshold (pT) < 1 and pT < 0.01.
The x axes represent phenotypes, and the y axes represent the −log10 of uncorrected p values of two-sided test for linear regression between depression-PRS and each of the phenotype. Each dot represents one phenotype, and the colours indicate their according categories. The dashed lines indicate the threshold to survive FDR correction. FDR correction was applied over all the traits and all depression-PRS (see “Methods”). From left to right on the x axis, categories were shown by the sequence of mental health measure, sociodemographics, early-life risk factor, lifestyle measure, physical measure, cognitive ability, intracranial/subcortical volume, white matter microstructure, white matter hyperintensity, resting-state functional connectivity and resting-state fluctuation amplitude. Representative top findings are annotated in the figure. SN salience network, ECN executive control network, SMN sensorimotor network, FA fractional anisotropy, MD (for white matter microstructure) mean diffusivity, ICVF intra-cellular volume fraction, AF association fibres, FMi forceps minor, SLF superior longitudinal fasciculus, CGpC cingulate gyrus part of cingulum.
Fig. 2
Fig. 2. Heatmap for the traits that were significantly associated with depression-PRS.
The shown traits were significantly associated with depression-PRS at a minimum of four p thresholds for depression-PRS. Shades of cells indicate the standardised effect sizes (β) for the linear regression between depression-PRS and each phenotype. A larger effect size was shown by a darker colour. Cells with an asterisk were significant after FDR correction. Descriptions for the variables in detail can be found in Table 1, Supplementary Table 1 and Supplementary Data 1.
Fig. 3
Fig. 3. Results for replication analysis.
a Comparisons of effect sizes for the discovery and replication samples. The x axes represent the mean standard effect size across depression-PRS at all eight p thresholds for generating depression-PRS (pT). Colours for the bars indicate their categories (from top to bottom: mental health measure, sociodemographics, lifestyle measure, physical measure, intracranial/subcortical volume, white matter microstructure, white matter hyperintensity, resting-state functional connectivity, and resting-state fluctuation amplitude). b Significance plot for the replication analysis on representative depression-PRS at pT < 1 and pT < 0.01, in accordance with Fig. 1. The x axes represent phenotypes, and the y axes represent the −log10 of uncorrected p values of two-sided test for linear regression between depression-PRS and each of the phenotype. Each dot represents one phenotype, and the colours indicate their according categories. The yellow dashed lines indicate the threshold to survive FDR-correction. FDR-correction was applied over all the traits and all depression-PRS (see “Methods”). The pink and red dashed lines indicate the threshold to survive Bonferroni correction and nominally significant threshold. Top hits shown in the discovery sample (Fig. 1) are annotated in the figure. Explanations for the abbreviations can be found in the legend of Fig. 1.
Fig. 4
Fig. 4. Maps for the significant associations between depression-PRS and brain phenotypes.
ac are the brain maps for the significant associations between depression-PRS and white matter microstructure in fractional anisotropy (FA; a), mean diffusivity (MD; b) and intra-cellular volume fraction (ICVF; c) of major tracts. The shade for each tract represents the standardised effect size (β), with a darker shade showing a greater mean β across all depression-PRS at different p thresholds (pT). From left to right are from anterior, superior and right view. For clarity, among the tracts presented in Fig. 2, the ones that showed consistent associations across at least four depression-PRS pT are presented. d shows the brain maps for regions involved in significant associations between resting-state fluctuation amplitude and depression-PRS. Regions that show consistent associations across at a minimum of four depression-PRS p thresholds are presented. Visualisation of results is achieved by calculating the average intensity of ICA maps, weighted by their mean β across the pT. For clarity, the brain maps shown below have a threshold applied on (intensity over 50% of the highest global intensity).
Fig. 5
Fig. 5. Mendelian Randomisation analysis between neuroimaging phenotypes and depression.
The left panel shows the model and results for Mendelian Randomisation results for the causal effect of depression to neuroimaging phenotypes, and the right panel shows the model and results for effect of neuroimaging phenotypes to depression. For the model illustrations, G = genetic instruments extracted from GWAS summary statistics of the exposure, E = exposure variable, O = outcome variable, U = unmeasured confounders (have no systematic association with G). In the scatter plots, x axes represent −log10-transformed p values for the Mendelian Randomisation results, and the y axes represent the neuroimaging traits tested in the models. Three types of dots represent the three Mendelian Randomisation methods used. Dashed grey lines are the p = 0.05 threshold for nominal significance. MD mean diffusivity, ICVF intra-cellular volume fraction, TR thalamic radiations, SLF superior longitudinal fasciculus, Amplitude.N14 (SN) fluctuation amplitude in Node 14 (i.e. the Salience Network).
Fig. 6
Fig. 6. G-by-E interaction.
The figures present the variance explained by depression-PRS under the exposure of different environmental risk factors. The colour shade of each bar represents one condition of environmental factor, a darker shade represents a risk-conferring condition (i.e. had reported childhood trauma and in the most deprived area). The y axes represent the variance explained (R2 in %) by depression-PRS under the given environmental conditions.

References

    1. Vigo D, Thornicroft G, Atun R. Estimating the true global burden of mental illness. Lancet Psychiatry. 2018;3:171–178. doi: 10.1016/S2215-0366(15)00505-2. - DOI - PubMed
    1. World Health Organization. Depression and Other Common Mental Disorders: Global Health Estimates (World Health Organization, 2017).
    1. Cipriani A, et al. Comparative efficacy and acceptability of 21 antidepressant drugs for the acute treatment of adults with major depressive disorder: a systematic review and network meta-analysis. Lancet. 2018;391:1357–1366. doi: 10.1016/S0140-6736(17)32802-7. - DOI - PMC - PubMed
    1. Sullivan PF, Neale MC, Kendler KS. Genetic epidemiology of major depression: review and meta-analysis. Am. J. Psychiatry. 2000;157:1552–1562. doi: 10.1176/appi.ajp.157.10.1552. - DOI - PubMed
    1. Wray NR, et al. Genome-wide association analyses identify 44 risk variants and refine the genetic architecture of major depression. Nat. Genet. 2018;50:668–681. doi: 10.1038/s41588-018-0090-3. - DOI - PMC - PubMed

Publication types