. 2020 May 8;11(1):2263.
doi: 10.1038/s41467-020-16206-8.

A self-operating broadband spectrometer on a droplet

Affiliations

A self-operating broadband spectrometer on a droplet

P Malara et al. Nat Commun. .

Abstract

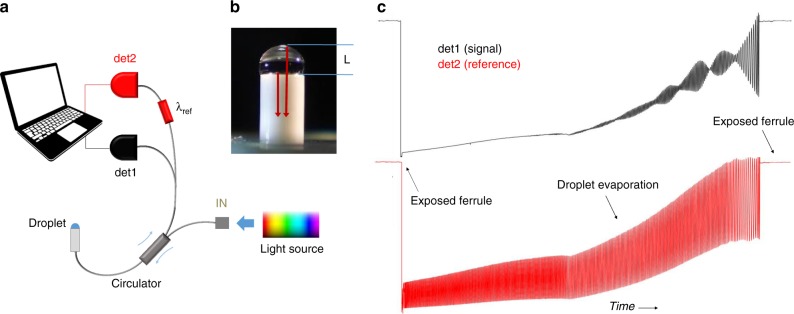
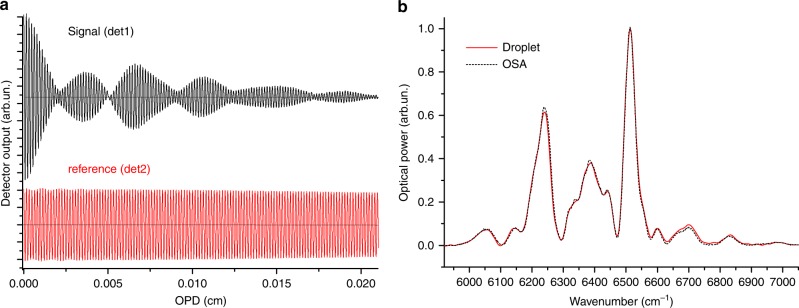
Small-scale Fourier transform spectrometers are rapidly revolutionizing infrared spectro-chemical analysis, enabling on-site and remote sensing applications that were hardly imaginable just few years ago. While most devices reported to date rely on advanced photonic integration technologies, here we demonstrate a miniaturization strategy which harnesses unforced mechanisms, such as the evaporation of a liquid droplet on a partially reflective substrate. Based on this principle, we describe a self-operating optofluidic spectrometer and the analysis method to retrieve consistent spectral information in spite of the intrinsically non-reproducible droplet formation and evaporation dynamics. We experimentally realize the device on the tip of an optical fiber and demonstrate quantitative measurements of gas absorption with a 2.6 nm resolution, in a 100 s acquisition time, over the 250 nm span allowed by our setup's components. A direct comparison with a commercial optical analyzer clearly points out that a simple evaporating droplet can be an efficient small-scale, inexpensive spectrometer, competitive with the most advanced integrated photonic devices.


Conflict of interest statement

The authors declare no competing interests.

Figures

Fig. 1
Fig. 1. Experimental setup.
a Scheme of the fiber-optic droplet spectrometer; b detail of a droplet of thickness L sitting on the fiber connector’s ferrule (water, for better visualization). The radiation reflected at the two droplet boundaries is indicated with red arrows; c signals from detectors det1 and det2 upon deposition and evaporation of an isopropyl alcohol droplet, obtained with a supercontinuum radiation source at the spectrometer input.
Fig. 2
Fig. 2. Spectral analysis of a light source.
a interferograms obtained from the raw signals of Fig. 1c after processing as in Eq. (2). For ease of visualization, the x scale span is limited to 0.02 cm; b red line: spectrum of a supercontinuum source obtained by discrete Fourier transform of the det1 interferogram (zero-filling factor=4, no apodization, no phase-correction, Resolution=11 cm−1); black dashed line: same spectrum recorded with a commercial optical analyzer (8.5 cm−1 resolution, 3-points adjacent averaging).
Fig. 3
Fig. 3. Acetylene absorption.
a transmission spectrum of a spontaneous emission source through an acetylene cell at different pressures (droplet spectrometer, Fourier transform settings as in the spectrum of Fig. 2); b acetylene absorbance curves obtained by off-line normalization of the spectra shown in panel a to the empty-cell transmission; dashed lines: same absorbance curves as measured by a commercial optical spectrum analyzer (8.5 cm−1 resolution, 3-points adjacent averaging); inset: integral absorbance values calculated from the described spectra.

References

    1. Yang Z, et al. Single-nanowire spectrometers. Science. 2019;365:1017–1020. doi: 10.1126/science.aax8814. - DOI - PubMed
    1. Bao J, Bawendi MG. A colloidal quantum dot spectrometer. Nature. 2015;523:67–70. doi: 10.1038/nature14576. - DOI - PubMed
    1. Cheng R, et al. Broadband on-chip single-photon spectrometer. Nat. Commun. 2019;10:1–7. doi: 10.1038/s41467-018-07882-8. - DOI - PMC - PubMed
    1. Faraji-Dana M, et al. Compact folded metasurface spectrometer. Nat. Commun. 2018;9:1–8. doi: 10.1038/s41467-018-06495-5. - DOI - PMC - PubMed
    1. Jiang A-Q, et al. Ultrahigh-resolution spectrometer based on 19 integrated gratings. Sci. Rep. 2019;9:1–7. doi: 10.1038/s41598-018-37186-2. - DOI - PMC - PubMed