. 2020 May 8;11(1):2302.
doi: 10.1038/s41467-020-15788-7.

Mapping global urban land for the 21st century with data-driven simulations and Shared Socioeconomic Pathways

Affiliations

Mapping global urban land for the 21st century with data-driven simulations and Shared Socioeconomic Pathways

Jing Gao et al. Nat Commun. .

Abstract

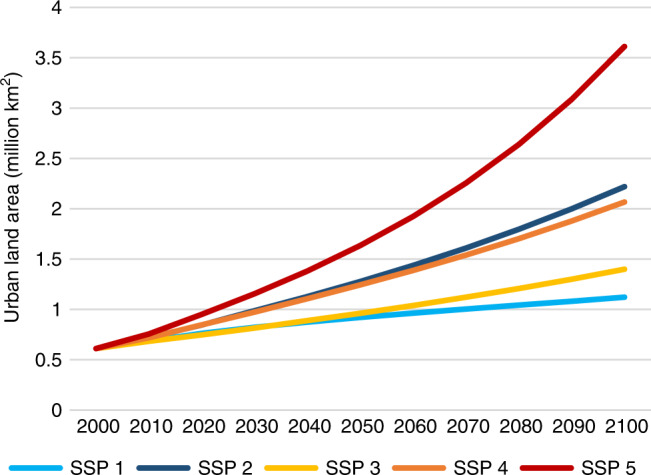
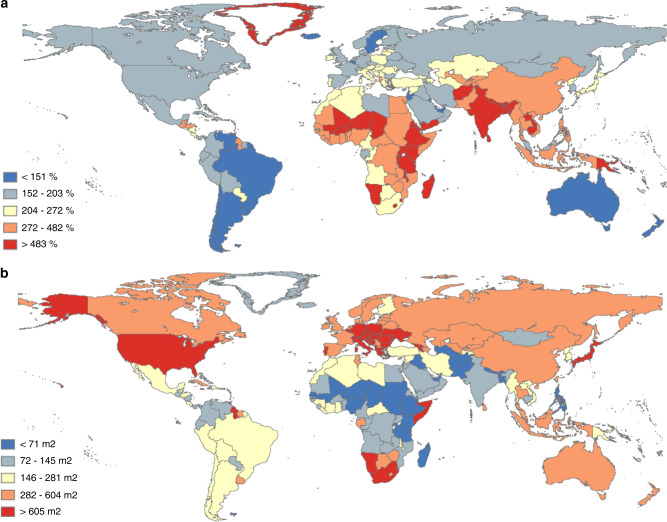
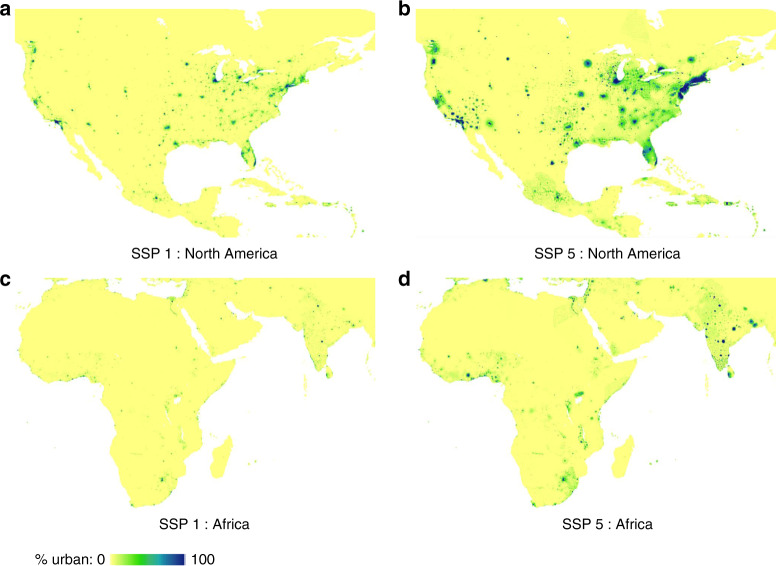
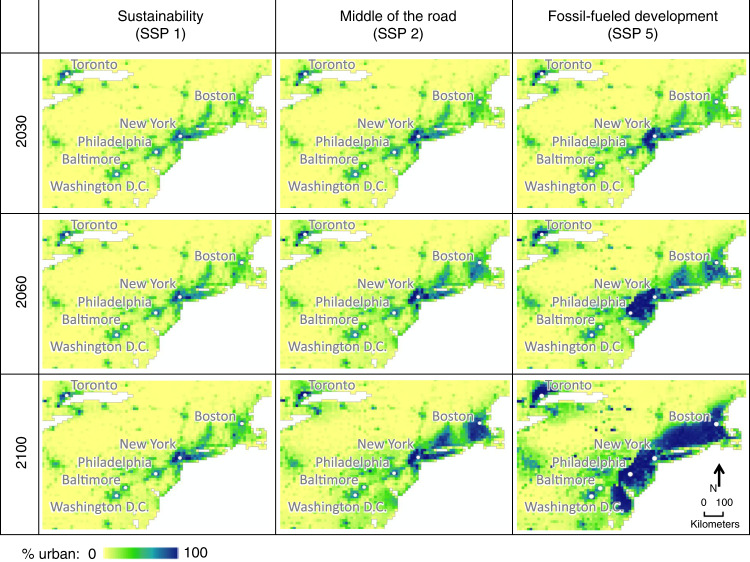
Urban land expansion is one of the most visible, irreversible, and rapid types of land cover/land use change in contemporary human history, and is a key driver for many environmental and societal changes across scales. Yet spatial projections of how much and where it may occur are often limited to short-term futures and small geographic areas. Here we produce a first empirically-grounded set of global, spatial urban land projections over the 21st century. We use a data-science approach exploiting 15 diverse datasets, including a newly available 40-year global time series of fine-spatial-resolution remote sensing observations. We find the global total amount of urban land could increase by a factor of 1.8-5.9, and the per capita amount by a factor of 1.1-4.9, across different socioeconomic scenarios over the century. Though the fastest urban land expansion occurs in Africa and Asia, the developed world experiences a similarly large amount of new development.


Conflict of interest statement

The authors declare no competing interests.

Figures

Fig. 1
Fig. 1. Global total amount of urban land under different scenarios over the 21st century.
The scenarios correspond to the five Shared Socioeconomic Pathways (SSPs 1–5): sustainability, middle of the road, regional rivalry, inequality, and fossil-fueled development.
Fig. 2
Fig. 2. National urban land expansion in the middle of the road scenario.
a Global quintile map of urban land expansion rate (%) 2000–2100. b Global quintile map of per capita urban land area (m2) in 2100 (this variable in 2000 is shown in Supplementary Fig. 1). (Source data are provided as a Source Data file).
Fig. 3
Fig. 3. 2100 spatial urban land maps.
This figure compares the sustainability scenario (SSP 1) and the fossil-fueled development scenario (SSP 5) for the most developed and the fastest developing continents (North America and Africa, respectively). a North America under SSP 1. b North America under SSP 5. c Africa under SSP 1. d Africa under SSP 5.
Fig. 4
Fig. 4. Three styles/maturity stages of urban land expansion.
This scatter plot of decadal observations of all countries concurrently shows data from three different decades (1980–2010). The two axis variables are shown for visual clarity. The actual classification step in the modeling framework uses more variables (more information in “Methods”). (Source data are provided as a Source Data file).
Fig. 5
Fig. 5. Temporal pathways of urban expansion in northeastern United States under different scenarios.
These maps show how different spatial patterns evolve under various scenarios through different pathways. Spatial patterns can differ, even when the overall amount of urban land in the displayed region is similar, e.g., SSP 2 in 2100 and SSP 5 in 2060.
Fig. 6
Fig. 6. Modeling framework.
This framework consists of two new data-driven urban simulation models: The Country-Level Urban Buildup Scenario (CLUBS) model estimates national total amounts of new urban land development under various socioeconomic scenarios. The Spatially-Explicit, Long-term, Empirical City developmenT (SELECT) model allocates the national totals, first to subnational regions, and then to 1/8° grid cells according to their estimated development potentials. Both models evolve over time decade by decade. (Gray ovals—model parts; white squares—input data and intermediate output).
Fig. 7
Fig. 7. Decadal update routine of the Country-Level Urban Buildup Scenario (CLUBS) model.
This flowchart shows how CLUBS estimates the national total amount of new urban land development for one country over one decade. The process repeats for all countries, and iterates over time decade by decade. (Gray ovals—model parts; white squares—input data and intermediate output; orange square—final output).

References

    1. Angel S, Parent J, Civco DL, Blei A, Potere D. The dimensions of global urban expansion: estimates and projections for all countries, 2000–2050. Prog. Plan. 2011;75:53–107. doi: 10.1016/j.progress.2011.04.001. - DOI
    1. Seto KC, Sánchez-Rodríguez R, Fragkias M. The new geography of contemporary urbanization and the environment. Annu. Rev. Environ. Resour. 2010;35:167–194. doi: 10.1146/annurev-environ-100809-125336. - DOI
    1. McDonald RI, et al. Urban growth, climate change, and freshwater availability. Proc. Natl Acad. Sci. USA. 2011;108:6312–6317. doi: 10.1073/pnas.1011615108. - DOI - PMC - PubMed
    1. Zhang W, Villarini G, Vecchi GA, Smith JA. Urbanization exacerbated the rainfall and flooding caused by hurricane Harvey in Houston. Nature. 2018;563:384–388. doi: 10.1038/s41586-018-0676-z. - DOI - PubMed
    1. Grimm NB, et al. Global change and the ecology of cities. Science. 2008;319:756–760. doi: 10.1126/science.1150195. - DOI - PubMed

Publication types