. 2020 May 8;11(1):2303.
doi: 10.1038/s41467-020-16026-w.

Adipocyte Piezo1 mediates obesogenic adipogenesis through the FGF1/FGFR1 signaling pathway in mice

Affiliations

Adipocyte Piezo1 mediates obesogenic adipogenesis through the FGF1/FGFR1 signaling pathway in mice

ShengPeng Wang et al. Nat Commun. .

Erratum in

Abstract

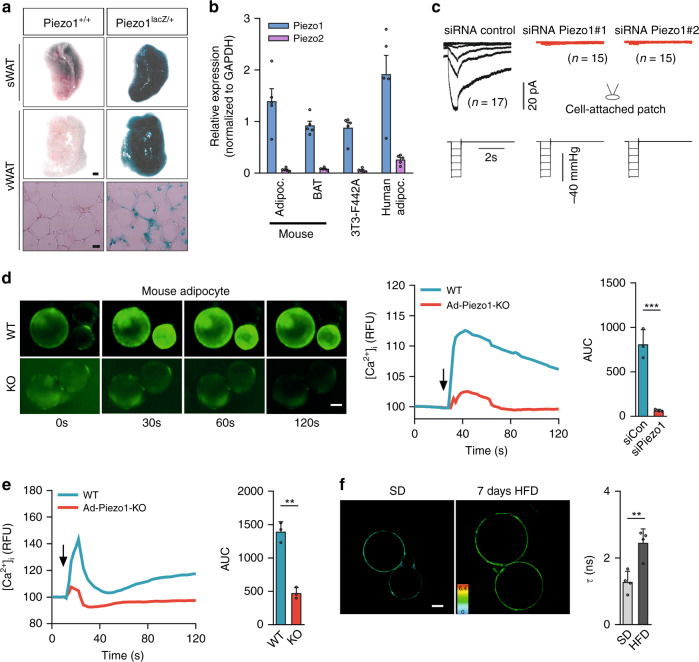
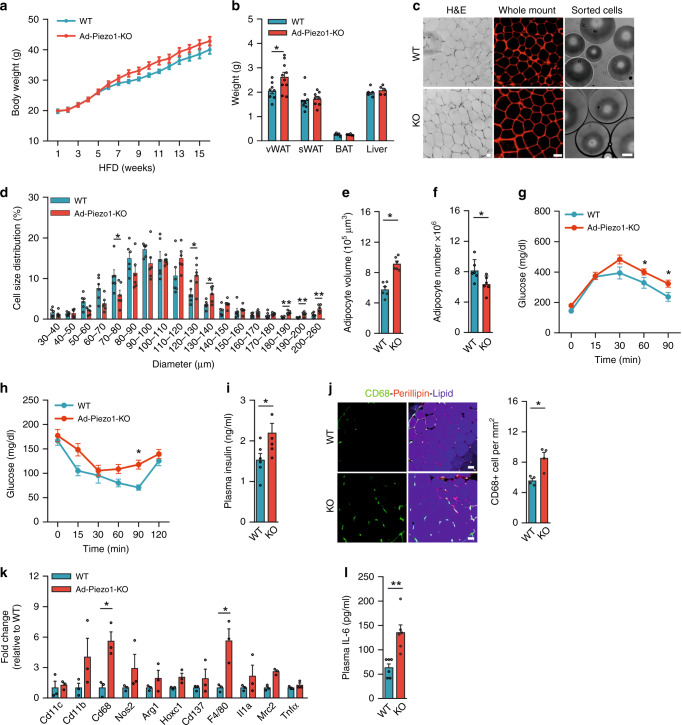
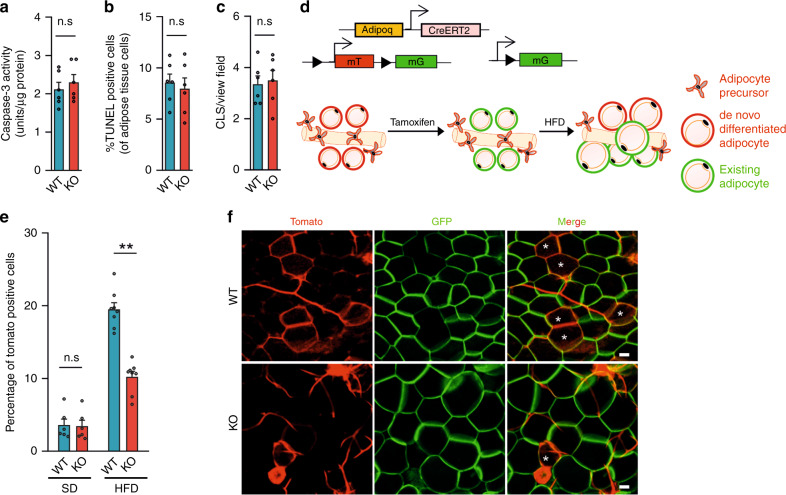
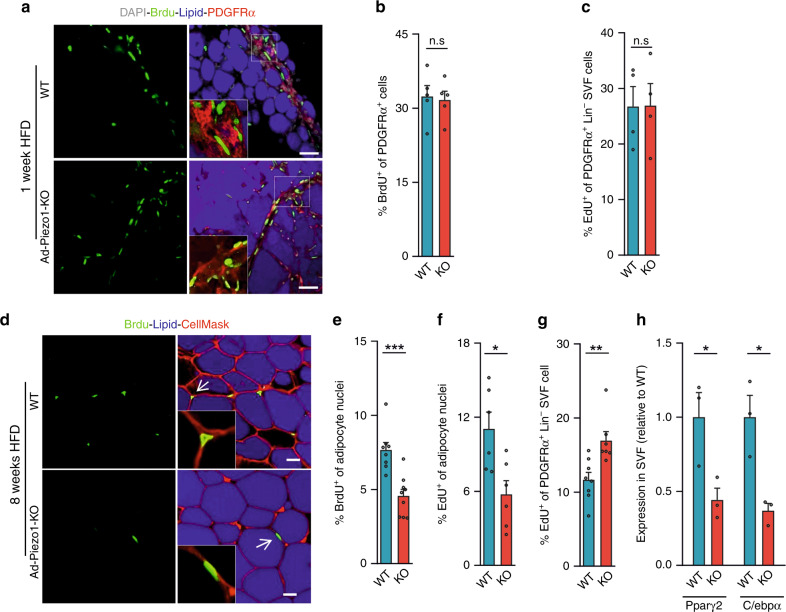
White adipose tissue (WAT) expansion in obesity occurs through enlargement of preexisting adipocytes (hypertrophy) and through formation of new adipocytes (adipogenesis). Adipogenesis results in WAT hyperplasia, smaller adipocytes and a metabolically more favourable form of obesity. How obesogenic WAT hyperplasia is induced remains, however, poorly understood. Here, we show that the mechanosensitive cationic channel Piezo1 mediates diet-induced adipogenesis. Mice lacking Piezo1 in mature adipocytes demonstrated defective differentiation of preadipocyte into mature adipocytes when fed a high fat diet (HFD) resulting in larger adipocytes, increased WAT inflammation and reduced insulin sensitivity. Opening of Piezo1 in mature adipocytes causes the release of the adipogenic fibroblast growth factor 1 (FGF1), which induces adipocyte precursor differentiation through activation of the FGF-receptor-1. These data identify a central feed-back mechanism by which mature adipocytes control adipogenesis during the development of obesity and suggest Piezo1-mediated adipocyte mechano-signalling as a mechanism to modulate obesity and its metabolic consequences.


Conflict of interest statement

The authors declare no competing interests.

Figures

Fig. 1
Fig. 1. Functional expression Piezo1 in adipocytes.
a X-gal staining of inguinal sWAT and epididymal vWAT or of histological sections of vWAT prepared from wild-type mice (Piezo+/+) or from Piezo1lacZ/+ mice, bar lengths: 1 mm (whole mount) and 20 μm (histological section). Shown is a representative of three independent experiments. b Expression of mRNAs encoding Piezo1 or Piezo2 in murine and human vWAT adipocytes, brown adipose tissue (BAT) and in differentiated 3T3-F442A adipocytes (n = 5 samples for each group). (c) Stretch-activated currents from differentiated 3T3-F442A were recorded in the cell-attached patch clamp configuration. The holding potential was −80 mV and the membrane was stretched by pulses of negative pressure with a 10 mm Hg increment applied every 10 ss. Cells were transfected with control siRNAs or with siRNAs against Piezo1. d, e Fluo-4-loaded adipocytes prepared from vWAT of wild-type (WT) or Ad-Piezo1-KO mice were exposed to 10 µM Yoda1 (d) or hypotonic buffer (210 mOsm/kg; e), and [Ca2+]i was determined as fluorescence intensity (RFU, relative fluorescence units); shown are representative images and experiments (n = 3 mice per group (12 and 6 measurements per animal in d, e, respectively)). Arrows indicate the addition of Yoda1 or of hypotonic buffer. Bar diagrams show the area under the curve (AUC) of the Ca2+-transient. f Fluorescence lifetime τ1 images of FliptR in visceral adipocytes from wild-type mice kept under normal show or fed a HFD for 7 days. Corresponding lifetime mean values are shown in the bar diagram. The color bar corresponds to lifetime in nanoseconds (ns). n = 4 mice per group (10 measurements per animal) (f). Bar lengths in d, f: 10 μm. Shown are mean values ± s.e.m.; **P ≤ 0.01; ***P ≤ 0.001 (two-tailed non-parametric Mann–Whitney U-test). Source data are provided as a Source data file.
Fig. 2
Fig. 2. Metabolic phenotype of Ad-Piezo1-KO mice under HFD.
a Body weight of wild-type (WT) or Ad-Piezo1-KO mice during HFD feeding for 16 weeks (n = 11 mice (WT), n = 12 mice (KO)). b Weight of epididymal vWAT, inguinal sWAT, BAT and the liver from wild-type (WT) or Ad-Piezo1-KO mice fed a HFD for 16 weeks (n = 8 mice (vWAT WT and sWAT); n = 5 mice (BAT WT and liver); n = 10 mice (vWAT KO); n = 6 mice (BAT KO)). c H&E-stained vWAT sections, whole-mount vWAT stained with anti-perilipin antibodies and sorted vWAT adipocytes from wild-type (WT) and Ad-Piezo1-KO (KO) mice; bar length: 50 μm. Shown is a representative of 4 independent experiments. d Distribution of size of vWAT adipocytes prepared from wild-type (WT) and Ad-Piezo1-KO mice fed HFD for 16 weeks (n = 6 mice (WT and KO each)). e, f Average volume (e) and total number (f) of adipocytes in epididymal vWAT from wild-type (WT) and Ad-Piezo1-KO (KO) mice (n = 6 mice (WT and KO each)). gi Glucose tolerance (g), insulin tolerance (h) and plasma insulin levels (i) in wild-type (WT) and Ad-Piezo1-KO mice (KO) fed a HFD for 16 weeks (n = 6 mice (WT in g, WT and KO in i, h), n = 7 mice (KO in g)). j Whole mount of vWAT from wild-type (WT) or Ad-Piezo1-KO mice (KO) stained with anti-CD68 and anti-perilipin antibodies as well as with LipidTOX (lipid); bar length: 50 μm. The bar diagram shows the statistical evaluation of CD68-positive cells per area (n = 4 mice (at least 10 sections per mouse)). k, l Expression of inflammation marker genes in vWAT (k) and IL-6 levels in plasma (l) from wild-type (WT) and Ad-Piezo1-KO mice (KO) fed HFD for 16 weeks (n = 3 mice (WT and KO each in k), n = 6 mice (WT and KO each in l)). Shown are mean values ± s.e.m.; *P ≤ 0.05; **P ≤ 0.01; n.s., not significant (two-tailed non-parametric Mann–Whitney U-test). Source data are provided as a Source data file.
Fig. 3
Fig. 3. Analysis of in vivo adipogenesis in Ad-Piezo1-KO mice.
ac Caspase-3 activity (a), TUNEL staining (b) and crown-like structures (CLS; c) in vWAT from wild-type (WT) and Ad-Piezo1-KO mice (KO) fed HFD for 16 weeks (n = 6 mice (at least 10 sections per mouse in b, c)). d Experimental design of analysis of adipogenesis in vivo using Adipoq-CreERT2;mT/mG mice. e, f Statistical analysis (at least 20 sections per mouse; e) and representative images (f) of adipocyte tracing in Adipoq-CreERT2;mT/mG;Piezo1flox/flox (KO) and Adipoq-CreERT2;mT/mG;Piezo1+/+ mice (WT) after tamoxifen treatment and 8 weeks of HFD or SD in vWAT (n = 6 mice (SD), n = 8 mice (HFD)); bar length: 50 μm. Shown are mean values ± s.e.m.; **P ≤ 0.01; n.s., not significant (two-tailed non-parametric Mann–Whitney U-test). Source data are provided as a Source data file.
Fig. 4
Fig. 4. Analysis of adipocyte precursor proliferation and differentiation in Ad-Piezo1-KO mice.
ag Wild-type (WT) and Ad-Piezo1-KO mice (KO) received BrdU (a, b, d, e) or EdU (c, f, g) for 1 week while feeding HFD for 1 week (ac) or 8 weeks (dg) started. Shown are representative images (a, d) and quantifications (b, e) of immunofluorescence staining for BrdU in nuclei of SVF stained with an anti-PDGFRα antibody and LipidTOX (lipid) (a, b) or in adipocyte nuclei of vWAT (d, e). Tissues were stained with LipidTOX (lipid) and CellMask to visualize adipocyte plasma membranes. Insets show magnifications of boxed areas (d) or of typical adipocyte nuclei indicated by arrows (d); bar length: 50 μm (a) and 20 μm (d) (n = 5 mice (at least 12 sections per mouse in b), n = 8 or 9 mice (WT or KO in e; at least 15 sections per mouse)). c, f, g Flow-cytometric analysis of EdU incorporation in PDGFRα-positive, CD31-negative and CD45-negative (Lin;PDGFRα+) cells of the vWAT SVF (c, g) or in adipocyte nuclei (f) of wild-type (WT) and Ad-Piezo1-KO mice (KO) (n = 4 mice (WT and KO in c), n = 6 mice (WT and KO in f), n = 8 mice (WT in g), n = 7 mice (KO in g)). In c, f, g at least 5000 cells were analyzed per animal. h Expression of mRNA encoding Pparγ2 and C/ebpα in the SVF of vWAT prepared from wild-type (WT) and Ad-Piezo-KO mice (KO) fed a HFD for 16 weeks (n = 3 mice (WT and KO in h). Shown are mean values ± s.e.m.; *P ≤ 0.05; **P ≤ 0.01; ***P ≤ 0.001; n.s., not significant (two-tailed non-parametric Mann–Whitney U-test). Source data are provided as a Source data file.
Fig. 5
Fig. 5. Effect of conditioned medium from vWAT adipocytes on preadipocyte proliferation and differentiation.
ac Effects of conditioned medium from vWAT adipocytes prepared from wild-type (WT) and Ad-Piezo1-KO (KO) mice fed a HFD (ac) or SD (b) for 16 weeks or of unconditioned medium (control in b). In a, proliferation of 3T3-F442A cells or of cells of the SVF was visualized by staining for Ki67, and cells were counterstained with DAPI and BODIPY (lipid). Shown are representative images and the statistical evaluation (n = 4 mice (WT and KO, 3T3-F442A), n = 3 mice (WT and KO, SVF); at least 10 fields were analyzed per mouse). Bar length: 50 μm. In b, SVF cells or undifferentiated 3T3-F442A cells were exposed to the medium and stained with Oil-red-O. Shown are representative images and the statistical evaluation of Oil-red-O content (n = 6 mice (for all groups)); bar length: 50 μm. In c, expression of different adipocyte marker genes in 3T3-F442A cells (n = 4 mice (for all groups)) was determined. Shown are mean values ± s.e.m.; *P ≤ 0.05; **P ≤ 0.01; ***P ≤ 0.001; n.s., not significant (compared to control in b) (two-tailed non-parametric Mann–Whitney U-test). Source data are provided as a Source data file.
Fig. 6
Fig. 6. FGF1 mediates Piezo1-dependent regulation of adipocyte differentiation.
a Yoda1 (10 μM) effect on release of protein mediators (red) and lipids (black) from mouse adipocytes (ratio of release in the presence and absence of Yoda-1 (n = 5 mice)). b, c Effect of Yoda1 (10 µM) or hypotonic buffer (hypo; 210 mOsm/kg) on FGF1 release from vWAT adipocytes from wild-type (WT) and Ad-Piezo1-KO mice (KO) (b) or from human vWAT (c) (n = 3 mice (b), n = 4 samples (c)). d, e Effect of Yoda1 (10 μM; d) or hypotonic buffer (hypo; 210 mOsm/kg; e) on FGF1 release from mouse adipocytes pretreated in the absence or presence of brefeldin A (bref. A) or BAPTA-AM (n = 3 mice (control and bref. A in d as well as control and control + bref. A in e); n = 5 (control + hypo in e); n = 4 mice (BAPTA in d and all other groups)). f PD173074 (PD; 10 μM) effect on 3T3-F442A cell differentiation induced by conditioned medium of vWAT adipocytes from wild-type mice fed HFD for 16 weeks and effect of FGF1 (10 ng/ml) and FGF1 + PD173074 on differentiation of 3T3-F442A cells exposed to conditioned medium from vWAT adipocytes from KO animals. Control: non-conditioned medium. Cells were stained with Oil-red-O. g Differentiation of SVF cells from wild-type or Pdgfrα-CreERT2;Fgfr1flox/flox (Pα-Fgfr1-KO) mice exposed to conditioned medium from wild-type adipocytes from HFD-fed mice (Oil-red-O staining; n = 4 mice per condition). h H&E-stained vWAT sections from wild-type (WT) and Pα-Fgfr1-KO mice fed a HFD for 12 weeks (one representative of three independent experiments). i, j Average diameter (i) and total number (j) of adipocytes in vWAT from wild-type (WT) and Pα-Fgfr1-KO mice fed a HFD (n = 5 mice each). k Wild-type (WT) and Pα-Fgfr1-KO mice received BrdU during the first week of an 8-week HFD feeding period. Representative images and quantifications of immunofluorescence staining for BrdU in adipocyte nuclei of vWAT after HFD feeding (n = 5 mice (≥15 sections per mouse)). Bar lengths in f, g, h, k: 50 μm. Shown are mean values ± s.e.m.; *P ≤ 0.05; **P ≤ 0.01; ***P ≤ 0.001; n.s., not significant (two-tailed non-parametric Mann–Whitney U-test). Source data are provided as a Source data file.

References

    1. Heymsfield SB, Wadden TA. Mechanisms, pathophysiology, and management of obesity. N. Engl. J. Med. 2017;376:254–266. - PubMed
    1. Czech MP. Insulin action and resistance in obesity and type 2 diabetes. Nat. Med. 2017;23:804–814. - PMC - PubMed
    1. Bluher, M. Obesity: global epidemiology and pathogenesis. Nat. Rev. Endocrinol. 15, 288–298 (2019). - PubMed
    1. Gonzalez-Muniesa P, et al. Obesity. Nat. Rev. Dis. Prim. 2017;3:17034. - PubMed
    1. Berry R, Jeffery E, Rodeheffer MS. Weighing in on adipocyte precursors. Cell Metab. 2014;19:8–20. - PMC - PubMed

Publication types

MeSH terms

LinkOut - more resources