. 2020 May 8;11(1):2285.
doi: 10.1038/s41467-020-16164-1.

Single-cell RNA sequencing demonstrates the molecular and cellular reprogramming of metastatic lung adenocarcinoma

Affiliations

Single-cell RNA sequencing demonstrates the molecular and cellular reprogramming of metastatic lung adenocarcinoma

Nayoung Kim et al. Nat Commun. .

Abstract

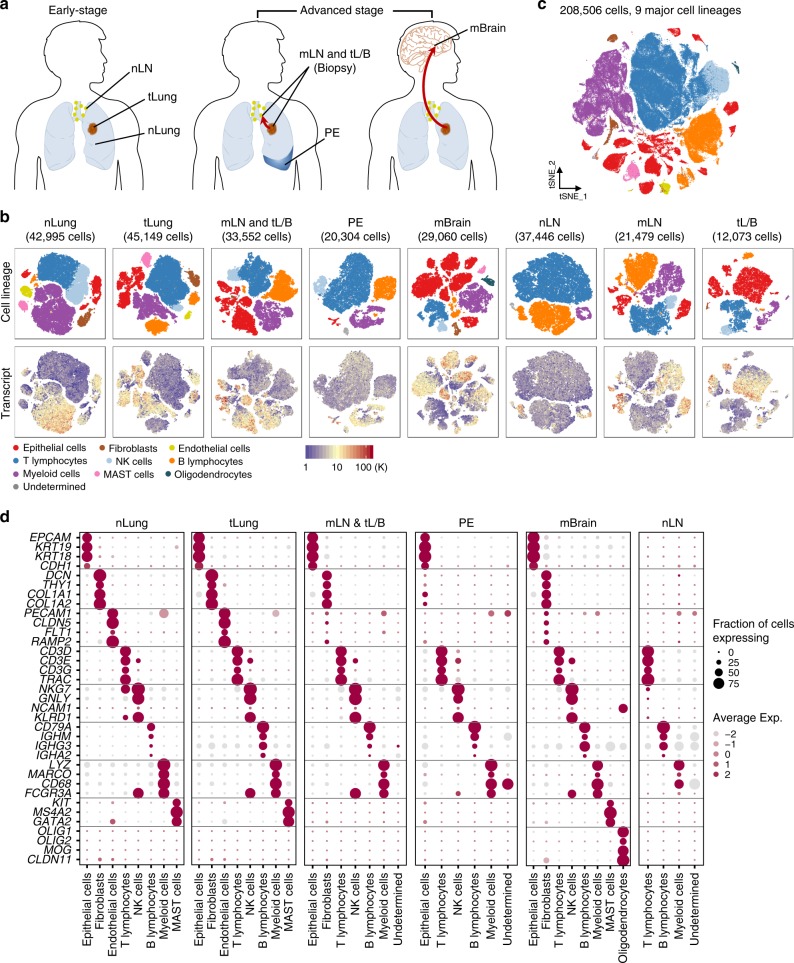
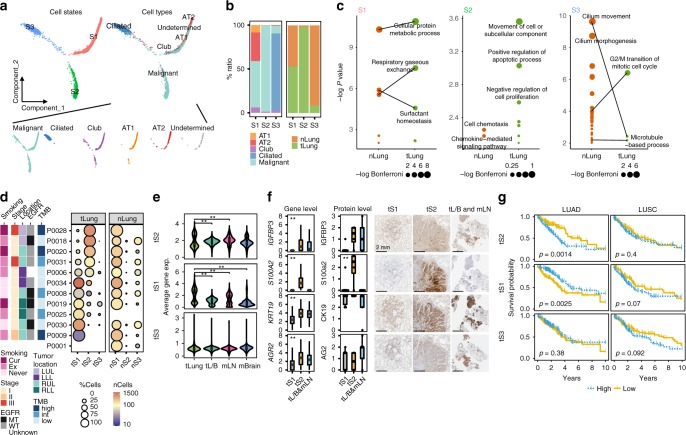
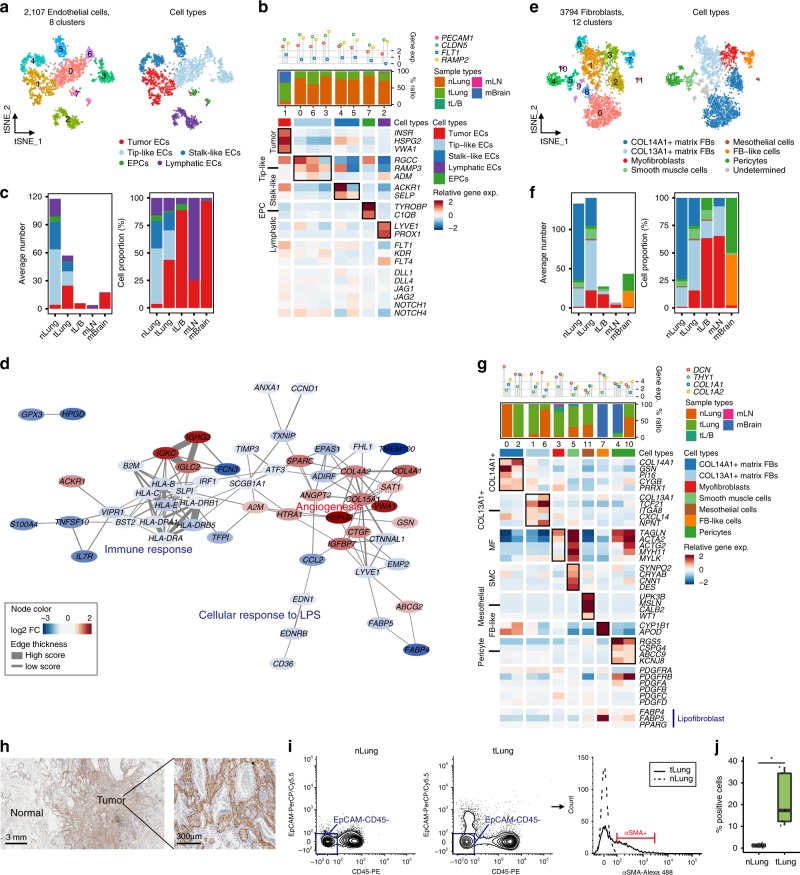
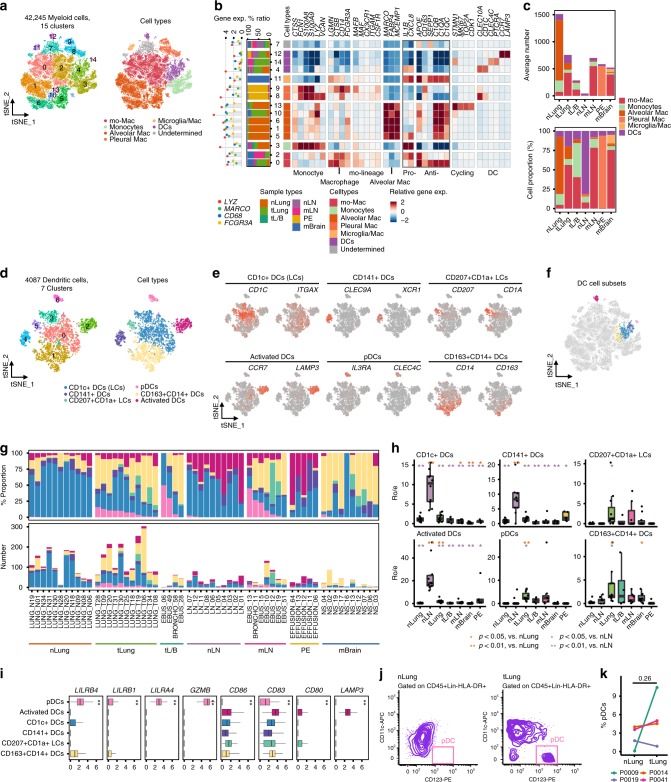
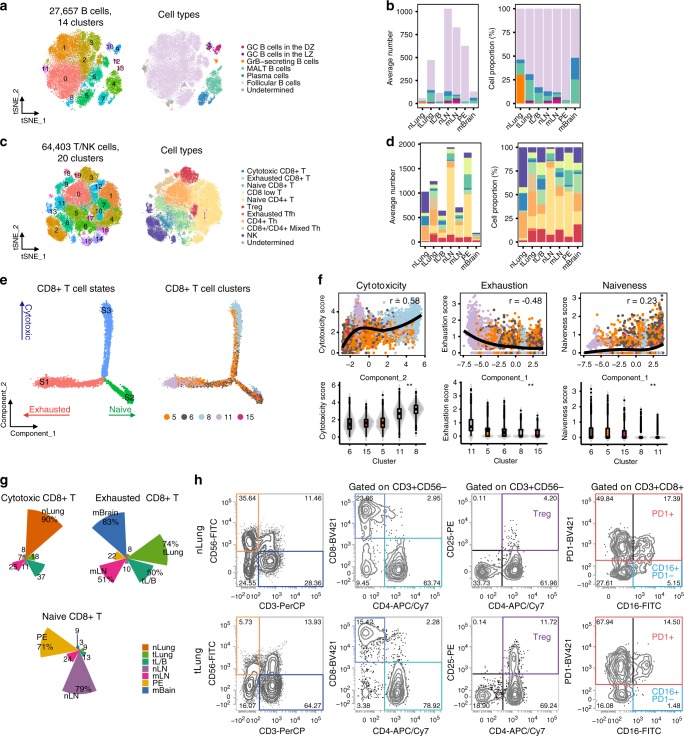
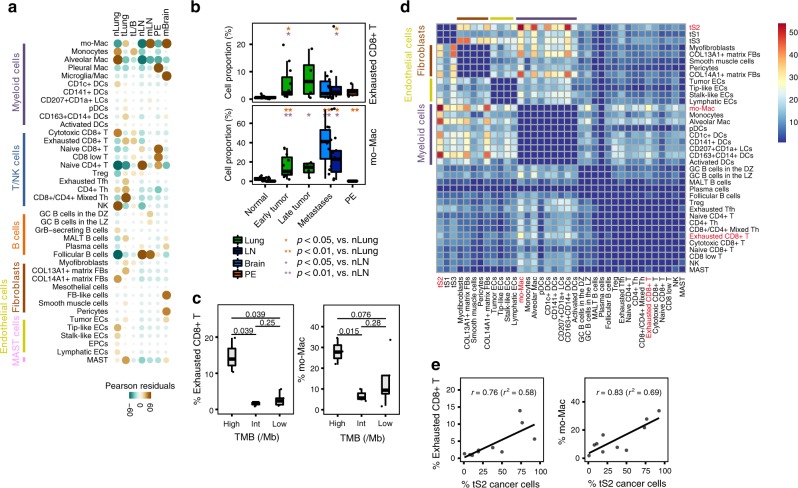
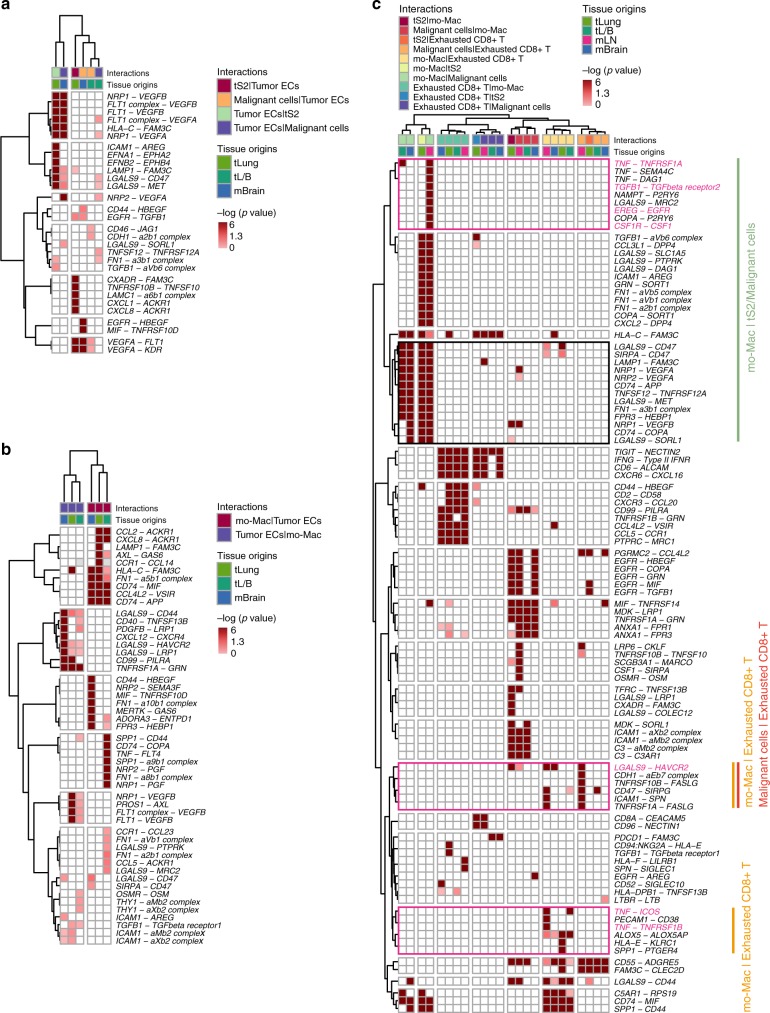
Advanced metastatic cancer poses utmost clinical challenges and may present molecular and cellular features distinct from an early-stage cancer. Herein, we present single-cell transcriptome profiling of metastatic lung adenocarcinoma, the most prevalent histological lung cancer type diagnosed at stage IV in over 40% of all cases. From 208,506 cells populating the normal tissues or early to metastatic stage cancer in 44 patients, we identify a cancer cell subtype deviating from the normal differentiation trajectory and dominating the metastatic stage. In all stages, the stromal and immune cell dynamics reveal ontological and functional changes that create a pro-tumoral and immunosuppressive microenvironment. Normal resident myeloid cell populations are gradually replaced with monocyte-derived macrophages and dendritic cells, along with T-cell exhaustion. This extensive single-cell analysis enhances our understanding of molecular and cellular dynamics in metastatic lung cancer and reveals potential diagnostic and therapeutic targets in cancer-microenvironment interactions.


Conflict of interest statement

The authors declare no competing interests.

Figures

Fig. 1
Fig. 1. Comprehensive dissection and clustering of 208,506 single cells from LUAD patients.
a Overview of tissue origins in the present study collection. Single-cell RNA sequencing was applied to cancer tissue-derived whole cells from primary sites (tLung and tL/B), pleural fluids (PE), lymph node (mLN), and brain metastases (mBrain), as well as normal tissues from lungs (nLung) and lymph nodes (nLN). b tSNE projection within each tissue origin, color-coded by major cell lineages and transcript counts. c tSNE plot of 208,506 single cells colored by the major cell lineages as shown in (b). d Dot plot of mean expression of canonical marker genes for nine major lineages from tissues of each origin, as indicated.
Fig. 2
Fig. 2. Identification of novel cancer cell signature tS2 in LUAD and the connection to poor survival.
a Unsupervised transcriptional trajectory of malignant and normal epithelial cells from Monocle (version 2), colored by cell states and subsets. b Relative proportion of cell subsets and tissue origins for each cell state as shown in (a). c Functional categories (Gene Ontology terms) of signature genes specific to each cell state as shown in (a). d Different enrichment of cell states within tLung and nLung, and associated clinical parameters. The clinical and pathological parameters originated from tLung. Cur: current smoker; Ex: ex-smoker; Never: never smoker; LUL: left upper lobe; LLL: left lower lobe; RUL: right upper lobe; RLL: right lower lobe. e Changes in average tumor cell state-specific signature gene expression with lung cancer progression (tLung and tL/B) and metastasis (mLN and mBrain). **, two-sided Wilcoxon test p-value < 0.01. f Box plots depicting single-cell gene expression and the quantified protein levels of selected markers specific to the tS2 epithelial subset. tS1-enriched tLung (n = 7; T06, T08, T09, T19, T25, T30, T34), tS2-enriched tLung (n = 4; T18, T20, T28, T31), and tL/B & mLN (n = 5; EBUS_06, EBUS_10, EBUS_13, EBUS_19, EBUS_28). **, one-way ANOVA test p-value < 0.01. Each box represents the interquartile range (IQR, the range between the 25th and 75th percentile) with the mid-point of the data, whiskers indicate the upper and lower value within 1.5 times the IQR. IHC staining of IGFBP3, S100a2, CK19, and AG2 on formalin-fixed and paraffin-embedded slides for the tS1 (T19), tS2 (T28), and tL/B & mLN (EBUS_10) samples. Scale bar, 2 mm. g, Kaplan–Meier overall survival curves of TCGA LUAD (n = 494 samples), and LUSC (n = 490 samples) patients. +: censored observations. P-value (p) was calculated using the two-sided log-rank test.
Fig. 3
Fig. 3. Tumor endothelial cells and myofibroblasts promoting angiogenesis and tissue remodeling.
a tSNE plot of endothelial cells, color-coded by clusters and cell subsets as indicated. EPCs: endothelial progenitor cells. b Three-layered complex heatmap of selected endothelial cell marker genes in each cell cluster. Top: Mean expression of known lineage markers. Middle: Tissue preference of each cluster; Bottom: Relative expression map of known marker genes associated with each cell subset. Mean expression values are scaled by mean-centering, and transformed to a scale from -2 to 2. c Average cell number and relative proportion of EC subsets from tissues of each origin. nLung, n = 11 samples; tLung, n = 11 samples; tL/B, n = 3 samples; mLN, n = 2 samples; mBrain, n = 9 samples. d Functional association networks between signature genes specific to tumor ECs. e tSNE plot of fibroblasts (FBs), color-coded by clusters and cell subsets as indicated. f Average cell number and relative proportion of fibroblast subsets from tissues of each origin (excluding undetermined cells). nLung, n = 11 samples; tLung, n = 11 samples; tL/B, n = 3 samples; mLN, n = 4 samples; mBrain, n = 10 samples. g Complex heatmap of selected fibroblast marker genes in each cell cluster, as shown in (b) (excluding undetermined cells). h, IHC staining of α-SMA on formalin-fixed and paraffin-embedded slides for the independent biospecimens (n = 4). All replicates showed the similar results. i, Representative flow cytometry plots showing myofibroblast (α-SMA+) in primary tumor (T06) and normal lung (N06) tissues. j, Box plot of the percentage of myofibroblast (α-SMA+) in normal and tumor-derived EPCAMCD45 cells. nLung (n = 5; N06, N18, N41, N42, N43) and tLung (n = 5; T06, T18, T41, T42, T43). SMC and pericytes can be included in the α-SMA + cells as minor populations. *p < 0.05 (p = 0.02), two-sided Student’s t test. Each box represents the interquartile range (IQR, the range between the 25th and 75th percentile) with the mid-point of the data, whiskers indicate the upper and lower value within 1.5 times the IQR.
Fig. 4
Fig. 4. Diversity within the myeloid cell lineage and functionality according to tissue origins.
a tSNE plot of myeloid cells, color-coded by clusters and cell subsets as indicated. b Complex heatmap of selected myeloid cell marker genes in each cell cluster. Left: Tissue preference of each cluster. Right: Relative expression map of known marker genes associated with each cell subset. Mean expression values are scaled by mean-centering, and transformed to a scale from -2 to 2. Pro-: Pro-inflammatory; Anti-: Anti-inflammatory. c Average cell number and relative proportion of myeloid cell subsets from each tissue origin (excluding undetermined cells). nLung, n = 11 samples; tLung, n = 11; tL/B, n = 4; nLN, n = 10; mLN, n = 7; PE, n = 5, mBrain, n = 10. d, e tSNE plot of DCs, color-coded by clusters, cell subsets, and canonical marker gene expression (gray to red). f Partitioning of dendritic cell (DC) subsets on tSNE plot of myeloid cells in (a). g Cell number and relative proportion of DC subsets in each sample. h Tissue preference of DC subsets. RO/E is the relative score of observed cell numbers over expected cell numbers calculated by chi-square test. The RO/E values of all tissue origins are shown in different colors. Black dots represent different patients. *p < 0.05; **p < 0.01, two-sided Student’s t test. i Median expression of selected marker genes for DC subsets associated with their functionality in each DC subset. **, one-way ANOVA test p-value < 0.01. pDCs, n = 172 cells; Activated DCs, n = 456; CD1c+ DCs, n = 1,782; CD141+ DCs, n = 303; CD207+CD1a+ LCs, n = 177; CD163+CD14+ DCs, n = 1,197. j Representative flow cytometry plots showing pDC (CD11c-CD123+ DCs) populations in primary tumor (T09) and normal lung (N09) tissues. k Paired dot plot of the percentage of pDC (CD11c-CD123+ DCs) population in myeloid cells (CD45+Lin-HLA-DR+) derived from nLung-tLung paired samples (four pairs; P0009, P0014, P0019, P0041). The increase of pDC populations was detected in the selected primary tumor tissues (T09, T14, and T41). P-value = 0.26, two-sided Student’s t test. In the box plot in (h) and (i), each box represents the interquartile range (IQR, the range between the 25th and 75th percentile) with the mid-point of the data, whiskers indicate the upper and lower value within 1.5 times the IQR.
Fig. 5
Fig. 5. B cell- and T/NK cell-mediated immune responses during lung cancer progression.
a tSNE plot of B cells, color-coded by clusters and cell subsets as indicated. DZ: dark zone; LZ: light zone; GrB, granzyme B; MALT: mucosa-associated lymphoid tissue. b Average cell number and relative proportion of B cell subsets from tissues of each origin (excluding undetermined cells). nLung, n = 11 samples; tLung, n = 11 samples; tL/B, n = 4 samples; nLN, 10 samples; mLN, n = 7 samples; PE, n = 5 samples, mBrain, n = 10 samples. c tSNE plot of T/NK cells, color-coded by clusters and cell subsets as indicated. Tfh: T follicular helper; Th: T helper. d Average cell number and relative proportion of T/NK cell subsets from tissues of each origin (excluding undetermined cells). nLung, n = 11 samples; tLung, n = 11 samples; tL/B, n = 4 samples; nLN, 10 samples; mLN, n = 7 samples; PE, n = 5 samples, mBrain, n = 10 samples. e Unsupervised trajectory of CD8+ T cell functional state transitions. f Correlation of Monocle components with T cell functional features (mean expression of signature genes in Supplementary Fig. 8a). Each dot indicates single cells colored by their clusters. Solid black line and the top-right text (r) denote LOESS fit and Pearson’s correlation, respectively (top). Violin plot of T cell functional features in each cluster (bottom). **, one-way ANOVA test p-value < 0.01. g Tissue distribution along functional states in CD8+ T cells. h Flow cytometry plots gated on NK and T cell subsets (Treg, cytotoxic and exhausted CD8+ T cells) from primary tumor (T08) and normal lung (N08) tissues.
Fig. 6
Fig. 6. Phenotypic changes during LUAD progression and metastases.
a Tissue distribution map for each of the 40 immune and stromal cell subsets. Pearson residual calculated using the chi-square test was used to adjust cell-sampling biases between tissue origins. Brown and green colors indicate enrichment and depletion, respectively. Circle size is proportional to the contribution of a given cell. b Increased proportion of exhausted CD8+ T cells/mo-Macs during LUAD progression and metastases. Immune cell proportion was estimated within a non-epithelial compartment. *p < 0.05; **p < 0.01, two-sided Student’s t test. nLung, n = 11 samples; tLung, n = 11 samples; tL/B, n = 4 samples; nLN, 10 samples; mLN, n = 7 samples; PE, n = 5 samples, mBrain, n = 10 samples. c Enrichment of exhausted CD8+ T cells/mo-Macs in tLung samples with a high mutational burden (TMB). The significance was determined using two-sided Student’s t test. high, n = 3 samples, int, n = 3 samples, low, n = 5 samples. d Heat map depicting the number of significant interactions between tLung cell subsets. e Association between proportional changes in exhausted CD8+ T cells/mo-Macs and tS2 cancer cells in tLung. The proportion of tS2 cells was estimated with respect to all malignant cells in each sample. Top-right text (r and r2) represents Pearson’s correlation and its coefficient of determination. In the box plot in b and c, each box represents the interquartile range (IQR, the range between the 25th and 75th percentile) with the mid-point of the data, whiskers indicate the upper and lower value within 1.5 times the IQR.
Fig. 7
Fig. 7. Significant ligand-receptor pair genes accounting for specific inter-cellular interactions.
Heatmap depicting significant interactions between (a) Tumor ECs and cancer cells; (b) mo-Macs and tumor ECs; (c) Exhausted CD8+ T cells, mo-Macs, and cancer cells in our LUAD collections (tS2 in tLung and malignant cells in tL/B, mLN, and mBrain). One-sided p-value is calculated from permutation test.

Comment in

References

    1. Riihimaki M, et al. Metastatic sites and survival in lung cancer. Lung cancer. 2014;86:78–84. doi: 10.1016/j.lungcan.2014.07.020. - DOI - PubMed
    1. Cancer Genome Atlas Research N. Comprehensive molecular profiling of lung adenocarcinoma. Nature. 2014;511:543–550. doi: 10.1038/nature13385. - DOI - PMC - PubMed
    1. Larsen JE, Minna JD. Molecular biology of lung cancer: clinical implications. Clin. Chest Med. 2011;32:703–740. doi: 10.1016/j.ccm.2011.08.003. - DOI - PMC - PubMed
    1. Popper HH. Progression and metastasis of lung cancer. Cancer Metastasis Rev. 2016;35:75–91. doi: 10.1007/s10555-016-9618-0. - DOI - PMC - PubMed
    1. Chae YK, et al. Current landscape and future of dual anti-CTLA4 and PD-1/PD-L1 blockade immunotherapy in cancer; lessons learned from clinical trials with melanoma and non-small cell lung cancer (NSCLC) J. Immunother. Cancer. 2018;6:39. doi: 10.1186/s40425-018-0349-3. - DOI - PMC - PubMed

Publication types

MeSH terms