. 2020 May 8;11(1):2267.
doi: 10.1038/s41467-020-16100-3.

Budding yeast complete DNA synthesis after chromosome segregation begins

Affiliations

Budding yeast complete DNA synthesis after chromosome segregation begins

Tsvetomira Ivanova et al. Nat Commun. .

Abstract

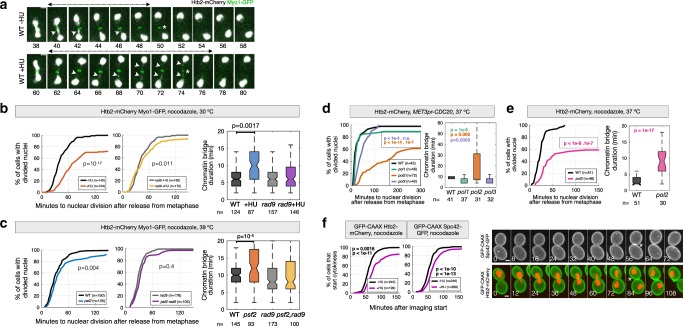
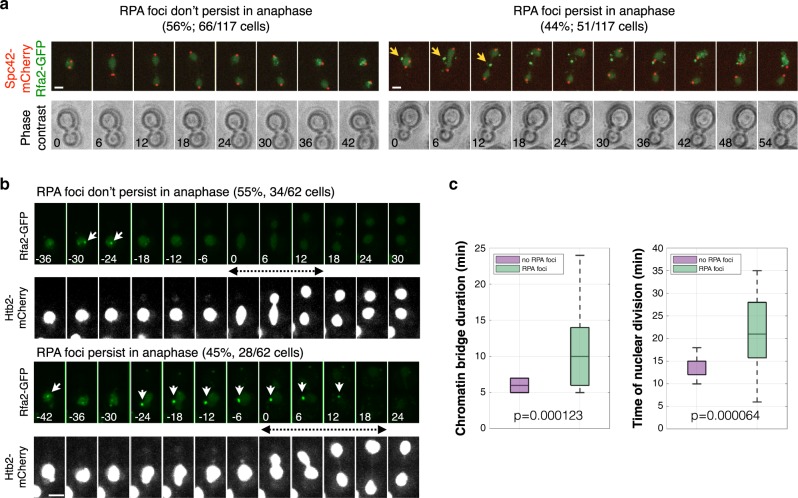
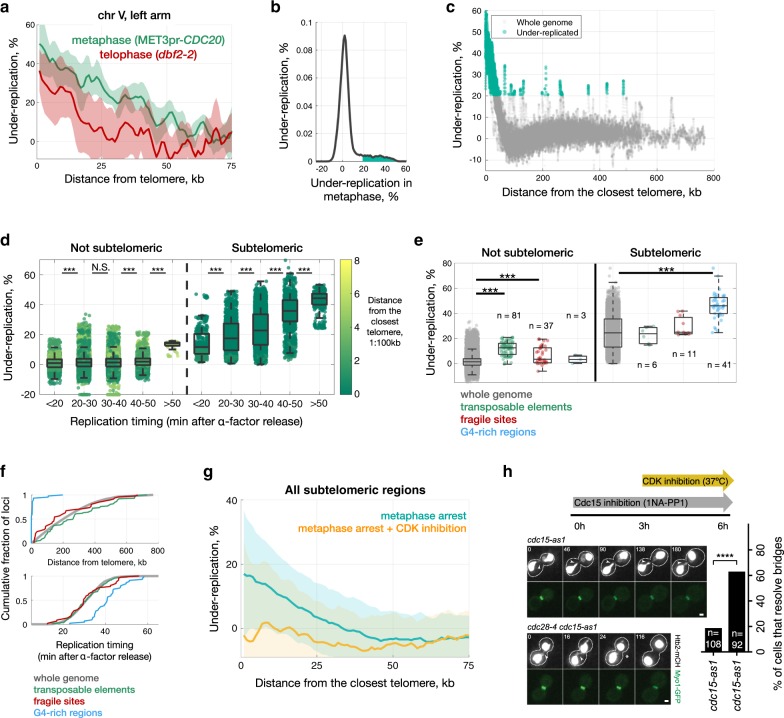
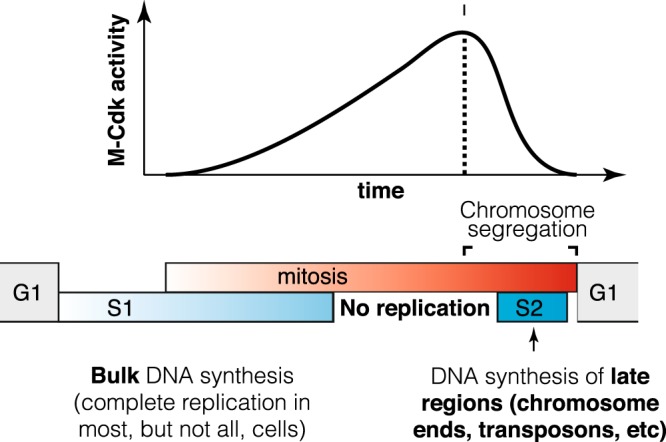
To faithfully transmit genetic information, cells must replicate their entire genome before division. This is thought to be ensured by the temporal separation of replication and chromosome segregation. Here we show that in 20-40% of unperturbed yeast cells, DNA synthesis continues during anaphase, late in mitosis. High cyclin-Cdk activity inhibits DNA synthesis in metaphase, and the decrease in cyclin-Cdk activity during mitotic exit allows DNA synthesis to finish at subtelomeric and some difficult-to-replicate regions. DNA synthesis during late mitosis correlates with elevated mutation rates at subtelomeric regions, including copy number variation. Thus, yeast cells temporally overlap DNA synthesis and chromosome segregation during normal growth, possibly allowing cells to maximize population-level growth rate while simultaneously exploring greater genetic space.


Conflict of interest statement

The authors declare no competing interests.

Figures

Fig. 1
Fig. 1. EdU nuclear incorporation occurs in G1 but not M-phase arrested cells.
a MET3pr-CDC20 cells were grown for 3.5 h in +Met medium to block them in metaphase and treated with EdU as they were either kept in metaphase arrest or released into alpha factor-containing -Met medium for 60 min to arrest them in G1. b Cells blocked in G1 showed higher nuclear EdU incorporation than metaphase cells, in both DAPI-rich (white arrows) and DAPI-poor regions (yellow arrowheads). N, nucleus; Nu, nucleolus; Mt, mitochondria. ****p < 0.0001, two-sided t test compared to metaphase. N = 27 cells/category. Quantification of DNA content by sytox green for cells arrested in metaphase by Cdc20 depletion or released into an alpha-factor arrest are shown in the bottom. c To visualise G1 nuclear morphology after metaphase arrest and release, cells expressing Net1-GFP (to label the nucleolus) and Nup49-mCherry (nuclear envelope) were arrested with nocodazole for 3 h, and released into fresh medium supplemented with alpha factor. Two independent examples are shown. Arrows point to nuclear elongations that contain Net1 but stain poorly with DAPI. This experiment was repeated two times independently with similar results. Scale bars: 2 µm.
Fig. 2
Fig. 2. DNA synthesis in late mitosis promotes timely nuclear division.
a Cells arrested in metaphase by treatment with nocodazole and released from metaphase in fresh medium (-HU), or treated with 0.1 M HU for 30 min and released from the metaphase block in fresh medium containing HU (+HU) (see Methods). Arrowheads point to chromatin bridges labeled with Htb2-mCherry; the chromatin bridge lifetime is indicated by double-headed arrows. Asterisks mark contraction of the actomyosin ring labeled with Myo1-GFP. Images were acquired every 2 min. The time relative to imaging start is indicated in minutes. be The time of nuclear division and bridge lifetime for cells blocked in metaphase at the permissive condition, and released from the metaphase arrest after inhibition of DNA synthesis. Nuclear division is defined as the time between release from metaphase and resolution of chromatin bridges (final DNA segregation). Bridge duration is defined as the time between anaphase onset (nuclear elongation) and bridge resolution. Cells were either released from a metaphase arrest in the presence of HU at 30 °C, or arrested in metaphase at 25 °C and released at the restrictive temperature to inactivate DNA replication. Arrest conditions and fluorescent reporters are indicated at the top of each panel. f The time of cytokinesis (membrane closure at the bud neck, monitored with GFP-CAAX) for cells expressing the indicated reporters and released from a metaphase arrest in the presence or absence of 0.1 M HU at 30 °C. Representative cells are shown; asterisks indicate cytokinesis. The number of cells (n, pooled from at least two independent experiments) is indicated. p values are from two-sided Mann-Whitney, Fisher’s Exact tests. Scale bars in a, f: 2 µm.
Fig. 3
Fig. 3. Freely-cycling cells containing single-stranded DNA during mitosis take more time to resolve chromatin bridges and divide.
a Cells expressing Spc42-mCherry to visualise the spindle poles, and Rfa2-GFP to visualise RPA foci, were grown to mid-log phase and imaged every 6 min for 3 h at 30 °C. RPA foci are present in all cells in S-phase and persist during anaphase in 44% of cells (arrows). Time from anaphase onset is indicated in minutes. Scale bar, 2 µm. b,c Cells with RPA foci in anaphase take more time to resolve chromatin bridges and accomplish cell division. Cells as in (a) but expressing Htb2-mCherry to visualise chromosomes, imaged every 5–7 min. Chromatin bridge lifetime and nuclear division were quantified for cells with and without RPA anaphase foci and represented as boxplots. On each box, the central mark indicates the median, and the bottom and top edges of the box indicate the 25th and 75th percentiles, respectively. The whiskers extend to the most extreme data points not considered outliers. Bridge lifetime was defined as the time during which the two divided nuclear masses are joined by a thinner connection (visualised with Htb2-mCherry). The timing of nuclear division is defined as the interval between the onset of nuclear elongation and bridge disappearance. n = 62 cells pooled from 4 independent experiments; p values are indicated (two-sided Student t test). Scale bars: 2 µm.
Fig. 4
Fig. 4. Segregation of chromatin bridges in anaphase requires the mitotic exit network.
a Quantification of chromatin bridges in MEN mutants. Cells of the indicated strains expressing Htb2-mCherry were arrested in G1 at 25 °C, released from the block at 37 °C, fixed at the indicated times, and imaged (see Methods). Images depict wt cells during the time course and MEN mutant cells 2–3 h after release from the G1 block. Arrows mark anaphase bridges. At least 100 cells were imaged per time point. The graph shows the mean and SEM of 3 independent experiments. b A 5-kb tetO array was inserted in subTel12R, Chromosome 12 at 1061 kb from the left telomere; the fluorescent spot is centred 20 kb away from TEL12R (green arrowheads). The rDNA locus in the same arm is labeled with Net1-mCherry (white arrowheads). The SPBs are marked with Spc42-mCherry (asterisks). c The time of rDNA and subTel12R separation relative to anaphase in WT and MEN mutants. n = 202 cells (WT); 252 (cdc15-2), 235 (dbf2-2). p values (two-sided Student T test) are indicated. d In MEN cells, the subTel12R sister spots get closer to each other after their initial separation. Left: an example of sister spot collapse is shown. Note that as the sister spots collapse, the spindle remains elongated and the rDNA masses separated, demonstrating non-disjunction of subtelomere regions. Top right: the minimal distance between subTel12R spots after their initial maximal separation for all cells imaged; 0 indicates collapse. Bottom right: the distance between SPBs in the same frame in which the subTel12R spots reach their minimal distance. Thus, the minimal distance between subTel12R spots is not associated with a shortening of the spindle. ****p < 0.0001, two-sided Student T test. Scale bars: 1 µm.
Fig. 5
Fig. 5. DNA synthesis is required for resolution of chromatin bridges in MEN-deficient cells.
a MEN bridges are stable even in the absence of cohesin. 1NA-PP1 was added to mid-log phase cultures at 25 °C to inactivate Cdc15. After 3 h, cultures were shifted to 37 °C, imaged by time-lapse fluorescence microscopy, and the number of cells with stable vs. resolved bridges during the next 3 h was determined. t = 0 corresponds to the start of imaging (temperature shift). Cells were pooled from three independent experiments. b MEN bridges do not require topoisomerase II for their resolution. Cells were treated as in (a) except that after 3 h, NAAP1 was removed to allow Cdc15 reactivation. Numbers indicate time (min) relative to cytokinesis. The fraction of cells resolving their bridges before actomyosin ring contraction during 3 h following washout of 1-NA-PP1 was determined. Cells were pooled from three (cdc15-as1 top2-4) or six independent experiments (cdc15-as1). c MEN bridges require DNA polymerases for their resolution. Cells of the indicated strains were treated and analysed as in (b). Arrowheads in a-c point to chromatin bridges and asterisks mark actomyosin ring contraction. Two-sided Fisher’s exact tests: *p < 0.05; **p < 0.01; ***p < 0.001; ****p < 0.0001. d RPA foci persist into anaphase in MEN mutants. 1-NA-PP1 was added to mid-log phase cells at 25 °C. Representative cells are shown. Arrowheads point to Rfa2-GFP foci. The graph shows the fraction of cells with RPA foci during the first 20 min after anaphase entry. Cells were pooled from three independent experiments (two-sided T test across replicates p = 0.0068, two-sided Fisher’s exact test of pooled cell counts, p = 1.4e-09). ad scale bar: 1 µm. n = number of cells.
Fig. 6
Fig. 6. Completion of replication of subtelomeric regions and difficult-to-replicate sequences requires the drop in Cdk activity that occurs during mitotic exit.
a Under-representation of subtelomeric regions in chromosome V for metaphase (MET3pr-CDC20, in green) and telophase (dbf2-2, in red) arrests. Shadows correspond to standard deviation across biological replicates (6 for MET3pr-CDC20, 5 for dbf2-2). b Distribution of sequences under-represented in metaphase across the whole genome, with values greater than a threshold of 20.5% (see Methods) shaded in green (1.2 Mb, about 10% of the genome). c Under-representation values for all 200 bp windows throughout the genome, with significantly underrepresented genomic regions colored green. d Late-replicating regions show higher under-representation in both non-subtelomeric and subtelomeric regions (N.S. p > 0.05; ***p < 0.0001, Wilcoxon rank test). All 200-bp windows of measured under-replication split into bins based on their replication timing (data from). Colour-code corresponds to the proximity to telomeres (1:100 kb). ~0.1% of 200 bp regions have under-representation less than −20%; for visualization we plot them at -20%. e Regions with high frequency of G-quadruplexes, transposable elements and fragile sites exhibit higher under-replication in metaphase (***p < 0.0001, two-sided Wilcoxon rank test). f Transposable elements and fragile sites are uniformly distributed across the genome and show the same replication timing as a bulk genome, whereas G4-rich regions are mainly located in subtelomeric regions and replicated later than the majority of the genome. Each transposable element and fragile site correspond to a single functional element, and G4-regions correspond to a single 200 bp window with elevated fraction of G4-sequences. g Genome sequencing was performed in metaphase-arrested (Cdc20-depleted) cells before and after inhibition of Cdk using the ATP analogue-sensitive mutant cdc28-as1 (see Methods). h Inactivation of Cdk function allows chromatin bridge resolution in MEN-deficient (cdc15-as + 1-NA-PP1) cells. Arrowheads mark chromatin bridges and asterisks bridge resolution. Time 0 corresponds to the start of imaging (temperature shift). n = number of cells is indicated. Cells were pooled from three independent experiments. ****p < 0.0001, two-sided Fisher’s exact test. Scale bar: 1 µm.
Fig. 7
Fig. 7. Delaying cytokinesis decreases subtelomeric mutation rate associated with under-replication in mitosis.
a Majority of genes replicated after metaphase are not essential and do not contribute to the fitness cost once knocked out. Each point represents one gene, showing the % under-replication in metaphase-arrested cells and the fitness of the deletion mutant (0 for essential genes). b The median under-replication for all genes in each gene-ontology (GO) term is inversely proportional to the median distance to the closest telomere. Analysis in (a, b) was performed using data from metaphase arrested MET3pr-CDC20 cells. c The mutation rate is higher closer to the telomere, and a delay in cytokinesis decreases mutation rate specifically in the subtelomere. The URA3 reporter was integrated at various distances from TEL14R in the indicated strains and the frequency of FOA-resistant colonies in each of the twelve strains was determined by a fluctuation test (p values from two-sided Student T test). Estimated under-replication values (%) and replication times (min) for the indicated loci: 2 kb, 40.6%, 36.5 min; 15 kb, 36.3%, 29.3 min; 100 kb, 0.7%, 26 min; 150 kb, -3.2%, 23.7 min. See Methods for details.
Fig. 8
Fig. 8. Budding yeast complete DNA synthesis after chromosome segregation begins.
The order of cell cycle phases is represented by grey (G1), blue (S1, S2) and red (M) bars. S phase is divided into pre-mitotic S1, in which the bulk of DNA replication occurs, and S2, which overlaps with chromosome segregation and in which subtelomere, transposons and fragile sites are replicated in a fraction of cells. DNA synthesis is inhibited by high M-Cdk levels during metaphase and resumes during late mitosis when Cdk levels drop and chromosome segregation is taking place.

References

    1. Morgan, D. O. The Cell Cycle: Principles of Control (Primers in Biology) (Sinauer Associates, Inc., 2006).
    1. Coudreuse D, Nurse P. Driving the cell cycle with a minimal CDK control network. Nature. 2010;468:1074–1079. doi: 10.1038/nature09543. - DOI - PubMed
    1. Hartwell LH, Weinert TA. Checkpoints: controls that ensure the order of cell cycle events. Science. 1989;246:629–634. doi: 10.1126/science.2683079. - DOI - PubMed
    1. Magiera MM, Gueydon E, Schwob E. DNA replication and spindle checkpoints cooperate during S phase to delay mitosis and preserve genome integrity. J. Cell Biol. 2014;204:165–175. doi: 10.1083/jcb.201306023. - DOI - PMC - PubMed
    1. Pedersen RT, Kruse T, Nilsson J, Oestergaard VH, Lisby M. TopBP1 is required at mitosis to reduce transmission of DNA damage to G1 daughter cells. J. Cell Biol. 2015;210:565–582. doi: 10.1083/jcb.201502107. - DOI - PMC - PubMed

Publication types