. 2020 May 8;11(1):2270.
doi: 10.1038/s41467-020-16143-6.

Plasma membrane damage causes NLRP3 activation and pyroptosis during Mycobacterium tuberculosis infection

Affiliations

Plasma membrane damage causes NLRP3 activation and pyroptosis during Mycobacterium tuberculosis infection

Kai S Beckwith et al. Nat Commun. .

Abstract

Mycobacterium tuberculosis is a global health problem in part as a result of extensive cytotoxicity caused by the infection. Here, we show how M. tuberculosis causes caspase-1/NLRP3/gasdermin D-mediated pyroptosis of human monocytes and macrophages. A type VII secretion system (ESX-1) mediated, contact-induced plasma membrane damage response occurs during phagocytosis of bacteria. Alternatively, this can occur from the cytosolic side of the plasma membrane after phagosomal rupture in infected macrophages. This damage causes K+ efflux and activation of NLRP3-dependent IL-1β release and pyroptosis, facilitating the spread of bacteria to neighbouring cells. A dynamic interplay of pyroptosis with ESCRT-mediated plasma membrane repair also occurs. This dual plasma membrane damage seems to be a common mechanism for NLRP3 activators that function through lysosomal damage.


Conflict of interest statement

The authors declare no competing interests.

Figures

Fig. 1
Fig. 1. Mtb H37Rv infection induces canonical NLRP3 activation.
THP-1 ASC-GFP macrophages were infected by Mtb-BFP and imaged by time-lapse microscopy or at 24 h post infection (p.i.). a Cells were treated with DMSO control, caspase inhibitors (Z-VAD-FMK (pan-caspase) or VX765 (caspase-1)) or NLRP3 inhibitors (MCC950, KCl). DRAQ7+ cells and ASC specks were quantified at 24 h p.i. IL-1β release was determined by ELISA. b THP-1 ASC-mNeonGreen (WT) or NLRP3 KD cells were infected by Mtb and imaged 24 h p.i. c To assess the role of GSDMD in cell death in cells with ASC speck formation, THP-1 ASC-mNeonGreen (WT) or GSDMD KD cells were infected with Mtb and imaged live. DRAQ7 intensity during ASC-speck formation was measured in single cells in WT (n = 57) and GSDMD KD (n = 81) cells. Median ± IQR are shown. d Primary human monocytes were treated with inhibitors and infected with Mtb, and LDH and IL-1β release were determined 24 h p.i. n.d.—below detection limit. n = 4 biologically independent samples examined over two independent experiments. e Primary human macrophages were treated with inhibitors and infected with Mtb. LDH and IL-1β release were determined 24 h p.i. n = 3 and n = 5 biologically independent samples for LDH and IL-1β data, respectively. f The prevalence of pyroptosis was assessed by quantifying the cumulative number of pyroptotic, necrotic and apoptotic cell death events in THP-1 ASC-GFP cells from a 45-h time-lapse experiment during infection with Mtb. Representative cell death events are shown. Scale bars 10 µm. Data representative of two independent experiments. g The bacterial burden (intracellular Mtb-BFP fluorescence) was determined immediately before ASC-speck formation in pyroptotic cells (n = 26), and at the average time of ASC-speck formation in cells surviving the 24-h experiment (n = 61). Lines indicate median values. Bars show mean ± s.e.m. in (a, b) and mean ± s.d. in (d, e). *p < 0.05, **p < 0.01, ***p < 0.001, ****p < 0.0001, by one-way ANOVA with two-sided Dunnett’s test in (a, b), repeated measures ANOVA with two-sided Dunnett’s test in (d, e) and two-sided Mann–Whitney test in (g). Data in (ac) representative of three independent experiments with n > 2000 cells in technical triplicates per condition. Source data are provided as a Source Data file.
Fig. 2
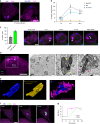
Fig. 2. Pyroptosis causes severe cellular damage and allows for spread of Mtb.
Ultrastructural changes induced before and after inflammasome activation and cell death in cells infected by Mtb were investigated by FIB–SEM tomography. THP1-ASC-GFP cells were infected with Mtb-BFP and fixed after (a, b) 24 h or (c) 5 h in the absence or presence of caspase inhibitors (Z-VAD FMK and VX765), respectively. An (a) uninfected, (b) infected, pyroptotic and (c) infected, living cell with an activated inflammasome is displayed. The uninfected cell in (a) is from a 24-h infection experiment, but was found to be uninfected from confocal microscopy and FIB–SEM. Insets (i), (ii) and (iii) highlight mitochondria/ER/Golgi, plasma membrane morphology and nuclear membrane morphology, respectively. Yellow stars indicate mitochondria, blue arrowheads ER, orange arrowheads Golgi, red arrowheads plasma membrane ruptures and black arrowheads indicate nuclear membranes. Black inset scale bars represent 1 µm. Data representative of two independent experiments. d, e Structure of ASC specks induced by Mtb infection or LPS and nigericin (6,7 µM, 1–2 h) treatment in THP1-ASC-GFP cells or primary human monocytes. Monocytes were treated with FLICA caspase-1 reagent for visualisation of active caspase-1 at the inflammasome. Cells were imaged by correlative confocal microscopy and FIB–SEM, and ASC specks were reconstructed in 3D from the respective FIB–SEM image stacks. Cell numbers (1) and (2) in (d) are the same as in (b) and (c), respectively. Data representative of two independent experiments. f Quantification of intracellular Mtb-BFP fluorescence in single cells before and after ASC speck formation and pyroptosis for n = 10 representative cells. g THP1-ASC-GFP (green) cells in DRAQ7-containing medium (magenta) and infected with Mtb-BFP (blue) imaged by time-lapse confocal microscopy for 24 h. Arrowheads indicate Mtb that is phagocytosed twice during the time course, and arrows indicate ASC specks. Confocal scale bars: 10 µm. Source data are provided as a Source Data file.
Fig. 3
Fig. 3. Mtb-induced inflammasome activation depends on ESX-1 but not mitochondrial damage.
In ac, cells were fixed and imaged by confocal microscopy at 24 h p.i. a To assess the role of ESX-1 and its secreted substrates in the Mtb capsule, THP1-ASC-GFP macrophages were infected with MtbΔRD1 or Mtb cultured in the presence or absence of tween-80. b THP1-ASC-GFP cells were treated or not with MCC950 (as indicated), and infected with Mtb or Mtb devoid of the channel protein with necrosis-inducing toxin (MtbΔcpnT). c THP1-ASC-GFP cells were treated with DMSO or the inhibitor of the mitochondrial permeability transition pore, cyclosporine A (CsA), and infected by Mtb. In ac, ASC specks and DRAQ7+ cells were quantified for n > 2000 cells per condition, *p < 0.05, **p < 0.01, ***p < 0.001, by one-way ANOVA with two-sided Dunnett’s test. Bars show mean ± s.e.m. Data representative of three independent experiments. d Representative time-lapse images of Mtb-BFP-infected THP1-ASC-mNeonGreen cells or THP1-ASC-mNeonGreen GSDMD KD cells, with mitochondria stained by TMRE (red). TMRE accumulates in the mitochondria in proportion to the mitochondrial membrane potential (ΔΨm), indicative of mitochondrial stability. Arrows indicate ASC specks. Scale bars 10 µm. Data representative of three independent experiments. e Quantification of TMRE intensity before and after ASC-speck formation in WT and GSDMD KD cells (n = 57 and n = 81 cells). Median ± IQR are shown. Data representative of two independent experiments. Source data are provided as a Source Data file.
Fig. 4
Fig. 4. ESX-1-mediated phagosomal damage is a prerequisite for NLRP3 activation by phagosomal Mtb.
THP1-Gal3-mScarlet (magenta) cells were infected by Mtb-BFP or MtbΔRD1-BFP in the presence or absence of tween-80, fixed and imaged by confocal microscopy at the indicated time points. a Representative images of Gal-3+ (damaged) and Gal-3 (intact) phagosomes in cells infected with Mtb or MtbΔRD1, respectively. Data representative of three independent experiments. b The percentage of Gal-3+ phagosomes was quantified (n > 4000 phagosomes per condition, three independent experiments) by automated image analysis. Phagosomes with more than one bacterium were considered single phagosomes. *p < 0.05, **p < 0.01, ***p < 0.001, by one-way ANOVA with two-sided Tukey’s test. Statistics are calculated compared with the closest lower condition, except for the star between ΔRD1 and No-Tween at 1 h as indicated. Mean ± s.e.m. are shown. c THP1-ASC-GFP/Gal-3-mRuby3 cells were imaged live for 24 h, and the occurrence of Mtb-associated Gal-3 events in infected, surviving cells (n = 221) compared with pyroptotic cells (n = 162 cells) was quantified from four independent experiments. A representative time lapse showing Gal-3 (arrows) accumulation at damaged Mtb-BFP (blue) phagosomes prior to ASC-speck (green, arrowhead) formation. d Correlative confocal and FIB–SEM imaging of a non-pyroptotic THP1-ASC-GFP/Gal-3-mRuby3 (magenta) macrophage infected with Mtb-BFP (cyan) for 24 h. Dashed square indicates FIB–SEM area, and higher-magnification insets are numbered (1) and (2) for Gal-3 and Gal-3+ Mtb phagosomes. Yellow arrowheads indicate the intact phagosomal membrane; magenta arrowheads indicate patches of host cell membrane around a bacterium, while the absence of membrane is indicated by black arrowheads. e 3D reconstructions from FIB–SEM data of the bacteria from insets 1 and 2 (blue), along with the corresponding phagosomal membrane (yellow) or patches of host cell membrane (magenta). Data in (d), (e) representative of three independent experiments. f THP-1 cells expressing the autophagy protein LC3B-mNeonGreen (green) and Gal-3-mScarlet (magenta) were infected with Mtb-BFP (blue) and imaged by time-lapse microscopy. Data representative of two independent experiments. g Normalised fluorescent intensities of one representative Gal-3 and LC3B event of n = 280 events in two independent experiments are shown. All scale bars are 10 µm unless otherwise specified. Source data are provided as a Source Data file.
Fig. 5
Fig. 5. Inflammasome activation by Mtb is independent of lysosomal damage and release of active cathepsins.
THP1-Gal3-mScarlet (magenta) macrophages were labelled with a marker of acidified lysosomes (LysoView633, green), infected with Mtb-BFP (blue) and imaged by time-lapse confocal microscopy for 24 h. a Representative images, with circular insets showing bacteria that cause Gal-3 recruitment to their acidified or neutral compartment, respectively. b Traces of Gal-3 and LysoView signals for the Mtb phagosomes highlighted in (a). c Quantification of the occurrence of Gal-3 events on acidified (LysoView+) and neutral (LysoView–) Mtb phagosomes. n = 282 Mtb phagosomes analysed from 3 independent experiments. d Representative images of ASC-speck formation in THP1-ASC-GFP (red) cells labelled with LysoView633 (green) infected by Mtb-BFP (blue). Data representative of three independent experiments. e Quantification of the average LysoView signal in single cells before and after ASC-speck formation. n = 27 cells analysed, median ± IQR shown. f THP1-ASC-GFP macrophages were treated with DMSO, pan-cathepsin inhibitor K777 or the inhibitor of lysosomal acidification BafA1 and infected with Mtb H37Rv. After 24 h, ASC specks and DRAQ7+ cells were quantified for n > 2000 cells per condition, and the data were analysed by one-way ANOVA with two-sided Dunnett’s test. Mean ± s.e.m. shown, *p < 0.05. Data representative of three independent experiments. All scale bars 10 µm. Source data are provided as a Source Data file.
Fig. 6
Fig. 6. Mtb-carrying ESX-1 can directly damage the host cell plasma membrane.
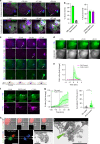
THP-1 macrophages expressing Gal-3 (magenta) and/or ALG-2 (green) were infected with Mtb-BFP (blue) and imaged by time-lapse microscopy and FIB–SEM. a Time-lapse images showing ALG-2 recruitment to PM-Mtb contact points either independent of or after Gal-3 recruitment. Arrows point to recent Gal-3 or ALG-2 events, and circular insets highlight a bacterium that first ruptures its phagosome (Gal-3 recruitment) and then damages the PM (ALG-2 recruitment). Data representative of three independent experiments. b Quantification of localisation of ALG-2 events with respect to Mtb, and of ALG-2 events occurring independent of or after Gal-3 recruitment to ruptured Mtb phagosomes. n = 213 and n = 321 events from three independent experiments. Mean ± s.e.m. shown. c Simultaneous wide-field (WF, cell interior) and TIRF (plasma membrane) time-lapse imaging of ALG-2 and Gal-3 during Mtb infection. Representative of n > 10 experiments. To verify that ALG-2 recruitment is indicative of PM damage, Ca2+ and propidium iodide (PI) fluxes were monitored during Mtb infection. d Time lapse of Ca2+ influx (Calbryte-590, grey) upon ALG-2 recruitment close to Mtb. Data representative of five independent experiments. e Calbryte-590 signal over time during ALG-2 or Gal-3 recruitment (n = 10 events per condition). Median ± IQR shown. f Time lapse of PI influx during Mtb-localised ALG-2 recruitment. Arrows point to ALG-2 recruitment and PI influx events occurring subsequently in the same region of the cell. Data representative of two independent experiments. g PI signal and the cumulative PI influx in single cells during ALG-2 events (n = 55) compared with neighbouring cells without ALG-2 events (n = 37). Median ± IQR and median values shown of all PI influx events from one experiment. Data representative of two independent experiments. ****p < 0.0001 by two-sided Mann–Whitney test. h Correlative imaging of a recent Mtb-localised ALG-2 event identified from time-lapse imaging (top row, insets). Following fixation, cells were re-imaged by confocal and FIB–SEM. SEM images (1, 2) are perpendicular to the locations indicated by dashed lines in the confocal images. Green arrow indicates possible ESCRT-associated vesicles. Confocal scale bars: 10 µm. Data representative of two independent experiments. Source data are provided as a Source Data file.
Fig. 7
Fig. 7. Plasma membrane damage by Mtb activates the NLRP3 inflammasome.
THP-1 cells with ALG-2 (green), Gal-3 (magenta) and ASC (grey) were infected by Mtb-BFP (blue) and imaged live for up to 24 h. a Time lapse of ALG-2, Gal-3 and ASC dynamics during Mtb infection, with the respective events indicated by arrows. Scale bar 10 µm. Data representative of three independent experiments. b Timing of Mtb-localised Gal-3 and ALG-2 events compared with ASC-speck formation. n = 200 ALG-2 and n = 262 Gal-3 events analysed from three independent experiments. Lines indicate median values. ****p < 0.0001 by two-sided Mann–Whitney test. c Percentage of pyroptotic cells with Gal-3 and ALG-2 events within 20 min before ASC-speck formation, compared with the percentage of cells in the surviving, infected population with events in an average 20-min period. n = 104 pyroptotic and n = 137 surviving cells from three independent experiments. d Percentage of ASC specks 24 h p.i. in cells treated with the indicated concentration (in µM) of cytochalasin D. ***p < 0.001 by one-way ANOVA with two-sided Dunnett’s test. n > 2000 cells per condition in triplicate, representative of two independent experiments. Mean ± s.e.m. shown. e Average number of Mtb-localised ALG-2 events per cell during 24 h of infection in the absence or presence of NLRP3 inhibitors. n = 732 events from three independent experiments, mean ± s.e.m. of five fields of view shown. f Quantification of cell death and ASC specks 24 h p.i. in THP1-ASC-mNeonGreen (WT) cells and in cells depleted of the ESCRT-associated proteins ALG-2 or ALIX. Mean ± s.e.m. shown. n > 2000 cells per condition in triplicate, *p < 0.05, **p < 0.01 by one-way ANOVA with two-sided Dunnett’s test. Data representative of three independent experiments. Source data are provided as a Source Data file.
Fig. 8
Fig. 8. Plasma membrane damage by silica activates the NLRP3 inflammasome.
THP-1 cells with ALG-2 (green), Gal-3 (magenta) and ASC (grey) were infected by Mtb-BFP (blue) and imaged live for up to 24 h. a Representative time-lapse images of ALG-2 and Gal-3 from wide-field (WF) and TIRF imaging during treatment with silica (time indicated post addition of silica, p.s.). b Representative time-lapse images of ASC-speck formation during treatment with silica. Arrows indicate ALG-2, Gal-3 and ASC speck events. c Timing of Gal-3 and ALG-2 events compared with ASC-speck formation after silica treatment. n = 82 ALG-2 and n = 85 Gal-3 events analysed from three independent experiments. Lines indicate median values. ****p < 0.0001 by two-sided Mann–Whitney test. d Quantification of the percentage of cells with ALG-2 or Gal-3 events in the given time interval before ASC-speck formation. n = 48 cells from three independent experiments. All images are representative of three independent experiments. Scale bars 10 µm. Source data are provided as a Source Data file.

References

    1. World Health Organization. Global tuberculosis report 2019 (WHO, 2019).
    1. Dorhoi A, Kaufmann SHE. Pathology and immune reactivity: understanding multidimensionality in pulmonary tuberculosis. Semin. Immunopathol. 2016;38:153–166. doi: 10.1007/s00281-015-0531-3. - DOI - PubMed
    1. Berghe TVanden, Linkermann A, Jouan-Lanhouet S, Walczak H, Vandenabeele P. Regulated necrosis: the expanding network of non-apoptotic cell death pathways. Nat. Rev. Mol. Cell Biol. 2014;15:135–147. doi: 10.1038/nrm3737. - DOI - PubMed
    1. Galluzzi L, et al. Molecular mechanisms of cell death: recommendations of the Nomenclature Committee on Cell Death 2018. Cell Death Differ. 2018;25:486–541. doi: 10.1038/s41418-017-0012-4. - DOI - PMC - PubMed
    1. Rathinam VAK, Fitzgerald KA. Inflammasome complexes: emerging mechanisms and effector functions. Cell. 2016;165:792–800. doi: 10.1016/j.cell.2016.03.046. - DOI - PMC - PubMed

Publication types

MeSH terms

LinkOut - more resources