Multicenter Study
. 2020 May 8;10(1):7788.
doi: 10.1038/s41598-020-64798-4.

Functional and anatomical changes in diabetic macular edema after hemodialysis initiation: One-year follow-up multicenter study

Affiliations
Multicenter Study

Functional and anatomical changes in diabetic macular edema after hemodialysis initiation: One-year follow-up multicenter study

Yoshihiro Takamura et al. Sci Rep. .

Abstract

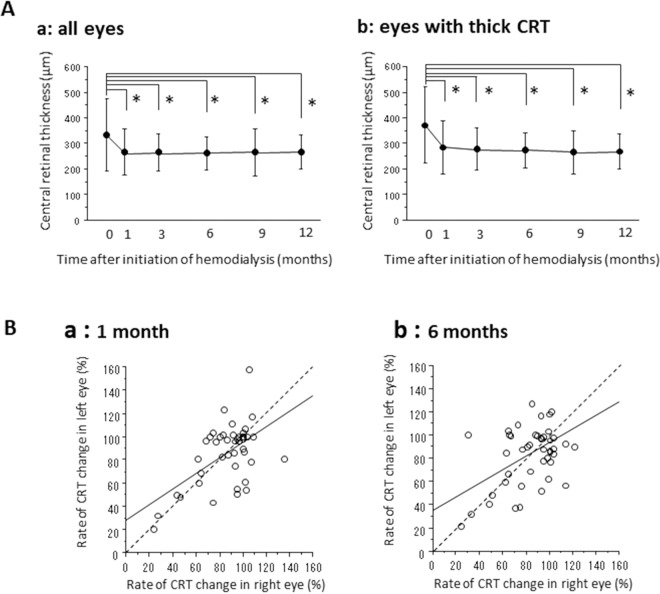
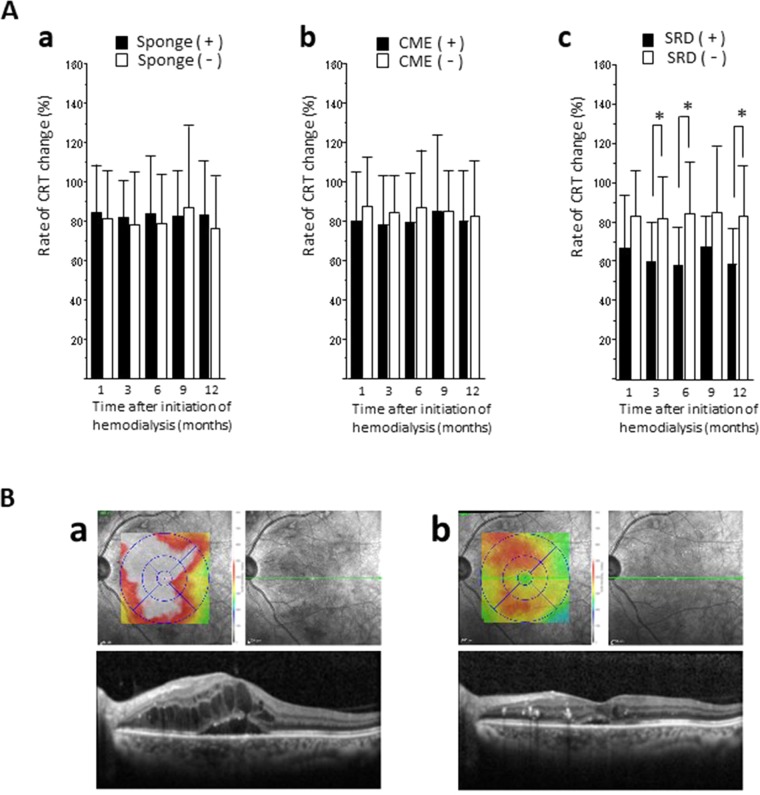
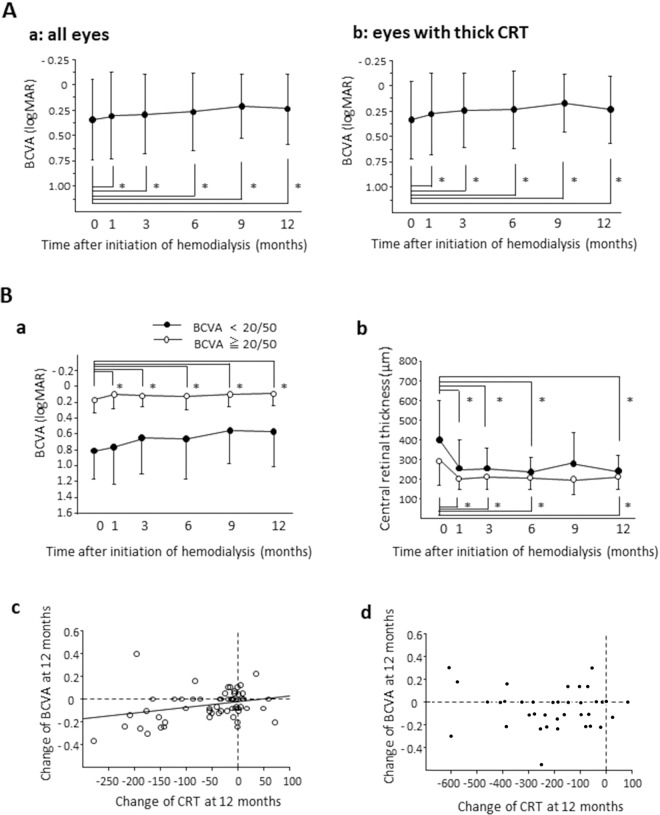
Diabetic nephropathy and retinopathy (DR) including diabetic macular edema (DME) are representative microvascular complications of diabetes. We conducted a retrospective multicenter study analyzing records from patients with DR (132 eyes in 70 patients) and end-stage renal diseases (ESRD) who underwent hemodialysis for the first time. We demonstrated that the central retinal thickness (CRT) values were significantly decreased (p < 0.0001), and the best-corrected visual acuity (BCVA) values were improved (p < 0.05) at 1, 3, 6, 9, and 12 months after hemodialysis initiation, in spite of a lack of specific ocular treatments for DME in 93.2% of eyes. We found a significant positive correlation in the rates of CRT changes between right and left eyes. The CRT reductions were greater in eyes with DME type subretinal detachment than in those with spongelike swelling and cystoid macular edema. The visual outcome gain was associated with the CRT reduction at 12 months in the eyes with good initial BCVA (≧20/50). Hemodialysis induction contributed to functional and anatomical improvements after 1 year, independently of initial laboratory values before the hemodialysis.


Conflict of interest statement

The authors declare no competing interests.

Figures

Figure 1
Figure 1
OCT findings after hemodialysis initiation. (A) Changes in CRT after hemodialysis initiation in all eyes (a) and in the eyes with thick CRTs at baseline (b). Data represent means ± standard deviations (SD). *p < 0.05 (versus baseline). (B) Linear correlation in the rate of CRT changes between the right eye and the left eye. We found significant association at 1 (A; P < 0.0001, R2 = 0.323), and 6 (C; P = 0.002, R2 = 0.202). Proximity of the point to the broken line implies a similar CRT rate change between right and left eyes.
Figure 2
Figure 2
OCT findings after hemodialysis initiation according to different types of DME. (A) CRT change rates between the presence (black bar) and absence (white bar) of spongelike swelling (a), CME (b), and SRD (c). We found significant differences (*p < 0.05) in SRD type at 3, 6, and 12 months after hemodialysis initiation. (B) Representative case showing OCT changes after hemodialysis initiation. A 46-year-old man with ESRD and DME initiated hemodialysis. Previous OCTs showed severe SRD (a). At 1 month after the hemodialysis initiation, DME had improved (b), and the BCVA improved from 20/100 to 20/40. Cross-sectional image corresponds to the green line.
Figure 3
Figure 3
BCVA change after hemodialysis initiation and relation to CRT. (A) BCVA changes after hemodialysis initiation in all eyes (a) and in the eyes with thick CRTs at baseline (b). Visual acuity is expressed as the logMAR. Data represent means ± standard deviations (SD). *p < 0.05 (versus baseline). (B) Temporal profiles of BCVA and CRT in the patients with good BCVA (≧20/50) and poor BCVA (<20/50) at baseline. Changes of BCVA (a) and CRT (b) after hemodialysis initiation in the patients with good BCVAs (white circle) and poor BCVAs (black circle). *p < 0.05 (versus baseline). We found a significant correlation between changes of BCVA and CRT at 12 months after hemodialysis initiation in the patients with good BCVAs (c: p = 0.028, R2 = 0.084), but not in the patients with poor BCVAs (d). The broken line indicates the baseline CRT and BCVA values.

References

    1. He F, Xia X, Wu XF, Yu XQ, Huang FX. Diabetic retinopathy in predicting diabetic nephropathy in patients with type 2 diabetes and renal disease: A meta-analysis. Diabetologia. 2013;56:457–466. doi: 10.1007/s00125-012-2796-6. - DOI - PubMed
    1. Chun DW, Heier JS, Topping TM, Duker JS, Bankert JM. A pilot study of multiple intravitreal injections of ranibizumab in patients with center-involving clinically significant diabetic macular edema. Ophthalmology. 2006;113:1706–12. doi: 10.1016/j.ophtha.2006.04.033. - DOI - PubMed
    1. Nguyen QD, et al. Ranibizumab for Diabetic Macular Edema. Ophthalmology. 2012;119:789–801. doi: 10.1016/j.ophtha.2011.12.039. - DOI - PubMed
    1. Mitchell P, et al. The RESTORE study: ranibizumab monotherapy or combined with laser versus laser monotherapy for diabetic macular edema. Ophthalmology. 2011;118:615–25. doi: 10.1016/j.ophtha.2011.01.031. - DOI - PubMed
    1. Cai S, Bressler NM. Aflibercept, bevacizumab or ranibizumab for diabetic macular oedema. Curr. Opin. Ophthalmol. 2017;28:636–643. doi: 10.1097/ICU.0000000000000424. - DOI - PubMed

Publication types