. 2020 May 8;3(1):226.
doi: 10.1038/s42003-020-0956-7.

Heat shock protein 90-targeted photodynamic therapy enables treatment of subcutaneous and visceral tumors

Affiliations

Heat shock protein 90-targeted photodynamic therapy enables treatment of subcutaneous and visceral tumors

Kensuke Kaneko et al. Commun Biol. .

Abstract

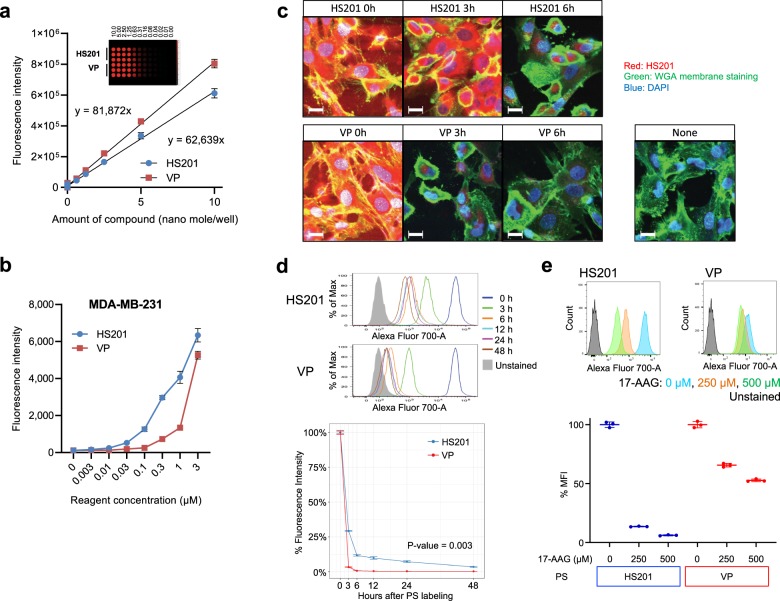
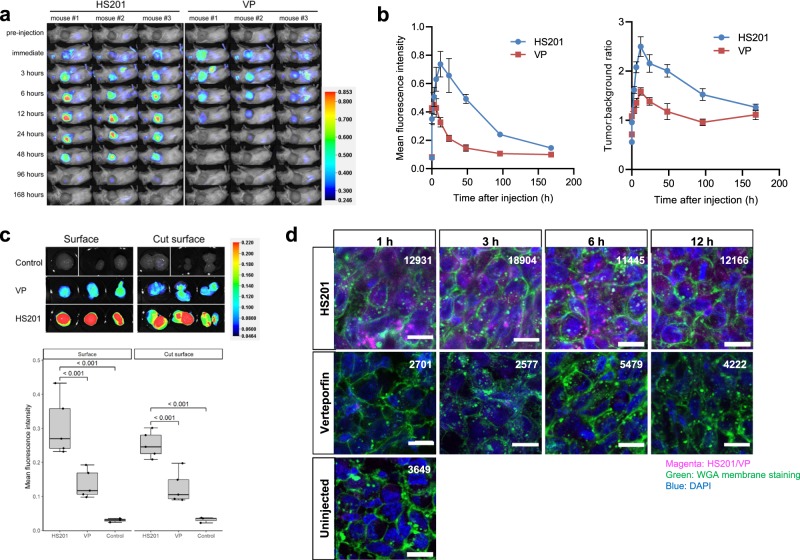
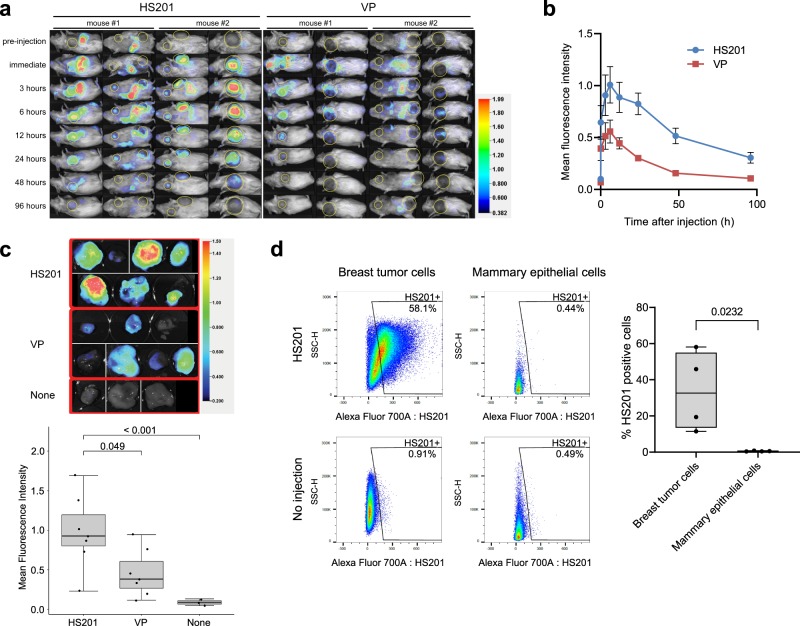
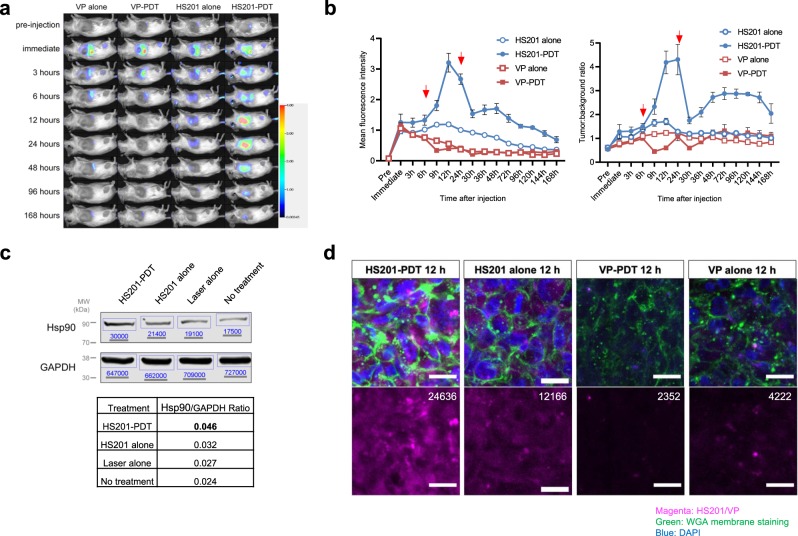
Photodynamic therapy (PDT) ablates malignancies by applying focused near-infrared (nIR) light onto a lesion of interest after systemic administration of a photosensitizer (PS); however, the accumulation of existing PS is not tumor-exclusive. We developed a tumor-localizing strategy for PDT, exploiting the high expression of heat shock protein 90 (Hsp90) in cancer cells to retain high concentrations of PS by tethering a small molecule Hsp90 inhibitor to a PS (verteporfin, VP) to create an Hsp90-targeted PS (HS201). HS201 accumulates to a greater extent than VP in breast cancer cells both in vitro and in vivo, resulting in increased treatment efficacy of HS201-PDT in various human breast cancer xenografts regardless of molecular and clinical subtypes. The therapeutic index achieved with Hsp90-targeted PDT would permit treatment not only of localized tumors, but also more diffusely infiltrating processes such as inflammatory breast cancer.


Conflict of interest statement

T.H. and P.H. have two issued patents pertinent to this work, US 10,112,947 B2 and US 9,738,643 B2, filed by Duke University. The remaining authors declare no competing interests.

Figures

Fig. 1
Fig. 1. Uptake of the two PS, HS201, and VP, by human BC cells in vitro.
a nIR signal at 700 nm wavelength emitted from HS201 and VP. Indicated amount of PS (HS201 or VP) was added to each well and nIR signal intensity was measured at 700 nm. Standard curves for both PS are shown. Data are expressed as means ± SD. b Uptake of HS201 and VP by human BC cells in vitro. MDA-MB-231 cells were labeled with HS201 or VP (0–3 μM, respectively). nIR fluorescence intensity of each well, measured at 700 nm are shown as means ± SD. c Confocal microscope images of MDA-MB-231 cells labeled with HS201 and VP (1 μM) in vitro. Cells were fixed immediately after nIR staining (0 h group), or were washed with DMEM every hour until designated time point and fixed (3 and 6 h groups). Then the cells were stained with WGA AF488 conjugate membrane staining dye and DAPI, and observed by a ZEISS LSM880 confocal microscope. Original magnification: Objective 63×. The scale bar indicates 20 μm. d Flow cytometry analysis of nIR signal accumulated in MDA-MB-231 cells. Cells were labeled with HS201 or VP (1 μM), and then fixed immediately (0 h group) or washed with DMEM every 1 h until 12-h time point (3, 6, and 12 h groups) and every 12 h thereafter (24 and 48 h groups). The histogram shows the signal intensity of representative samples at each time point. The graph shows percentages of mean fluorescence intensities (MFI) when compared with the samples of 0 h group (100%). All experiments were performed in triplicate and data are shown as means ± SEM. Student’s t test was performed for the comparison of %MFI. e Uptake of PSs by MDA-MB-231 cells in the presence or absence of 17-AAG in vitro. The histogram shows the nIR signal intensity of representative samples at each condition. MFI of cells in the absence of 17-AAG were set as 100% for each PS, and MFI of each condition is shown as %MFI. N = 3 for each condition. Data are expressed as means ± SD.
Fig. 2
Fig. 2. Killing of human BC cells by in vitro PDT with HS201 and VP.
a Cytotoxicity of in vitro HS201-PDT and VP-PDT analyzed by MTT assay. MDA-MB-231 cells seeded in 96-well plates were labeled with HS201 or VP (0–3 μM), irradiated by 690 nm wavelength laser (0–30 J/cm2), cultured overnight and analyzed by MTT assay. Upper graph shows the result for HS201-labeled cells, and lower graph shows VP-labeled cells. b Flow-based analysis of apoptotic cell death induced by HS201-PDT and VP-PDT with fixed PS dose (1 μM) and titrated laser dose (0–15 J/cm2). Cells were incubated for 0–2 and 4 h or overnight at 37 °C after treatment, labeled with Annexin V and 7-AAD, and acquired by an LSRII flow cytometer. Percentages of Annexin V positive cells at each time point are shown. c Flow-based analysis of apoptotic cell death induced by HS201-PDT and VP-PDT with fixed laser dose (15 J/cm2) and titrated PS dose (0.03–3 μM). Cells were labeled, acquired and analyzed as described in (b). d Drug-light interval and the killing effect of in vitro PDT. MDA-MB-231 cells were labeled with HS201 or VP (1 µM), washed every hour, and irradiated with laser (0–120 J/cm2) at each time point (0, 3, or 6 h). Cells were incubated overnight and MTT assay was performed. OD ratio is shown as a fold change when compared with cells untreated with laser. Data are expressed as means ± SD.
Fig. 3
Fig. 3. Temporal dynamics of HS201 and VP distribution in human BC xenografts-bearing mice.
a nIR signal from MDA-MB-231 tumor-bearing mice injected with HS201 or VP. HS201 or VP (10 nmol) were administered via tail vein, and nIR signals from tumor areas were detected by the LI-COR Pearl imager at 700 nm channel over time (pre-injection, immediate, 3, 6, 12, 24, 48, 96, and 168 h after injection). b Temporal dynamics of nIR signal from MDA-MB-231 tumors by in vivo imaging. Fluorescence intensities were monitored for individual tumors over time by Pearl Imager and average values (n = 5 mice) are plotted. Half-life of the nIR signal in the tumor site for HS201 and VP was 50 and 13 h, respectively. The ratios of nIR signals detected at the tumor site and background skin around the ear were also calculated and the average values (n = 5 mice) were plotted. Data are expressed as means ± SEM. c Ex vivo imaging of MDA-MB-231 tumors. Mice administered 10 nmol of HS201 or VP were sacrificed at the 24 h time point (5 mice for each VP and HS201 group, 3 mice for control group) to harvest the tumors. nIR signals from excised tumors and their cut surfaces were measured using the Pearl Imager at the 700 nm channel. Three representative tumors from each group are shown. In the two graphs, mean nIR signal intensities of the tumor surface and cut surface are shown. Kruskal–Wallis test was performed followed by non-parametric Dunnett multiple comparisons. d Confocal microscope images of excised MDA-MB-231 tumors. MDA-MB-231 tumors were harvested 1, 3, 6 or 12 h after the PS injection. Tumors were fixed overnight in formalin before sectioning. Samples were stained with WGA Alexa Fluor 488 conjugate membrane staining dye and DAPI and observed using a ZEISS LSM880 confocal microscope. nIR signals from photosensitizers are shown in magenta color. Mean fluorescence intensities of nIR signals for tile scanned large tumor sections are shown in each microscope image. Original magnification: Objective 40×. The scale bar indicates 15 μm.
Fig. 4
Fig. 4. Uptake of HS201 and VP by murine spontaneous BC.
a nIR signal from breast tumor-bearing MMTV-neu mice injected with HS201 or VP. MMTV-neu mice that developed spontaneous BCs with the size of 5–15 mm in diameter were selected, and administered 25 nmol of HS201 or VP via tail vein. nIR signals from the tumor area were detected using a Pearl Imager over time. The images of two representative mice from each group are shown. b Temporal dynamics of nIR signal intensity from spontaneous tumors by in vivo imaging. The average fluorescence intensities (5 mice for HS201 group and 6 mice for VP group) are shown. Half-life of HS201 and VP signal detected in the tumor site was 42 and 15 h, respectively. Data are expressed as means ± SEM. c Ex vivo imaging of spontaneous tumors in MMTV-neu mice. Mice (5 mice 7 tumors for HS201 group, 4 mice 7 tumors for VP group, and 2 mice 3 tumors for control group) were sacrificed at the 6-h time point after HS201 or VP (25 nmol/mouse) injection. nIR signals from excised tumors are shown in the graph. Kruskal–Wallis test was performed followed by nonparametric Dunnett multiple comparisons. d Flow cytometry analysis of HS201 uptake by breast tumor cells and normal mammary epithelial cells in tumor-bearing MMTV-neu mice. HS201 (100 nmol/mouse) was injected into MMTV-neu mice (three tumor-bearing mice with four tumors and two non tumor-bearing mice) via tail vein. Control mice (one tumor-bearing mouse and one non tumor-bearing mouse) received no compound injection. Mice were sacrificed 6 h after compound injection. Tumors and mammary gland tissues were digested into single cells, acquired by an LSRII flow cytometer and nIR signals from tumor cells and mammary epithelial cells (CD24 positive and CD45 negative cells) were analyzed. Dot plots of tumor and epithelial cells from a representative mouse are shown with percentages of HS201 positive cells. Percentages of HS201-positive cells in four samples of breast tumor cells and four samples of normal mammary epithelial cells are shown as a box plot, and t test was performed.
Fig. 5
Fig. 5. HS201-PDT-induced Hsp90 expression and down regulation of client proteins in human BC cells in vitro.
a Hsp90 expression in MDA-MB-231 cells treated with or without HS201-PDT in vitro evaluated by Western blot analysis. MDA-MB-231 cells were separated into four groups, HS201-PDT, HS201 alone, Laser alone, and no treatment groups, and treated accordingly. Hsp90 and GAPDH expression in each group were quantified using an Odyssey CLx imaging system. The table shows Hsp90/GAPDH ratio of each group. b Surface Hsp90 expression of MDA-MB-231 cells treated with or without HS201-PDT in vitro. MDA-MB-231 cells were treated in the same way as in (a). Cell suspensions were prepared and stained with PE-conjugated control IgG or anti-Hsp90 antibody. Surface Hsp90 expression of MDA-MB-231 cells in each group was analyzed by a LSRII flow cytometer. Gray histograms show the cell labeling with control IgG, and the red histograms show the cell labeling with anti-Hsp90 antibody. c Expression of Hsp90 client proteins in MDA-MB-231 cells treated with HS201-PDT. MDA-MB-231 cells were treated with HS201-PDT, VP-PDT, HS201 alone, VP alone, Laser alone, or no treatment. HIF1α, Hsp90, Akt 1/2/3, and GAPDH expression in each group were quantified by an Odyssey CLx imaging system. The table shows the ratio of HIF1α, Hsp90, and Akt 1/2/3 to GAPDH, respectively. The images of full-length blots are available in Supplementary Fig. 13.
Fig. 6
Fig. 6. Enhanced HS201 accumulation and Hsp90 expression in human BC xenografts after HS201-PDT in vivo.
a Enhanced HS201 accumulation in MDA-MB-231 tumors in vivo after laser exposure. MDA-MB-231 tumor-bearing mice were administered HS201 or VP (25 nmol). The laser irradiation (120 J/cm2/4 min) was applied twice (drug-light interval of 6 and 24 h) at 690 nm wavelength to the mice in HS201-PDT and VP-PDT groups. Whole-body images were acquired by a Pearl Trilogy imaging system at the 700 nm channel overtime and images of representative mice for each group are shown. b Temporal dynamics of nIR signal and tumor:background ratio from MDA-MB-231 tumors by in vivo imaging. The nIR signals detected at the tumor site and shaved and depilated skin around the right thigh were measured. The tumor:background ratio was calculated and plotted in the graph (right panel). Averages ± SEM of nIR signal intensities acquired from five mice per group are plotted in the graph. Red arrows indicate the timing of laser irradiation. c Hsp90 expression in MDA-MB-231 tumors treated with or without HS201-PDT in vivo. MDA-MB-231 tumor-bearing mice were administered HS201 (25 nmol/mouse), irradiated with laser (690 nm, 120 J/cm2/4 min) 6 h after PS injection, and sacrificed at 12-h time point to collect the tumor lysates. Hsp90 and GAPDH expression by tumors of each group was quantified by Western blot. The table shows Hsp90/GAPDH ratio of each group. d Confocal microscope images of excised MDA-MB-231 tumors treated with or without HS201-PDT. MDA-MB-231 tumor-bearing mice were administered with HS201 or VP, followed with or without laser irradiation (690 nm, 120 J/cm2/4 min) 6 h after injection, and sacrificed at 12-h time point. Tumors were fixed overnight in formalin before sectioning. Tissue sections were stained with WGA Alexa Fluor 488 conjugate membrane staining dye and DAPI and observed using a ZEISS LSM880 confocal microscope. nIR signals from photosensitizers (magenta color) are shown at the bottom. Mean fluorescence intensities for tile scanned large tumor sections are shown in each microscope image. Original magnification: Objective 40×. The scale bar indicates 15 μm. The images of full-length blots are available in Supplementary Fig. 13.
Fig. 7
Fig. 7. Improved antitumor effect of HS201-PDT against MDA-MB-231 tumors in SCID-beige mice.
a Antitumor effect of HS201-PDT and VP-PDT against MDA-MB-231 tumors in vivo. MDA-MB-231 tumor-bearing mice were administered VP or HS201 (25 nmol/mouse) via tail vein. The laser irradiation (690 nm wavelength, 120 J/cm2/4 min) was applied to the tumor area with DLI of 6 and 24 h (red arrows). The data shown are average ± SEM of tumor volumes (n = 8 for each group). Student’s t test was performed for the comparison of two treatments. b Comparison of the tumor weight among treatment groups. At the end of the experiment (day 25 after treatment initiation), mice were euthanized and all tumors were excised and weighed (n = 8 for each group). Welch t test was used for statistical analysis. c Antitumor effect of repetitive HS201-PDT against MDA-MB-231 tumors in vivo. MDA-MB-231 tumor-bearing mice were administered VP or HS201 (25 nmol/mouse) via tail vein. The laser irradiation (690 nm wavelength, 120 J/cm2/4 min) was applied to the tumor area with DLI of 6 and 24 h (red arrows). Initial PDT treatment was performed on days 0 and 1 and repeated on days 6 and 7. As controls, no treatment and single HS201-PDT (treated on days 0 and 1) groups were made. Averages ± SEM of tumor volumes for each group (n = 14 for no treatment group, n = 14 for single HS201-PDT group, n = 15 for repetitive HS201-PDT group) are shown. ANOVA and Tukey’s test were performed for statistical analysis. Red arrows indicate laser exposures. d Survival of MDA-MB-231 tumor-bearing mice treated with single or repeated HS201-PDT (n = 14 for no treatment group, n = 14 for single HS201-PDT group, n = 15 for repetitive HS201-PDT group). Mice were counted as dead when the tumor volume reached humane endpoint according to IACUC approved protocol (>2000 mm3). Survival data was analyzed with the Cox Proportional Regression Model followed by Tukey’s test.
Fig. 8
Fig. 8. Antitumor effect of HS201-PDT against various types of human BC xenografts in SCID-beige mice.
a Antitumor effect of HS201-PDT against BT474M1 tumors in vivo. HS201-PDT was performed against BT474M1 tumors (luminal B, ER+, HER2+) in female SCID-beige mice in the same way as indicated in Fig. 7a. As controls, no treatment group, HS201 administration alone group, and a group of laser irradiation without PS administration were made. Averages ± SEM of tumor volume for each group (n = 7 for no treatment group, n = 7 for HS201 alone group, n = 6 for laser alone group, and n = 8 for HS201-PDT group) are shown. Kruskal–Wallis test and nonparametric Dunnett’s test performed. Red arrows indicate laser exposures. b Antitumor Effect of HS201-PDT against patient derived HCI-013 tumors in vivo. HS201-PDT was performed against patient derived xenograft, HCI-013 tumors (invasive lobular, ER+, HER2−), as described in Fig. 7a. No treatment group and laser alone group were set as control groups. Averages ± SEM of tumor volume for each group (n = 8 for no treatment group, n = 7 for laser alone group, and n = 10 for HS201-PDT group) are shown. ANOVA and Dunnett’s test performed. Red arrows indicate laser exposures. c Antitumor effect of HS201-PDT against KPL4 tumors in vivo. HS201-PDT was performed against KPL-4 tumors (inflammatory, HER2+) as described in Fig. 7a. No treatment group, HS201 administration alone group, and laser alone group were compared. Averages ± SEM of tumor volume for each group (n = 8 for no treatment group, n = 7 for HS201 alone group, n = 7 for laser alone group, and n = 7 for HS201-PDT group, respectively) are shown. ANOVA and Dunnett’s test performed. Red arrows indicate laser exposures. d Antitumor Effect of HS201-PDT against KPL4 tumors at their late phase in vivo. HS201-PDT was performed against bulky KPL-4 tumors (over 600 mm3 in volume) on SCID-beige mice in the same way as indicated in Fig. 7a. Individual tumor volumes are shown. Red arrows indicate laser exposures.

References

    1. Dolmans DE, Fukumura D, Jain RK. Photodynamic therapy for cancer. Nat. Rev. Cancer. 2003;3:380–387. doi: 10.1038/nrc1071. - DOI - PubMed
    1. Mroz P, Hashmi JT, Huang YY, Lange N, Hamblin MR. Stimulation of anti-tumor immunity by photodynamic therapy. Expert Rev. Clin. Immunol. 2011;7:75–91. doi: 10.1586/eci.10.81. - DOI - PMC - PubMed
    1. Brackett CM, Gollnick SO. Photodynamic therapy enhancement of anti-tumor immunity. Photochem. Photobiol. Sci. 2011;10:649–652. doi: 10.1039/c0pp00354a. - DOI - PMC - PubMed
    1. Theodoraki MN, et al. Influence of photodynamic therapy on peripheral immune cell populations and cytokine concentrations in head and neck cancer. Photodiagn. Photodyn. Ther. 2017;19:194–201. doi: 10.1016/j.pdpdt.2017.05.015. - DOI - PubMed
    1. Baskaran R, Lee J, Yang SG. Clinical development of photodynamic agents and therapeutic applications. Biomater. Res. 2018;22:25. doi: 10.1186/s40824-018-0140-z. - DOI - PMC - PubMed

Publication types

MeSH terms