. 2020 May 8;10(1):7760.
doi: 10.1038/s41598-020-64722-w.

Cell-specific metabolomic responses to injury: novel insights into blood-brain barrier modulation

Affiliations

Cell-specific metabolomic responses to injury: novel insights into blood-brain barrier modulation

Sheng-Fu Huang et al. Sci Rep. .

Abstract

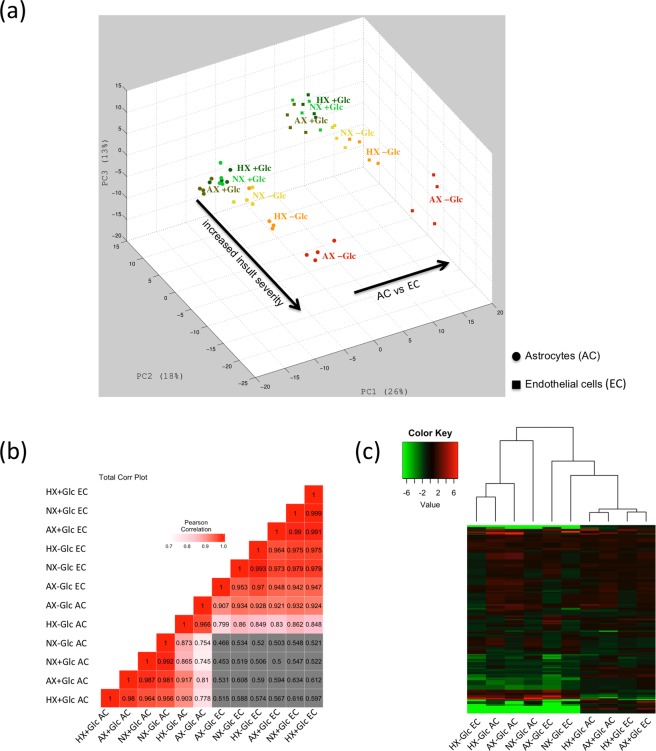
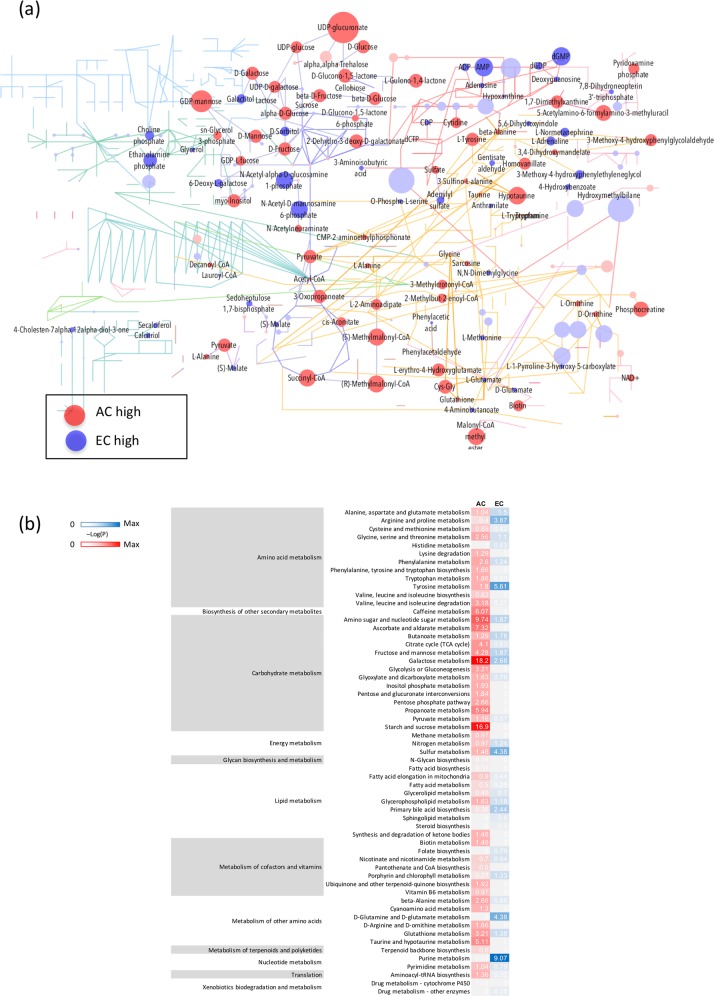
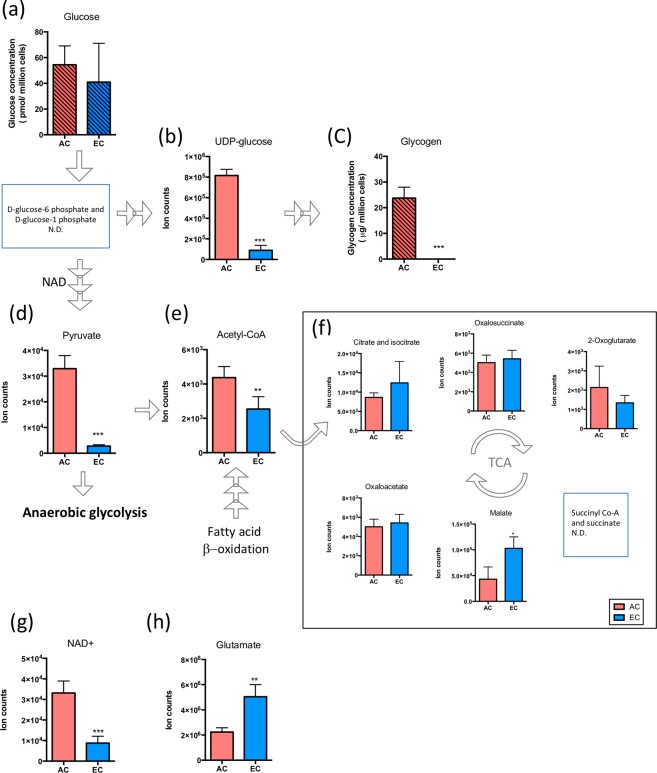
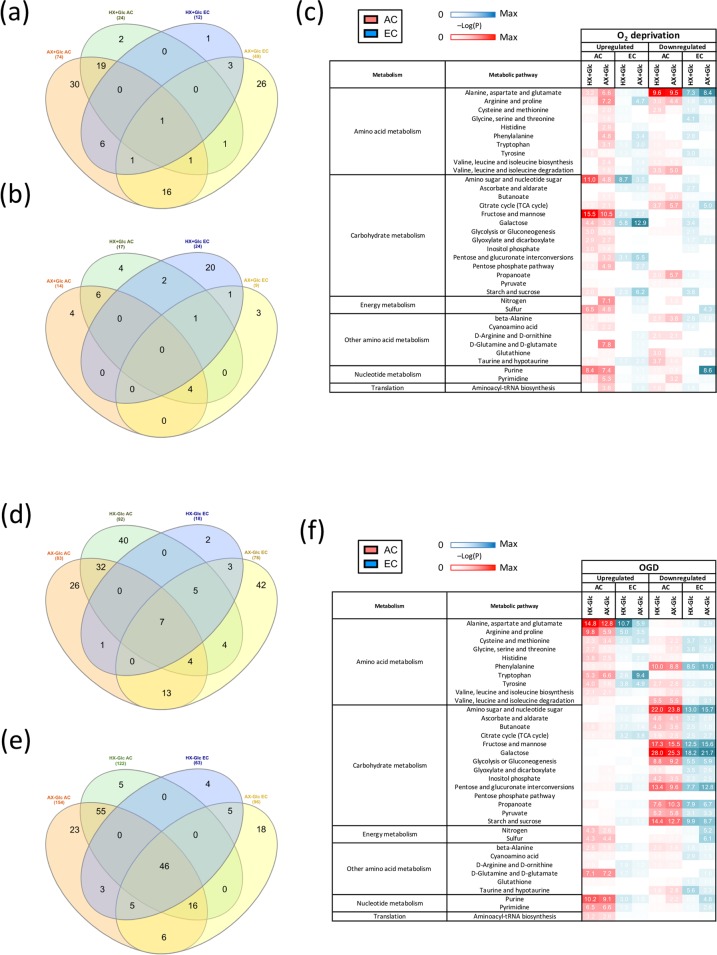
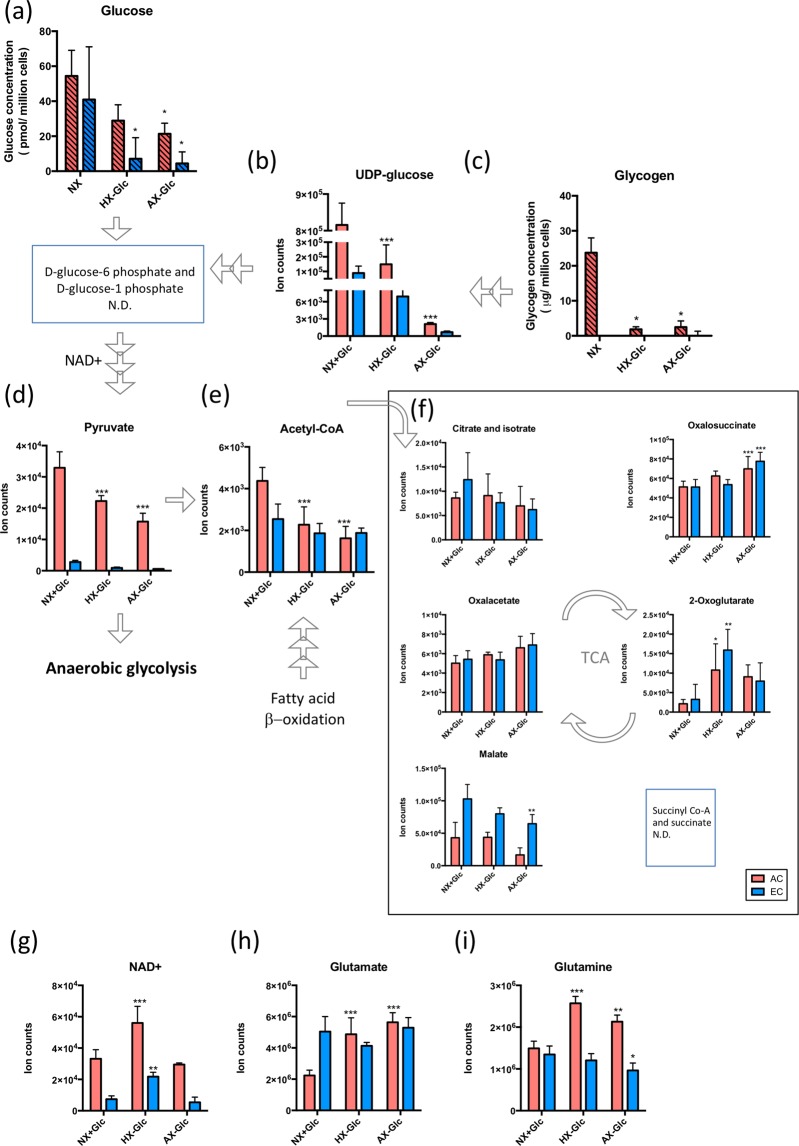
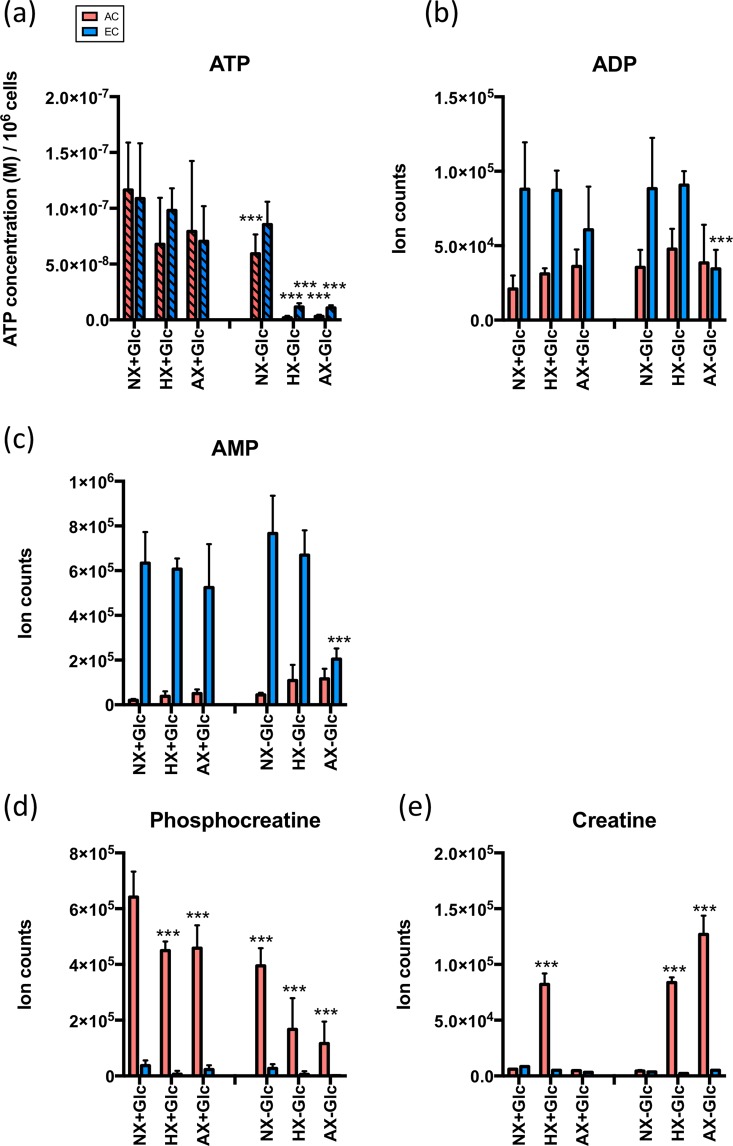
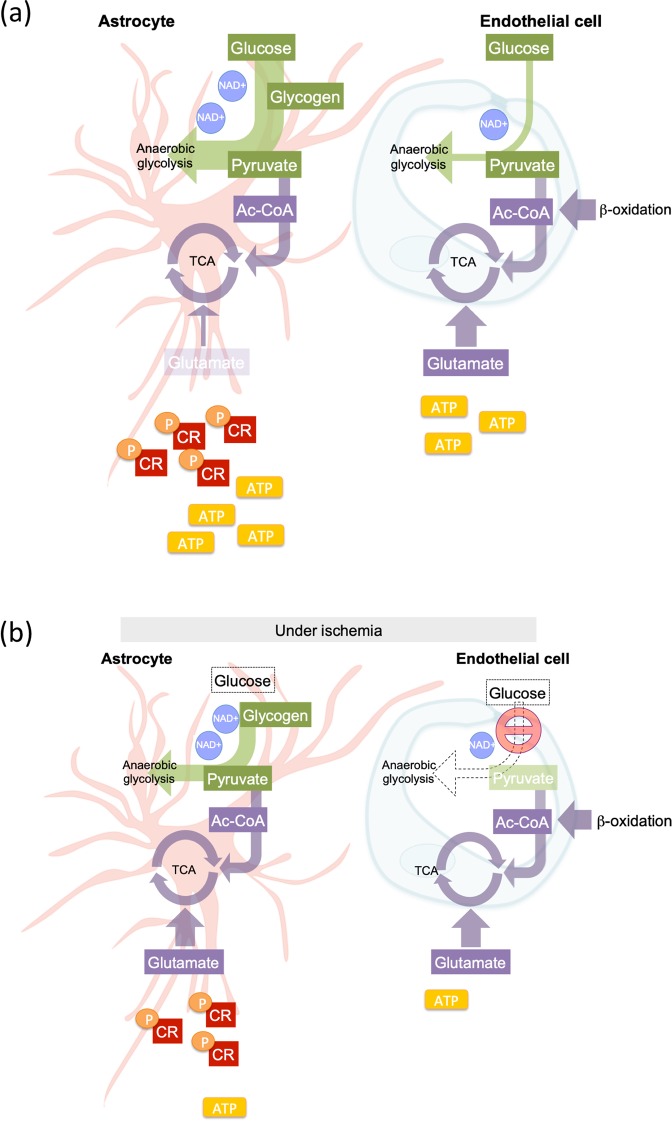
On one hand blood-brain barrier (BBB) disturbance aggravates disease progression, on the other it prevents drug access and impedes therapeutic efficacy. Effective ways to modulate barrier function and resolve these issues are sorely needed. Convinced that better understanding of cell-oriented BBB responses could provide valuable insight, and the fact that metabolic dysregulation is prominent in many vascular-related pathological processes associated with BBB disturbance, we hypothesized that differential cell-specific metabolic adaptation majorly influences physiological and pathological barrier functionality. Untargeted liquid chromatography-mass spectrometry (LC-MS) metabolomic profiling was used to obtain individual biochemical fingerprints of primary astrocytes (AC) and brain endothelial cells (EC) during normoxic conditions and increasing hypoxic/ischemic injury and thus a functional readout of cell status. Bioinformatic analyses showed each cell had a distinct metabolic signature. Corroborating their roles in BBB and CNS protection, AC showed an innate ability to dynamically alter their metabolome depending on the insult. Surprisingly, in complete contrast, EC largely maintained their normoxic characteristics in injury situations and their profiles diverged from those of non-brain origin. Tissue specificity/origin is clearly important when considering EC responses. Focusing on energy capacity and utilization we discuss how cell-specific metabolic adaptive capabilities could influence vascular stability and the possibility that altering metabolite levels may be an effective way to modulate brain EC function. Overall this work novel insight into cell-associated metabolic changes, and provides a powerful resource for understanding BBB changes during different injury scenarios.


Conflict of interest statement

The authors declare no competing interests.

Figures

Figure 1
Figure 1
Metabolome compositions differ strongly for both cell type and insult severity. (a) Principal component analysis of the metabolomes of AC (circles) and EC (squares) exposed to normoxia, hypoxia and near anoxia in presence and absence of glucose. Axes represent the first three principal components (PC) of the dataset and their contribution to overall metabolome variance in percent (%). (b) Correlation matrix plot of all AC and EC conditions. The Pearson correlation coefficients were calculated by log2 transformed ratios of the median values of fold changes and are represented by gradient colors as indicated in the color key. Correlations less than 0.6 are shown in gray. (c) Hierarchical clustering heatmap of different injury conditions in AC and EC samples. Metabolites significantly decreased are displayed in green and those significantly increased displayed in red. The brightness of each color corresponds to the magnitude of the difference when compared with average values. Normoxia (NX), hypoxia (HX) and near anoxia (AX) in presence and absence of glucose (±Glc). To enable comparison of data between the cell types, the metabolite intensities were normalized to total ion counts. n = 4.
Figure 2
Figure 2
Baseline metabolomic profiles: AC have prominent sugar metabolism whereas EC exhibit strong purine and amino acid metabolism. The relationship of metabolite abundance between AC and EC during baseline conditions (NX + Glc) using two different pathway analyses. (a) Overview of metabolites highly abundant in AC (red) and EC (blue) embedded in their metabolic pathways using MetaboAnalyst (v.4.0) and KEGG metabolic pathways tool. The size of the circles represents the fold change with dark and light colors depicting significant and non-significant differences respectively. Purple lines represent carbohydrate metabolism, red lines nucleotide metabolism, dark green lines lipid metabolism, orange: amino acid metabolism. n = 4. (b) Heatmap shows the major metabolic pathway activity in different cell types, AC (red) and EC (blue), relative to each other. The -Log10(P) value for each pathway was calculated using the MetaboAnalyst v.4.0 enrichment analysis tool. n = 4.
Figure 3
Figure 3
Energy capacity during normoxic conditions in AC and EC. Levels of metabolites that participate in glycogen synthesis; glucose (a), UDP-glucose (b) and glycogen (c). Histograms with hatched pattern show cellular glucose and glycogen levels detected by specific and independent quantitative biochemical analysis. The levels of pyruvate (d) and abundance of metabolites in TCA cycle (e, f). Levels of NAD + a co-factor of glycolysis (g) and glutamate (h), another carbon source of the TCA cycle. EC compared to AC under baseline conditions (NX + Glc). n = 4. *P < 0.05, **P < 0.01, ***P < 0.001; unpaired student’s t-test. N.D. not determined. Mean ± SD. n = 4.
Figure 4
Figure 4
Injury modulates the AC and EC metabolome differently. Venn diagrams show correlations of increased (a,d) and decreased (b,e) metabolites between AC and EC after 24 h hypoxic (HX + Glc) and anoxic (AX + Glc) stress conditions and during 24 h oxygen-glucose deprivation (HX-Glc) and (AX-Glc). (c,f) Heatmaps show comparison of differentially activated metabolic pathways (up and down regulated) after oxygen deprivation (c) and OGD (f) in AC (red) and EC (blue). Metabolites were considered increased or decreased based on the intensity fold change (upregulated pathways greater than 1.3 or downregulated pathways lower than −1.3) compared to NX + Glc. The –Log10(P) was calculated using the MetaboAnalyst v.4.0 enrichment analysis tool. n = 4.
Figure 5
Figure 5
Glycogenolysis and glycolysis support AC and EC energy generation differently. AC and EC levels of metabolites that participate in glycogen synthesis; glucose (a), UDP-glucose (b) and glycogen (c). Hatched histograms highlight metabolites detected by independent and specific quantitative biochemical analysis. The levels of pyruvate (d) and abundance of metabolites in TCA cycle (e,f). Levels of NAD + a co-factor of glycolysis (g), glutamate (h) and glutamine (i), other carbon sources of the TCA cycle. AC and EC were exposed to normoxia (NX), hypoxia (HX) and near anoxia (AX) without glucose (-Glc) for 24 h. All conditions compared to their own control conditions (NX + Glc). N = 4. *P < 0.05, **P < 0.01, ***P < 0.001; 1-way ANOVA. N.D. not determined. Data presented as mean ± SD of n = 4.
Figure 6
Figure 6
AC have a greater adaptive capacity to face environmental stress. Modulation of cellular ATP concentrations under different conditions. Abundance of ATP cycle-related metabolites, ADP (b) and AMP (c) under different conditions. d,e Amount of creatine (d) and phosphocreatine (e) under different conditions. AC and EC were exposed to normoxia (NX), hypoxia (HX) and near anoxia (AX) with or without glucose (±Glc) for 24 h. Data compared to baseline conditions (NX + Glc) in each cell type. The ATP data presented as mean ± SD of n = 3 (in EC) and n = 7 (in AC) independent experiments, and the LC-MS data showed as mean ± SD of n = 4 biological replicates. *P < 0.05, **P < 0.01, ***P < 0.001; 1-way ANOVA.
Figure 7
Figure 7
Schematic overview of energy generation by AC and EC. We propose the following cellular models of energy generation; (a) Under normoxic/resting conditions, AC predominantly use glucose to support glycogenesis and anaerobic glycolysis (green) as well as the TCA cycle (purple) via pyruvate synthesis. Brain EC sparingly utilize glucose directly to support glycolysis, but glutamate and/or β-oxidation likely contribute to EC TCA cycle to maintain the central carbohydrate metabolism. (b) During injury conditions, elevated glycogen and pyruvate reserves, pCR as well as excellent antioxidant capacity in AC demonstrate a high metabolic flexibility. Comparatively EC are more metabolically rigid, attempting to sustain their resting/baseline profile at almost all cost. Arrow thickness represents the degree of pathway activity. The number of repeated circles (NAD + ) and rectangles (ATP and CR) indicate the metabolite level. Metabolite abundance is indicated by rectangle transparency with dark and light depicting high and low levels respectively under different conditions. The dotted arrow indicates inactivated pathways.

References

    1. Engelhardt S, Patkar S, Ogunshola OO. Cell-specific blood-brain barrier regulation in health and disease: A focus on hypoxia. Br. J. Pharmacol. 2014;171:1210–1230. doi: 10.1111/bph.12489. - DOI - PMC - PubMed
    1. Delaney, C. & Campbell, M. The blood brain barrier: Insights from development and ageing. Tissue Barriers5, (2017). - PMC - PubMed
    1. Abbott NJ, Patabendige AAK, Dolman DEM, Yusof SR, Begley DJ. Structure and function of the blood–brain barrier. Neurobiol. Dis. 2010;37:13–25. doi: 10.1016/j.nbd.2009.07.030. - DOI - PubMed
    1. Zhao Y, et al. Metabolomic Heterogeneity of Pulmonary Arterial Hypertension. PLoS One. 2014;9:e88727. doi: 10.1371/journal.pone.0088727. - DOI - PMC - PubMed
    1. Mayr M, Madhu B, Xu Q. Proteomics and Metabolomics Combined in Cardiovascular Research. Trends Cardiovasc. Med. 2007;17:43–48. doi: 10.1016/j.tcm.2006.11.004. - DOI - PubMed

Publication types

MeSH terms