

Comment
doi: 10.1002/oby.22881.
A Primer on COVID-19 Mathematical Models
Affiliations
- PMID: 32386464
- PMCID: PMC7273051
- DOI: 10.1002/oby.22881
Item in Clipboard
Comment
A Primer on COVID-19 Mathematical Models
Obesity (Silver Spring).
2020 Aug.
No abstract available
Figures
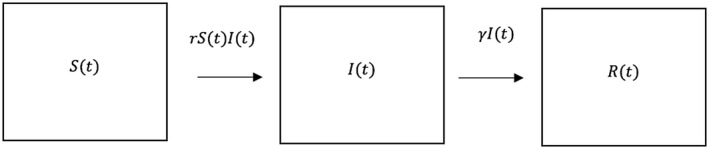
Transition from the three possible states, susceptible
infected,
, and removed
The proportion of interactions between individuals in
and
that lead to infection per unit time is
, and the proportion of infected individuals that recover with immunity or die from disease per unit time is
. The total number of individuals within the system remains constant throughout calculation.
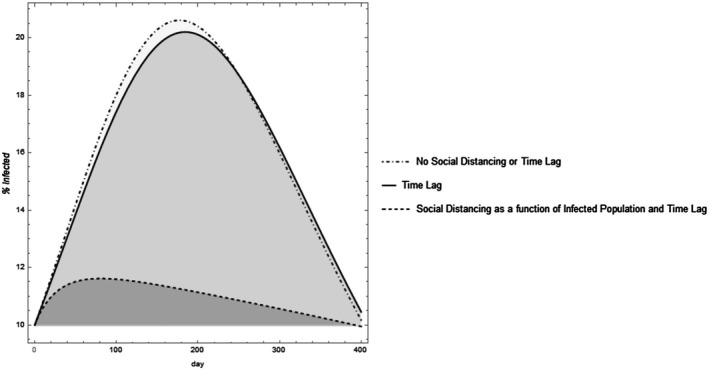
Varying assumptions can alter the dynamic projection model outcomes. Assuming there is a time lag shifts the curve. Including social distancing that increases with increased infective populations and decreases with declining infected populations “flattens the curve” and results in an asymmetric projection. The parameter values were set with total population set as 1,000 individuals,
. For the time lag model, the time lag for infection was set at
days and the time lag to mortality at 3 days. For the model where
is represented by the Hill function,
and
.
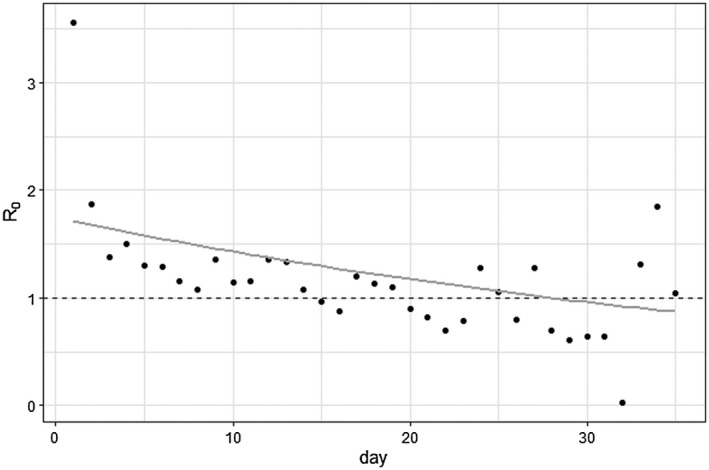
The effective reproduction number
, sometimes referred to as
or “R naught,” for New York fit to data with an exponential curve.
represents the average number of secondary cases because of one infected person at the beginning of the epidemic, and in order for the epidemic to decline,
should be less than 1. The points are the calculated daily effective reproduction number calculated by number of observed cases divided by the number of expected cases on a given day, while the gray curve forecasts future effective reproduction numbers that can be used in dynamic projection SIR models. Here,
went below 1 (represented by the dashed line) around 28 days.
Comment on
-
Predictive Mathematical Models of the COVID-19 Pandemic: Underlying Principles and Value of Projections.JAMA. 2020 May 19;323(19):1893-1894. doi: 10.1001/jama.2020.6585. JAMA. 2020. PMID: 32297897 No abstract available.
References
-
- Lai CC, Shih TP, Ko WC, Tang HJ, Hsueh PR. Severe acute respiratory syndrome coronavirus 2 (SARS‐CoV‐2) and coronavirus disease‐2019 (COVID‐ 19): The epidemic and the challenges. Int J Antimicrob Agents 2020;55:105924. doi:10.1016/j.ijantimicag.2020.105924 - DOI - PMC - PubMed
-
- Bui Q, Katz J, Parlapiano A, Sanger‐Katz M. What 5 coronavirus models say the next month will look like. New York Times. April 20, 2020.
-
- Jewell NP, Lewnard JA, Jewell BL. Predictive mathematical models of the COVID‐19 pandemic: underlying principles and value of projections [published online April 16, 2020]. JAMA. doi:10.1001/jama.2020.6585 - DOI - PubMed
Publication types
MeSH terms
LinkOut - more resources
Full Text Sources
