. 2020 May 7;78(3):477-492.e8.
doi: 10.1016/j.molcel.2020.04.008.

Single-Cell Analyses Reveal Megakaryocyte-Biased Hematopoiesis in Myelofibrosis and Identify Mutant Clone-Specific Targets

Affiliations

Single-Cell Analyses Reveal Megakaryocyte-Biased Hematopoiesis in Myelofibrosis and Identify Mutant Clone-Specific Targets

Bethan Psaila et al. Mol Cell. .

Abstract

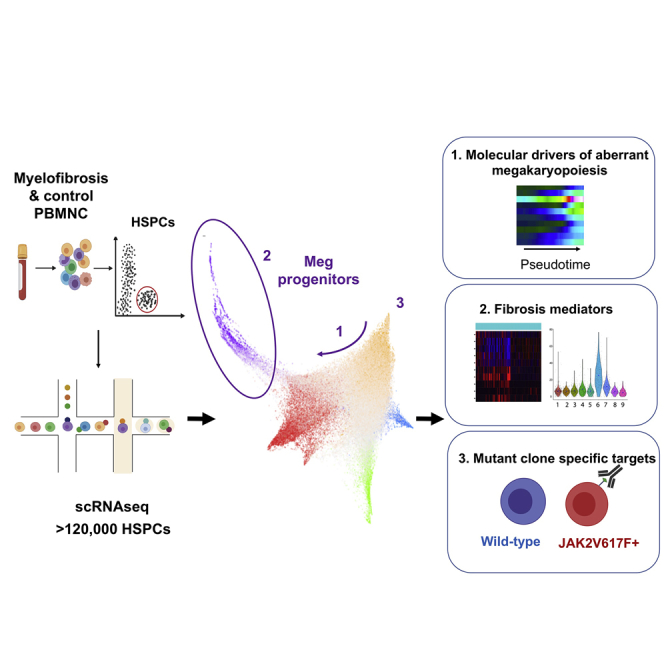
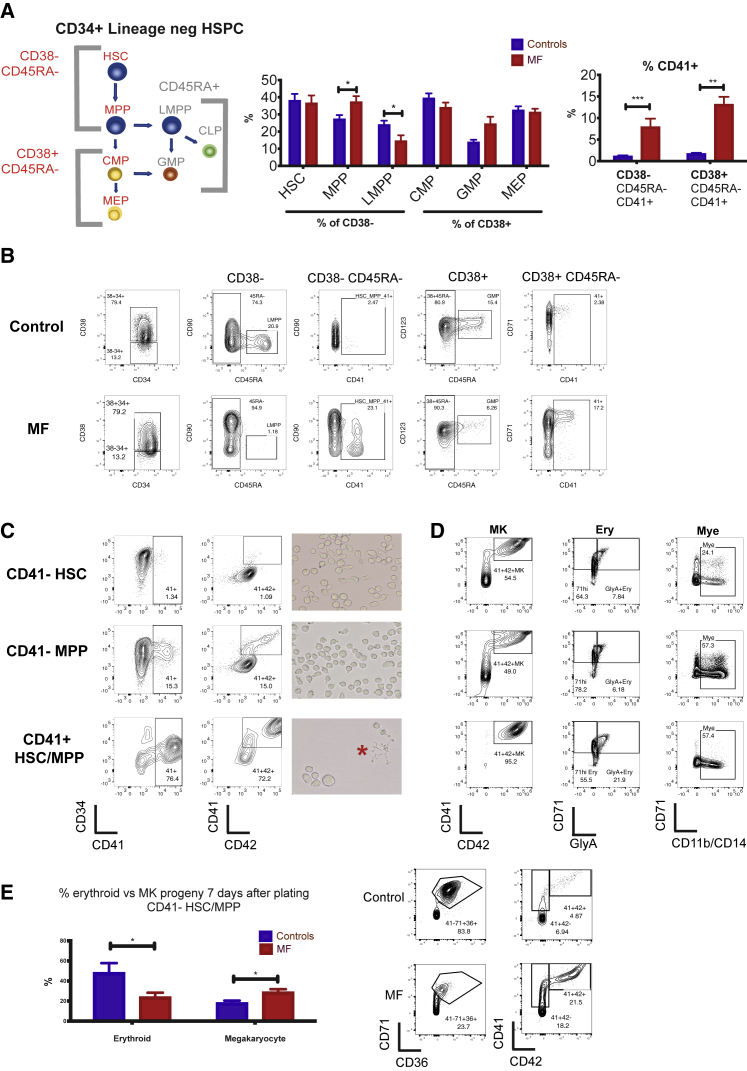
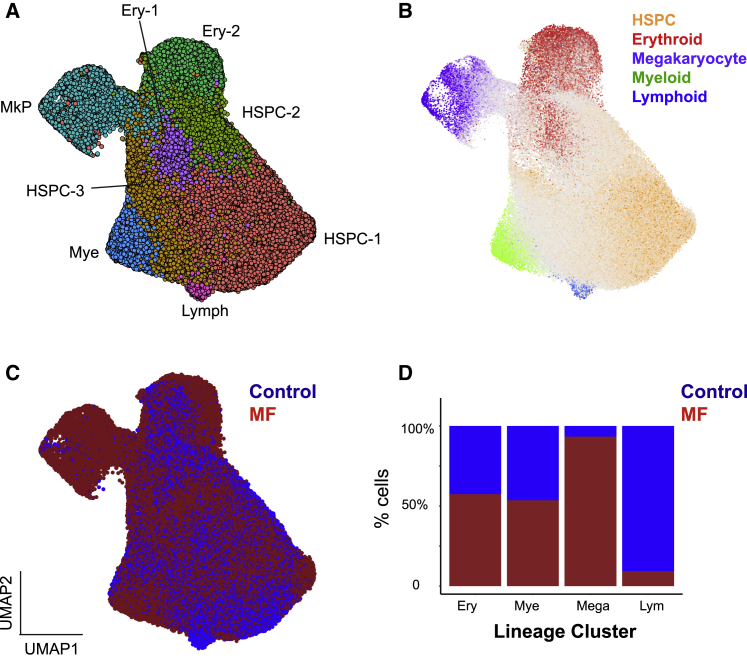
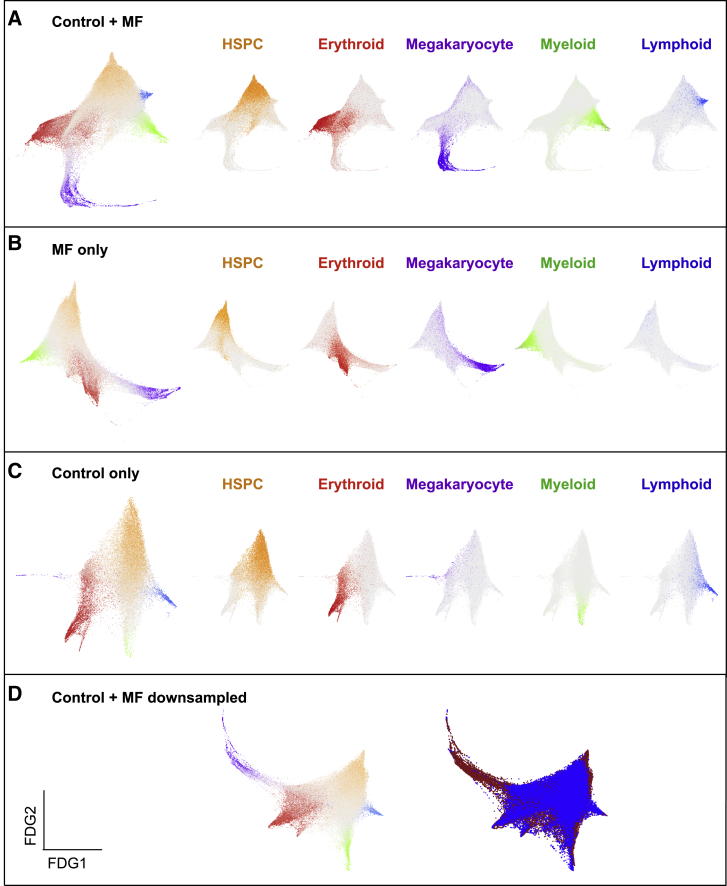
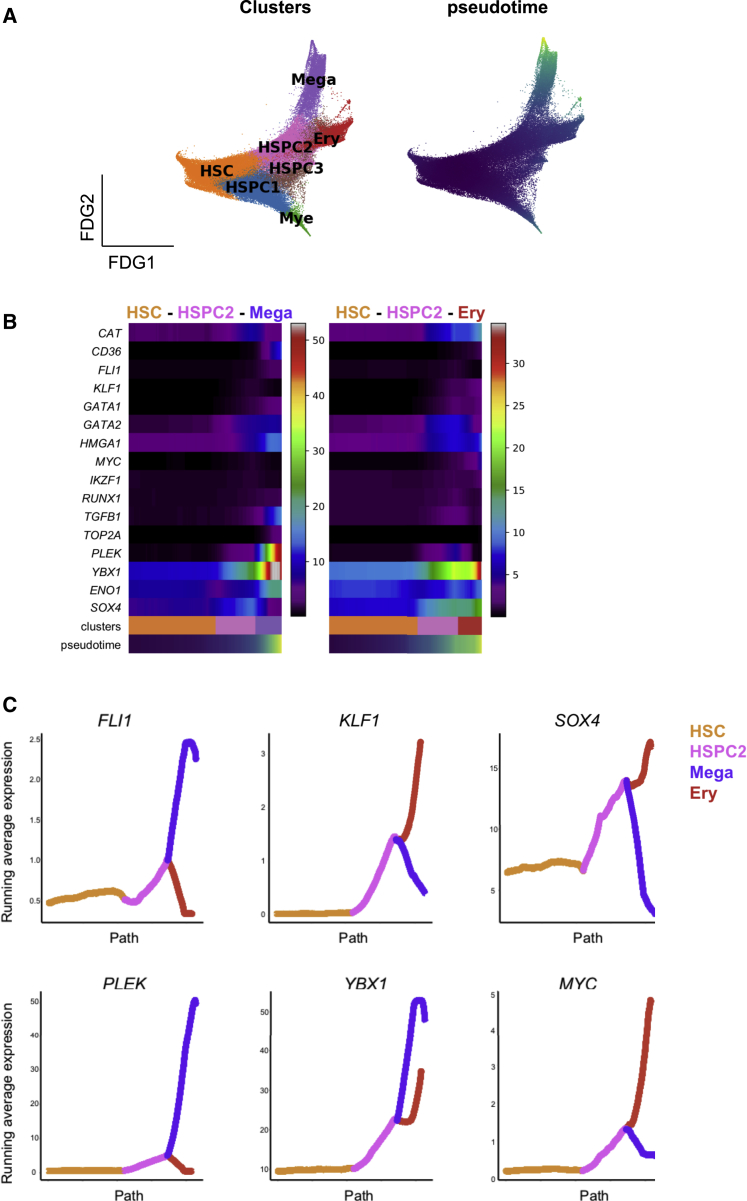
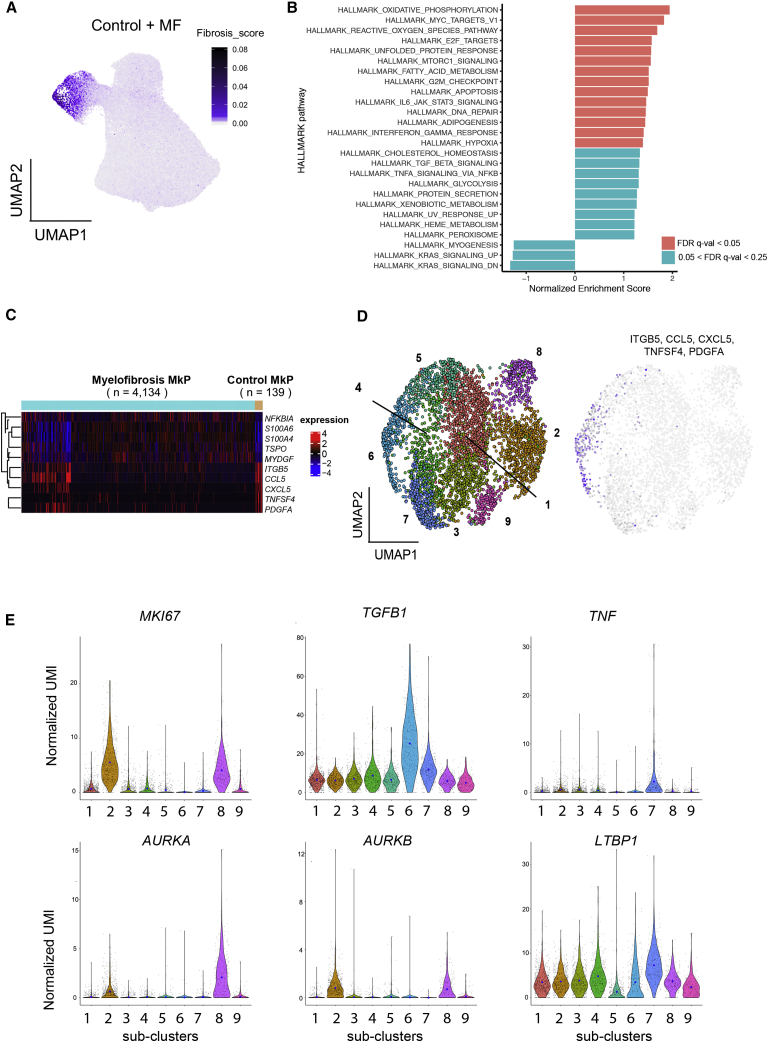
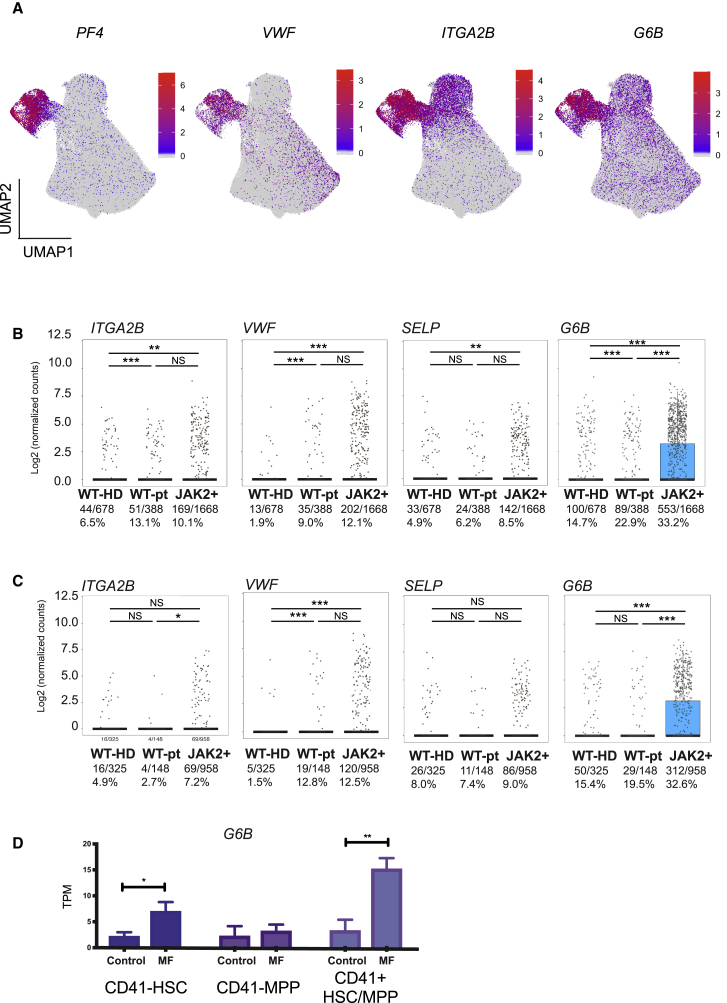
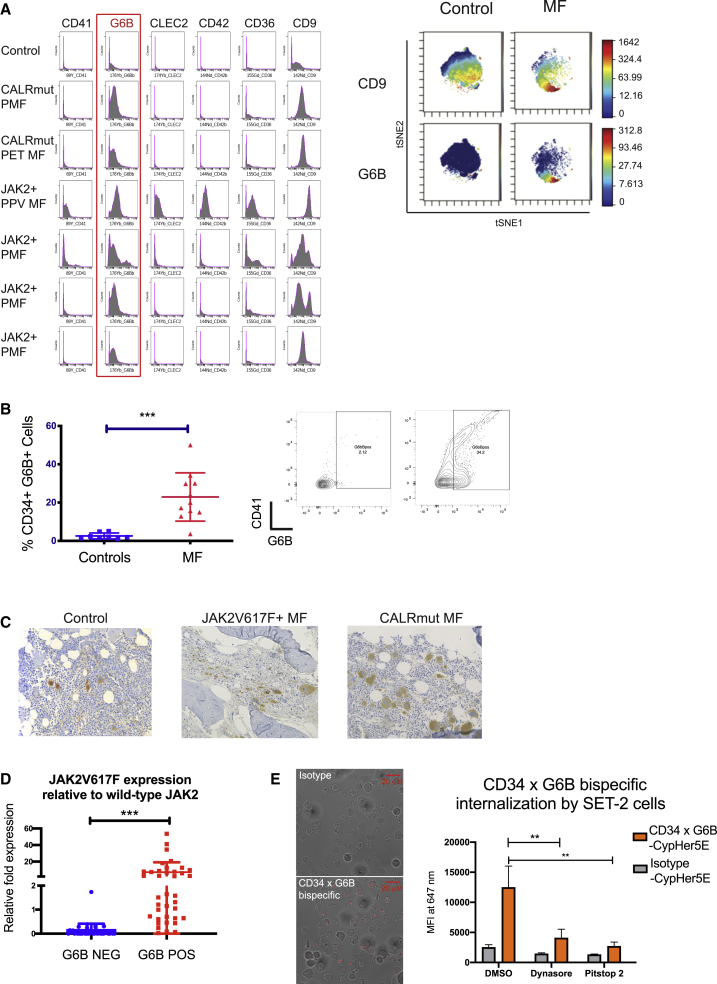
Myelofibrosis is a severe myeloproliferative neoplasm characterized by increased numbers of abnormal bone marrow megakaryocytes that induce fibrosis, destroying the hematopoietic microenvironment. To determine the cellular and molecular basis for aberrant megakaryopoiesis in myelofibrosis, we performed single-cell transcriptome profiling of 135,929 CD34+ lineage- hematopoietic stem and progenitor cells (HSPCs), single-cell proteomics, genomics, and functional assays. We identified a bias toward megakaryocyte differentiation apparent from early multipotent stem cells in myelofibrosis and associated aberrant molecular signatures. A sub-fraction of myelofibrosis megakaryocyte progenitors (MkPs) are transcriptionally similar to healthy-donor MkPs, but the majority are disease specific, with distinct populations expressing fibrosis- and proliferation-associated genes. Mutant-clone HSPCs have increased expression of megakaryocyte-associated genes compared to wild-type HSPCs, and we provide early validation of G6B as a potential immunotherapy target. Our study paves the way for selective targeting of the myelofibrosis clone and illustrates the power of single-cell multi-omics to discover tumor-specific therapeutic targets and mediators of tissue fibrosis.

Keywords: G6B; TARGET-seq; bone marrow; fibrosis; immunotherapy; megakaryopoiesis; myeloproliferative neoplasm; platelets; single-cell multi-omics.


Conflict of interest statement

Declaration of Interests The authors declare no relevant competing interests.

Figures

None
Graphical abstract
Figure 1
Figure 1
Multipotent Myelofibrosis Hematopoietic Stem and Progenitor Cells (HSPCs) Are Biased for Megakaryocyte Differentiation (A) Left: model of classically defined CD34+ lin HSPC subpopulations, in which multi-potent cells (HSCs, hematopoietic stem cells; MPPs, multi-potent progenitor cells; LMPPs, lymphoid-primed multi-potent progenitors) are CD38 and down-stream progenitors (CMPs, common myeloid progenitors; MEPs, megakaryocyte-erythroid progenitors; GMPs, granulocyte-monocyte progenitors) are CD38+. CD45RA+ populations (LMPP/GMP) do not have erythroid or megakaryocyte potential. Middle: % of each classically defined HSPC population in the CD34+ lin compartment, demonstrating increased MPPs and reduced LMPPs in myelofibrosis (MF) compared to controls. Right: % cells expressing CD41, a surface antigen previously shown to identify cells with increased potential for megakaryocyte differentiation, is increased in both CD38 CD45RA (HSC/MPP) and CD38+ CD45RA (CMP/MEP) compartments in myelofibrosis (MF patients, N = 23; controls, N = 14, see also Table S1). (B) Representative FACS plot of a healthy donor control and myelofibrosis patient showing gating strategies. (C) Left: FACS analysis of CD41 HSC (top), CD41 MPP (middle), and CD41+ HSC/MPP (bottom) from healthy donors cultured in megakaryocyte differentiation media (with added recombinant human TPO and stem cell factor [SCF]). CD41+ HSC/MPP demonstrate increased potential for megakaryocyte differentiation, with faster acquisition of the mature megakaryocyte antigen CD42 at an early time point (day 6). Right: images of cultures showing enlarged cell size and proplatelet formation (red star) indicative of accelerated megakaryocyte differentiation from CD41+ HSC/MPP. Representative examples of 3 replicate experiments shown. (D) FACS analysis of CD41 HSC, CD41 MPP and CD41+ HSC/MPP from healthy donors cultured for 12–14 days in megakaryocyte (MK), erythroid (Ery), or myeloid (Mye) differentiation media. CD41+ HSC/MPP showed a higher % of mature CD41+42+ megakaryocytes and glycophorin A+ CD71+ erythroblasts and equivalent CD11b/CD14+ myeloid cells versus CD41 fractions. Representative examples of 3 replicate experiments shown. % of total live (7AAD-), single cells shown. (E) Summary chart (left) and representative FACS plots (right) showing percentage of myelofibrosis and control CD41 HSC/MPP cultured in “bi-potent” erythroid and megakaryocyte differentiation media that give rise to megakaryocyte versus erythroid progeny 6 days after plating (gated on live cells). (controls, n = 7; myelofibrosis [MF], n = 8). Charts show mean + SEM,∗∗∗p < 0.001; ∗∗p ≤ 0.01; p < 0.05). See also Figure S1.
Figure 2
Figure 2
High-Throughput Single-Cell RNA Sequencing of 120,196 CD34+ lin HSPCs from 21 Donors Reveals Marked Expansion of Megakaryocyte Progenitors (MkPs) in Myelofibrosis (A) Dimensionality reduction using UMAP of an aggregate of all control (n = 37,941) and myelofibrosis (n = 82,255) cells identified 8 distinct clusters. Cells were partitioned using the Louvain community-detection clustering method and annotated according to expression of lineage signature genes for hematopoietic cell types (see also Table S4). Abbreviations: Ery - erythroid; Mye - myeloid; Lymph -lymphoid progenitor. (B) Expression of lineage signature gene sets were superimposed on the UMAP (gray, uncommitted or expression of >1 lineage gene set; see also Table S5). (C) Cells were colored according to the donor type (healthy donors, blue; myelofibrosis, red). (D) Myelofibrosis cells were down-sampled to match the number of control cells (37,941 cells). Bar chart shows the % of cells within each annotated lineage progenitor cluster deriving from each donor type. N = 15 for myelofibrosis patients (3 mutCALR+ and 12 JAK2V617F+) and N = 6 for age-matched controls. See also Figure S1F and Tables S2 and S3.
Figure 3
Figure 3
A Distinct Trajectory for Megakaryocyte Differentiation Is Dramatically Expanded in Myelofibrosis (A–D) Force-directed graphs (FDGs) for aggregate of all control + myelofibrosis cells (A), myelofibrosis only (B), control only (C), and control + down-sampled myelofibrosis dataset (D). In (D), the left graph shows lineage signature gene score and in the right graph cells are colored according to the donor type (healthy donors, blue; myelofibrosis, red). Gene expression trajectories are visualized by superimposing the expression scores of lineage signature gene sets on FDG. Grey cells represent uncommitted HSPCs or cells with expression of more than 1 lineage signature. See also Figures S2 and S3 and Table S5.
Figure 4
Figure 4
Molecular Regulators That May Drive Aberrant Megakaryocyte Differentiation in Myelofibrosis (A) Left: FDG generated using Scanpy of all myelofibrosis CD34+ lin cells, showing unsupervised clusters based on Louvain community-detection method. Right: pseudotime for the differentiation path from HSCs superimposed on the FDG plot. (B) Expression of selected transcription factor genes over pseudotime from HSC → HSPC2 → megakaryocyte and HSC → HSPC2 → Ery differentiation paths. (C) Expression of 6 genes that are differentially expressed between the erythroid and megakaryocyte trajectories over pseudotime.
Figure 5
Figure 5
Myelofibrosis MkPs Strongly Express Mediators of Tissue Fibrosis (A) Expression of a 14-gene “fibrosis score” (Table S5) derived from previously published datasets examining bone marrow, liver, and lung fibrosis superimposed on the UMAP of all HSPCs identifies cells in the MkP cluster as the strongest expressers of mediators of tissue fibrosis. (B) HALLMARK pathways from gene set enrichment analysis (GSEA) of all genes pre-ranked according to differential expression in myelofibrosis versus healthy donor MkP. Pathways with a false discovery rate (FDR) q-value of <0.25 are shown. (C) Heatmap showing 10 selected genes differentially expressed between myelofibrosis and control MkP. (D) Left: 9 distinct clusters of myelofibrosis MkP shown on UMAP. Right: expression of signature genes detected in healthy donor MkP and shown in (C) (ITGB5, CCL5, CXCL5, TNFSF4, and PDGFA) shown on UMAP of myelofibrosis MkP indicates that sub-cluster 6 is transcriptionally similar to control MkP. (E) Heterogenous expression of markers of proliferation (MKI67), fibrosis (TGFB1 and LTBP1), inflammation (TNF), and treatment targets (AURKA and AURKB) among myelofibrosis MkP sub-clusters. Blue dots on violin plot indicate mean level of expression. See also Figures S4 and S5.
Figure 6
Figure 6
Increased Expression of Megakaryocyte-Associated Genes in Myelofibrosis Is Not Restricted to the MF-MkP Cluster but Is Substantially Higher in Cells Derived from the JAK2V617F+ Mutant Clone (A) Expression of intracellular (PF4 and VWF) and cell surface (ITGA2B [CD41] and G6B) megakaryocyte genes is not limited to myelofibrosis MkPs, particularly for G6B. (B and C) Simultaneous targeted mutational profiling and RNA sequencing (TARGET-seq) of 2,734 individual CD34+ Lin HSPCs (B) and CD38-negative stem cells (C) identified by index sorting data show higher expression of megakaryocyte-associated genes ITGA2B (CD41), VWF, SELP, and G6B in JAK2V617F-mutated (JAK2+) versus wild-type cells from the same patients (WT-pt) or age-matched healthy donor control HSPCs (WT-HD). Fraction and % of cells in which gene expression were detected and are shown. The combined p value for Fisher’s exact test and Wilcoxon rank-sum test is shown (p < 0.05, ∗∗p ≤ 0.01, ∗∗∗p ≤ 0.001). Points represent expression values for each single cell, and boxes represent median and quartiles for each group. (D) G6B expression in bulk-sorted control and myelofibrosis immunophenotypic HSC (CD34+ lin CD38CD45RACD90+), MPP (CD34+ lin CD38CD45RACD90), and CD41+ HSC/MPP (CD34+ lin CD38-CD45RA CD41+).TPM, transcripts per million. Chart shows mean ± SEM, n = 4 for controls and n = 3 for myelofibrosis; p < 0.05; ∗∗p ≤ 0.01. See also Figure S6.
Figure 7
Figure 7
Expression of Cell Surface G6B, a Cell Surface Protein, Identifies Mutant Clone-Derived HSPCs in Myelofibrosis (A) Left: expression of 6 megakaryocyte markers from a panel of 20 HSPC and megakaryocyte cell surface antigens assayed by mass spectrometry time of flight (CyTOF) shows expression of G6B on CD34+ HSPCs from patients with primary myelofibrosis (PMF), post-essential thrombocythemia myelofibrosis (PET-MF), and post-polycythaemia vera myelofibrosis (PPV-MF) with either JAK2V617F (JAK2+) or calreticulin (mutCALR) driver mutations. Histograms show cell count (y axis) by expression level (x axis). Right: viSNE dimensionality reduction plots on a representative control and myelofibrosis sample for CD9 and G6B, illustrating more substantial differential expression of G6B than CD9 in myelofibrosis versus control cells (B) Flow cytometric analysis of G6B expression on CD34+ Lin HSPCs showing significant increase in G6B+ cells in myelofibrosis (% GFP+ cells, 28.8% ± 5.5% versus 2.4% ± 1.0%); chart shows mean + SEM (left) and example plot (right) shown, illustrating expression in both CD41+ and negative cells. ∗∗p ≤ 0.01 (t test). Controls (N = 8); myelofibrosis (N = 11). (C) Immunohistochemical staining for G6B (diaminobenzidine, DAB brown) of bone marrow biopsy sections from controls and myelofibrosis patients with JAK2V617F and mutCALR-positive myelofibrosis showing marked expansion of G6B+ megakaryocytes and progenitors in myelofibrosis. (D) Mononuclear cells from healthy donors and patients with JAK2V617F+ myelofibrosis were combined and 50 cell “mini-bulk” replicates were sorted from the G6B+ and G6B− fractions for Taqman qRT-PCR to quantify expression of JAK2V617F mutated and wild-type JAK2. Chart shows JAK2V617F relative to wild-type JAK2 expression for all mini-bulks from 3 replicate experiments. (E) Internalization of a CD34 × G6B bi-specific antibody and isotype control antibody conjugated to a pH-sensitive cyanine CypHer5E dye that fluoresces at an acidic pH following internalization. Left: representative images show clear intracellular fluorescence for CD34 × G6B bi-specific but not isotype control. Right: mean fluorescence intensity of cells measured by flow cytometry 30 min after addition of antibody with/without two endocytosis inhibitors, Dynasore and Pitstop 2. Data shown using SET-2 cells, chart shows mean + SEM, ** - P < 0.01 n= 3. See also Figure S7.

References

    1. Adolfsson J., Månsson R., Buza-Vidas N., Hultquist A., Liuba K., Jensen C.T., Bryder D., Yang L., Borge O.J., Thoren L.A. Identification of Flt3+ lympho-myeloid stem cells lacking erythro-megakaryocytic potential a revised road map for adult blood lineage commitment. Cell. 2005;121:295–306. - PubMed
    1. Aibar S., González-Blas C.B., Moerman T., Huynh-Thu V.A., Imrichova H., Hulselmans G., Rambow F., Marine J.C., Geurts P., Aerts J. SCENIC: single-cell regulatory network inference and clustering. Nat. Methods. 2017;14:1083–1086. - PMC - PubMed
    1. Akashi K., Traver D., Miyamoto T., Weissman I.L. A clonogenic common myeloid progenitor that gives rise to all myeloid lineages. Nature. 2000;404:193–197. - PubMed
    1. Allen R.J., Porte J., Braybrooke R., Flores C., Fingerlin T.E., Oldham J.M., Guillen-Guio B., Ma S.F., Okamoto T., John A.E. Genetic variants associated with susceptibility to idiopathic pulmonary fibrosis in people of European ancestry: a genome-wide association study. Lancet Respir. Med. 2017;5:869–880. - PMC - PubMed
    1. Arber D.A., Orazi A., Hasserjian R., Thiele J., Borowitz M.J., Le Beau M.M., Bloomfield C.D., Cazzola M., Vardiman J.W. The 2016 revision to the World Health Organization classification of myeloid neoplasms and acute leukemia. Blood. 2016;127:2391–2405. - PubMed

Publication types

Substances