. 2020 May 14;181(4):936-953.e20.
doi: 10.1016/j.cell.2020.04.007. Epub 2020 May 7.

The Allen Mouse Brain Common Coordinate Framework: A 3D Reference Atlas

Affiliations

The Allen Mouse Brain Common Coordinate Framework: A 3D Reference Atlas

Quanxin Wang et al. Cell. .

Abstract

Recent large-scale collaborations are generating major surveys of cell types and connections in the mouse brain, collecting large amounts of data across modalities, spatial scales, and brain areas. Successful integration of these data requires a standard 3D reference atlas. Here, we present the Allen Mouse Brain Common Coordinate Framework (CCFv3) as such a resource. We constructed an average template brain at 10 μm voxel resolution by interpolating high resolution in-plane serial two-photon tomography images with 100 μm z-sampling from 1,675 young adult C57BL/6J mice. Then, using multimodal reference data, we parcellated the entire brain directly in 3D, labeling every voxel with a brain structure spanning 43 isocortical areas and their layers, 329 subcortical gray matter structures, 81 fiber tracts, and 8 ventricular structures. CCFv3 can be used to analyze, visualize, and integrate multimodal and multiscale datasets in 3D and is openly accessible (https://atlas.brain-map.org/).

Keywords: 3D brain atlas; CCFv3; average mouse brain; brain anatomy; brain parcellation; common coordinate framework; fiber tracts; mouse cortex; reference atlas; transgenic mice.


Conflict of interest statement

Declaration of Interests D.F. is an employee Tableau Software. B.B. is an employee of 343 Industries. A.S. is an employee of Microsoft Corporation. S.W.O. is an employee of MDimune (Korea).

Figures
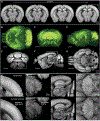
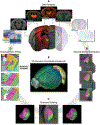
Figure 1.
Figure 1.. The 3D average mouse brain template.
(A) Evolution of the average template in a coronal plane in the building process. From left to right are the results from the 1st, 3rd, 5th, and 7th iteration respectively. (B–D) Volume rendering (max intensity projection) of the average template in horizontal, coronal, and sagittal views. Dotted red lines show the position of the virtual section views below in E–G. (E–G) One virtual section of the average template volume in 3 planes. (H–K) Zoom-in views of the boxed areas area in A, E–G respectively. Top panels are examples from a single STPT imaged specimen. Bottom panels show the average template. Many anatomical features are more salient in the average template than in any individual specimen. Scale bars: 1 mm in A–G, 0.4 mm in H, 0.3 mm in I, 0.8 mm in J and 0.6 mm in K.
Figure 2.
Figure 2.. Annotation workflow for building 3D structures.
(A) For every brain structure, anatomists started by reviewing relevant data from multiple sources (see Table S3). Structures visible in the average template were drawn first. Dashed arrow indicates that the ISH data from the Allen Brain Atlas were consulted side by side with the template, unlike the other datasets which were registered and could be viewed as direct overlays of the average template for annotation. (B) Using a curated set of reference data, neuroanatomists labeled voxels that they determined belonged to each brain structure in coronal, sagittal and horizontal plates at regularly spaced intervals, according to the size of the structure, directly on the average template using ITK-SNAP. Two neighboring structures are shown in magenta and green. (C) At the end of step (B), a 3D “weave” was produced (right) which was not yet smooth or filled in across all planes (sagittal view, middle). Structures were completed in 3D by skilled illustrators to produce a smooth final 3D volume (left). (D) As more individual structures were completed, the next step was to “fit” them together, so as not to have unlabeled voxels (“gaps”) or voxels with multiple labels (“overlaps”). This was done by manual proof-reading. It was sometimes necessary to go back and review reference datasets to resolve discrepancies. (E) The voxel labels were finalized in one hemisphere and flipped to generate the symmetric CCFv3.
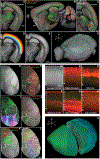
Figure 3.
Figure 3.. Delineating the isocortex.
(A–C) The isocortex was defined in part by overlaying registered STPT images from the transgenic lines Calb1-T2A-dgCre (red) and Fezf2-CreER (false-colored green). (D) Equidistance fields solved with Laplace’s equation are shown in jet colormap. (E) Subsampled and randomly colored streamlines descend from the cortical surface to layer 6 in a single coronal section. (F) A 3D projection shows the curved cortical streamlines in a dorsolateral view. (G) A (top) cortical surface view of the average template constructed using the maximum intensity projection of voxels along the streamlines to the surface. (H) Top surface view showing reporter expression from transgenic lines Rorb-IRES2-Cre (red) and Chrna2-Cre_OE25 (false-colored green) overlaid on the average template. These lines reveal the shape and size of primary sensory and retrosplenial areas, marked with solid white lines. (I) Higher visual areas were delineated by overlaying visuotopic projection maps (colors cyan, pink and blue representing nasal, temporal and lower visual fields, respectively) and virtual callosal labeling (green) to the average template. (J) Transgenic line data (Slc17a8-IRES-Cre, red) and cortical projections from the thalamic nucleus AM (green) assisted delineation of RSPagl. (K) Transgenic line data (Grp-Cre_KH288, red) and cortical projections from the thalamic nucleus VAL (green) assisted delineation of MOp and MOs. (L) 31 isocortical areas are visible and were delineated in the top surface view. Solid white lines represent areal borders. (M) Contrast features inherent to the average template were useful for identifying individual cortical layers. A single coronal plane is shown at the level of SSp-bfd. (N–R) STPT images of Ai14 reporter expression in layer-selective transgenic mouse lines; Calb1-T2A-dgCre for L2/3, Nr5a1-Cre for L4, Rbp4-Cre_KL100 for L5, Ntsr1-Cre_GN220 for L6a, and Ctgf-2A-dgCre for L6b. (S) Dorsolateral 3D view of the parcellated isocortex intersected with the cortical layers (white solid lines in cut-away). Structure abbreviations in Table S2. A, anterior; P, posterior; M, medial; L, lateral; D, dorsal; V, ventral. Scale bars: 1 mm in A–E and G–L, 200 μm in M–R.
Figure 4.
Figure 4.. Delineating a subcortical gray matter structure, the interpeduncular nucleus (IPN).
(A) A parasagittal view of the whole parcellated CCFv3 shows the location of IPN in the midbrain. Visible major divisions are labeled. (B) The final smooth 3D volume shows eight IPN subdivisions (R: rostral, C: caudal, A: apical, L: lateral, I: intermediate, DM: dorsomedial, DL: dorsolateral, RL: rostrolateral). (C) Coronal section image from a Nissl-stained brain at the approximate center of the IPN. Nissl reveals putative IPN subdivisions as regions containing neurons of different sizes and densities. (D–F) Coronal section images of the IPN from three brains immunohistochemically stained with a pair of antibodies as indicated. (D) Antibody labeling for calbindin D28K (Calb1, green) reveals very dense terminal fibers in IPL. Myelin basic protein is labeled with the SMI-99 antibody (red). There are relatively more myelinated axons visible in IPC and IPI, compared to the other subdivisions. (E) Antibody labeling for parvalbumin (Pvalb, green) shows spatial restriction of Pvalb+ neurons to putative IPL and IPR (not shown). Neurofilament-H is labeled with the SMI-32 antibody (red) and is notably strongest in IPL. (F) Antibody labeling for NeuN (in red) also reveals sub-regional differences in neuronal densities; dense nuclei in IPA, IPDM, and IPR (not shown), moderate in IPC and IPL, sparse in IPI and IPDL. (G–H) Coronal STPT images of tdTomato reporter expression in two Cre driver transgenic lines. Slc7a8-iCre (G) is expressed at high levels in putative IPL and IPC. Kcng4-Cre (H) is similarly expressed at high levels in IPL. (I–J) Coronal STPT images of axonal projections labeled following tracer injections into afferent source areas to the IPN. (I) Projections from the superior central nucleus of the raphe (CS) terminate most densely in IPC and IPI. (J) Projections from the medial habenula (MH) to the IPN terminate with high density in putative IPL and moderate density in IPA, IPDL and IPDM. (K–M) Virtual single plane sections (coronal, sagittal, horizontal) of the average template through the IPN. Differential contrast features also reveal many putative IPN subdivisions. White matter and cell sparse regions appear dark and the gray matter bright. IPC is visible in all panels as a very bright region ventral to IPA and IPR, and just dorsal to the pontine gray (PG). IPR is also visible as a bright distinctive shape anterior to IPA (see sagittal section in L). IPA is clearly separated from IPC by a darker, cell sparse, region (* in L). IPL is also a relatively brighter shape, located lateral to IPI (K,M) and ventral to IPDL (K). IPI is a thin bright strip between IPC and IPL, separated from these two subdivisions via darker regions (* in K and M). IPDM (seen in K, L) is dorsal and medial to IPDL, dorsal and lateral to IPA and posterior to IPR. IPDL (seen in K, M) is also lateral to IPA and IPR and above IPI and IPC. (N–P) Coronal STPT image series from the transgenic Cre line experiments in G and H registered to and overlaid on the average template provided critical assistance in border delineations in virtual slicing planes. (Q–S) Coronal STPT image series from the two anterograde tracer datasets registered to and visualized in the average template volume. (T–V) Integrating the information from the above multimodal reference data, the IPN was divided into eight sub-regions, shown here in coronal, sagittal and horizontal planes. Structure abbreviations in Table S2. Scale Bar: 200 μm from C–V.
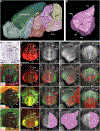
Figure 5.
Figure 5.. Delineating mammillary-related fiber tracts.
(A) Dorsal and (B) sagittal views of all white matter tracts reconstructed in 3D. Some major tracts visible in these views are labeled (onl: olfactory nerve layer, lotg: lateral olfactory tract, cc: corpus callosum, cing: cingulum bundle, scwm: supracallosal cerebral white matter, arb: arbor vitae, opt: optic tract, mcp: middle cerebellar peduncle, icp: inferior cerebellar peduncle, cst: corticospinal tract). (C) The final 3D structure of three mammillary related fiber tracts near the midline are shown after removing overlying structures (pm: principal mammillary tract, mtt: mammillothalamic tract, mtg: mammillotegmental tract). (D) Sagittal view of the maximum intensity projection of fluorescently labeled MM axons. Dashed lines indicate level of the coronal STPT sections shown in E–I. (J–L) Virtual coronal and (M–O) sagittal sections of the average template. Coronal sections are matched to STPT images on the left. Differential contrast features reveal other putative fiber tracts (dark), e.g., the anterior commissure (ac), fornix (fx), and fasciculus retroflexus (fr), indicated in N. Integration of these data enabled the 3D reconstruction of tracts directly on the template volume. Scale Bar: 800 μm from D–O.
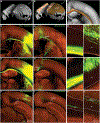
Figure 6.
Figure 6.. Delineating the supracallosal white matter (scwm).
(A,B) Angled lateral views of the reconstructed white matter tracts located just below the isocortex. (A) The corpus callosum (cc) consists of six substructures (ccg: genu, ccb: body, ccs: splenium, fa: anterior forceps, ee: extreme capsule, fp: posterior forceps). (B) White matter tracts layered above the cc, but below the isocortex, are colored (scwm, cing: cingulum bundle). (C) A virtual coronal section of the average template (at the approximate anterior-posterior midpoint of the white matter shown in B). (D–F) Coronal STPT images at three locations along the anterior-posterior axis show axonal projections labeled following tracer injections into three cortical areas (SSp-n: primary somatosensory area, nose; SSp-bfd: primary somatosensory area, barrel field; VISp: primary visual area). Callosal projection fibers are identified as those in the white matter below isocortex traveling toward the midline. (G–I) Coronal STPT images at three locations along the anterior-posterior axis show axonal projections labeled following tracer injections into three thalamic source areas (AM: anteromedial nucleus, AV: anteroventral nucleus, LD: laterodorsal nucleus). Thalamocortical projection fibers are localized above the callosal fibers, in the gap between cc and isocortex. (D’–I’) Enlarged view of the areas within the dashed line boxes (D–I). The white dashed lines in D’–I’ indicate white matter borders. Scale bars: 500 μm from D–I, 50 μm from D’–I’.
Figure 7.
Figure 7.. Registration to CCFv3 enables downstream applications.
(A–C) For many data analyses and visualizations, individual image series are registered to the CCF. Imaged brain sections (A) are registered to the average template (B), resulting in a field of deformation vectors (“deformation field”) (D) that map points from the raw image space to our reference space (C). For other analyses, the reverse mapping (CCF annotations pushed onto individual brains) may be appropriate (E–G). Here, using the deformation fields (D), annotations from our atlas (E) can be mapped back to the raw image space (F) to produce annotated image sections in the original image space (G). (H–J) An example of the reverse mapping is shown for a viral tracing experiment from the Allen Mouse Brain Connectivity Atlas acquired using STPT imaging. The original image section (H) is annotated by warping the atlas onto the image (I) using the deformation field output from registration. In this image (I), all structure annotations are overlaid onto the STPT image. However, individual structure boundaries can also be selectively viewed/mapped on the images using code we developed (J). (K) 3D renderings of the CCFv3 average template and two individual brains after applying their deformation fields in reverse to a whole brain surface mask. CCFv3 is shown on the left; two examples of individual brains are shown on the right, without (top) and with (bottom) cortical area parcellations. (L) Whole brain volumes were measured using the individual deformation fields for each of the 1,675 mice (gray line) used to create the average template, shown in the frequency histogram. The volume of the CCFv3 average template is indicated with the black line (511 mm3).

References

    1. Ali AA, Dale AM, Badea A, and Johnson GA (2005). Automated segmentation of neuroanatomical structures in multispectral MR microscopy of the mouse brain. Neuroimage 27, 425–435. - PubMed
    1. Allan Johnson G, Wang N, Anderson RJ, Chen M, Cofer GP, Gee JC, Pratson F, Tustison N, and White LE (2019). Whole mouse brain connectomics. J. Comp. Neurol 527, 2146–2157. - PMC - PubMed
    1. Avants BB, Epstein CL, Grossman M, and Gee JC (2008). Symmetric diffeomorphic image registration with cross-correlation: Evaluating automated labeling of elderly and neurodegenerative brain. Med. Image Anal 12, 26–41. - PMC - PubMed
    1. Badea A, Ali-Sharief AA, and Johnson GA (2007). Morphometric analysis of the C57BL/6J mouse brain. Neuroimage 37, 683–693. - PMC - PubMed
    1. Bienkowski MS, Bowman I, Song MY, Gou L, Ard T, Cotter K, Zhu M, Benavidez NL, Yamashita S, Abu-Jaber J, et al. (2018). Integration of gene expression and brain-wide connectivity reveals the multiscale organization of mouse hippocampal networks. Nat. Neurosci 21, 1628–1643. - PMC - PubMed

Publication types

LinkOut - more resources