. 2020 May 28;181(5):1131-1145.e21.
doi: 10.1016/j.cell.2020.04.015. Epub 2020 May 7.

A Paleogenomic Reconstruction of the Deep Population History of the Andes

Affiliations

A Paleogenomic Reconstruction of the Deep Population History of the Andes

Nathan Nakatsuka et al. Cell. .

Abstract

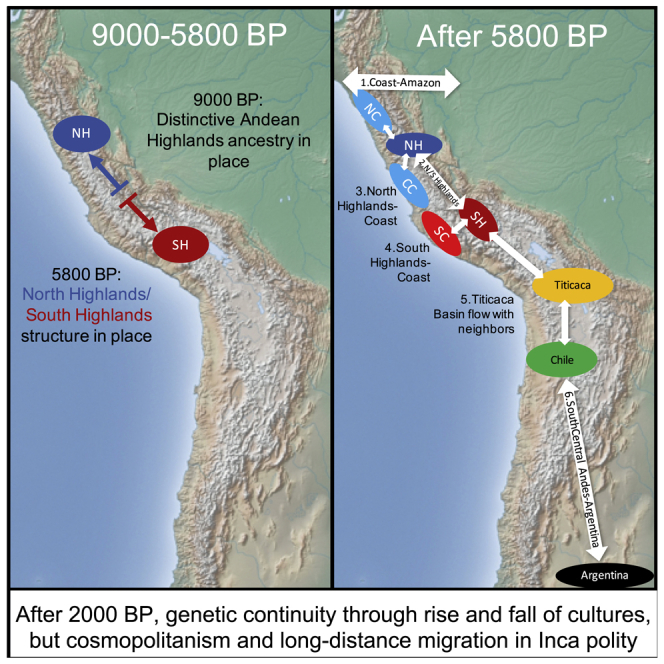
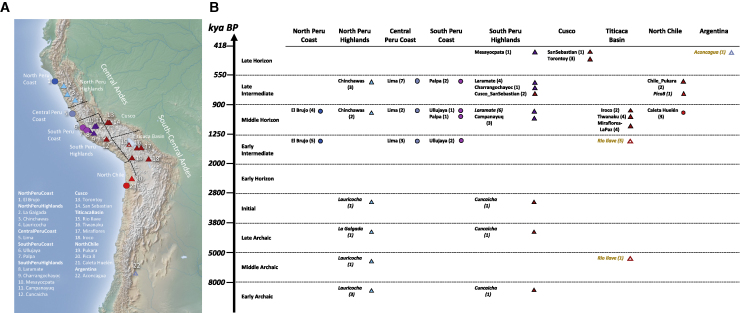
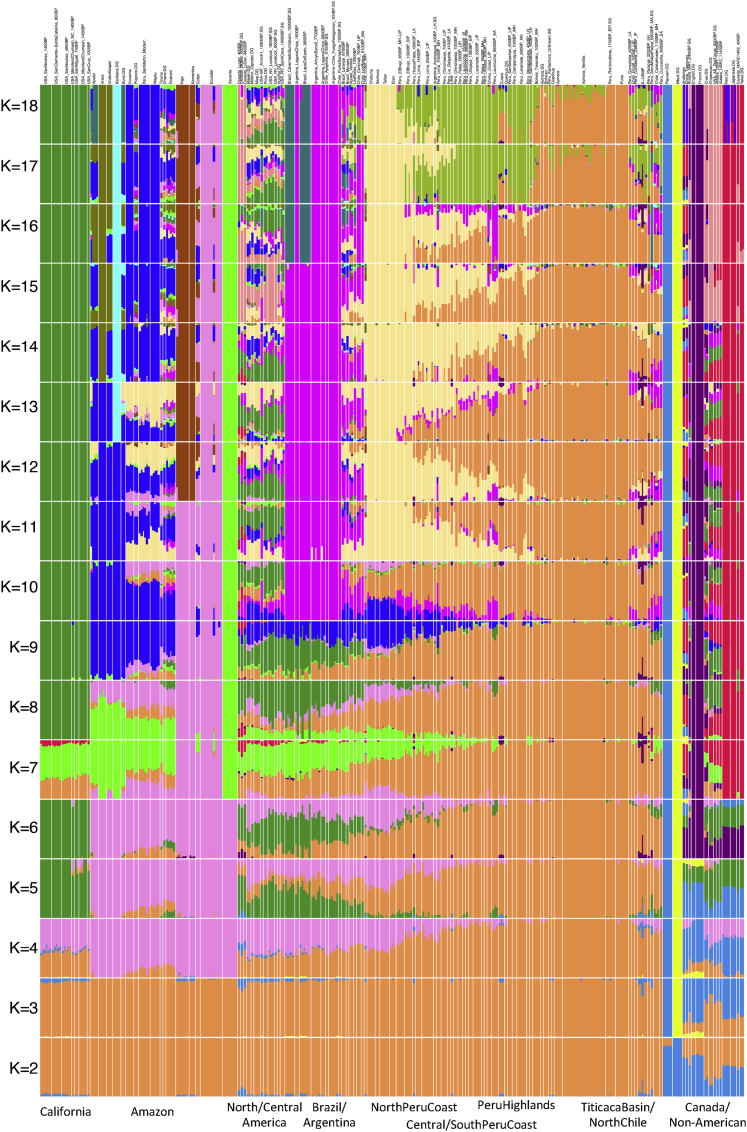
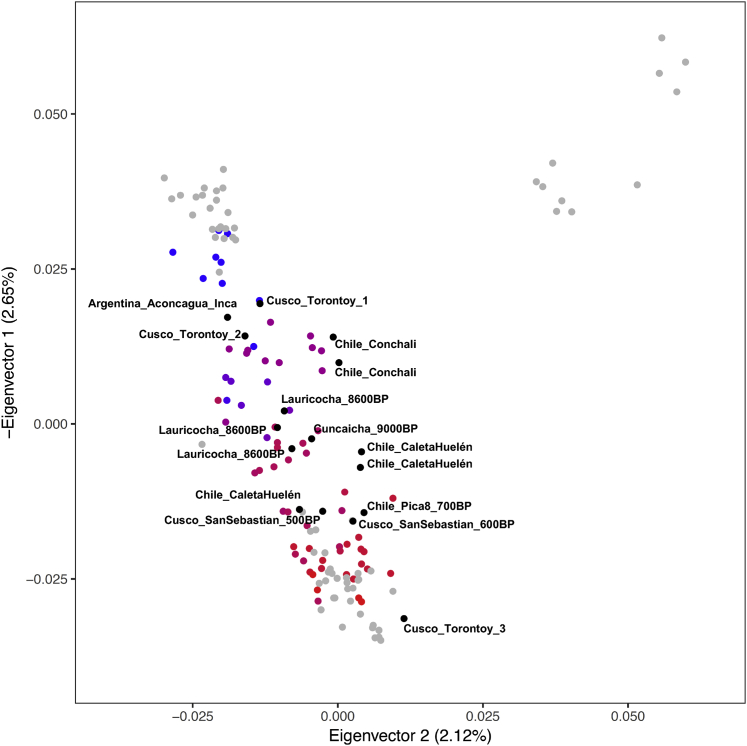
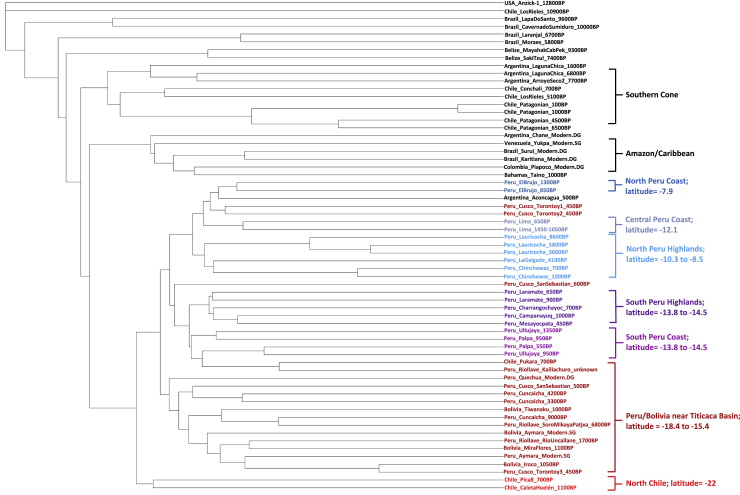
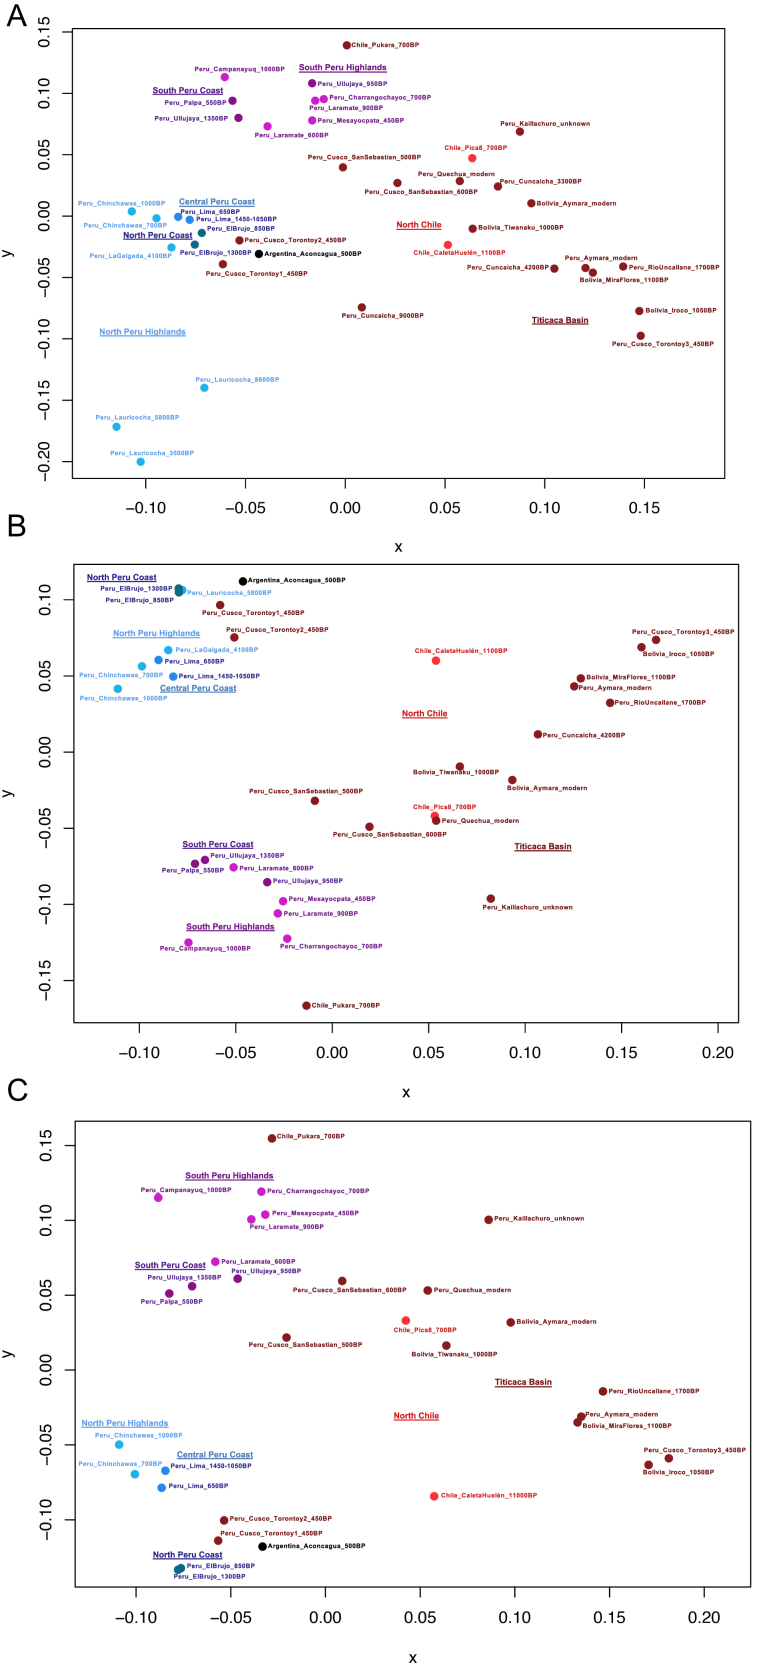
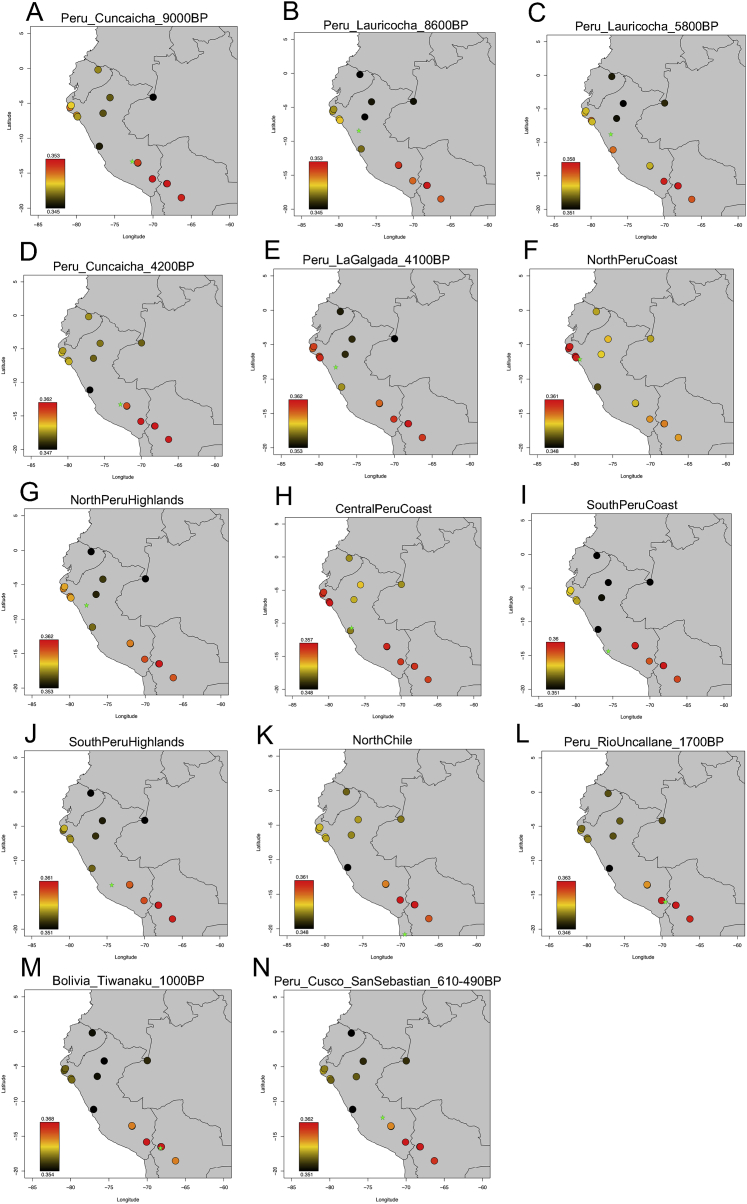
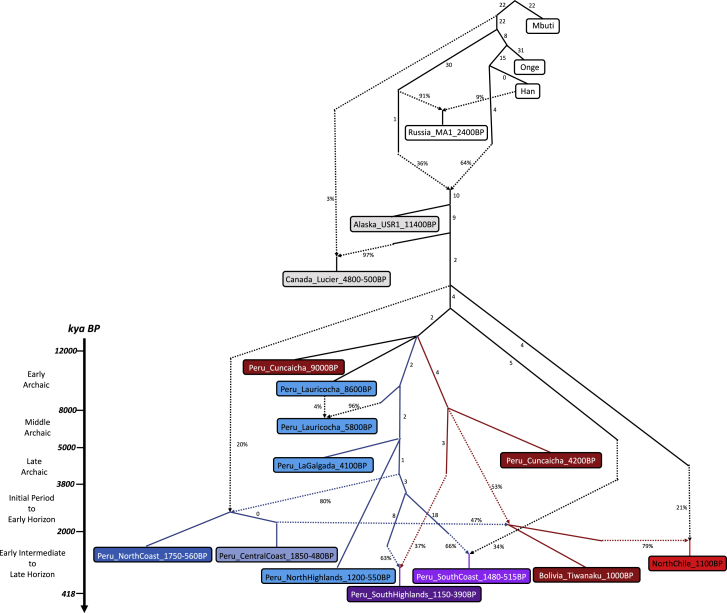
There are many unanswered questions about the population history of the Central and South Central Andes, particularly regarding the impact of large-scale societies, such as the Moche, Wari, Tiwanaku, and Inca. We assembled genome-wide data on 89 individuals dating from ∼9,000-500 years ago (BP), with a particular focus on the period of the rise and fall of state societies. Today's genetic structure began to develop by 5,800 BP, followed by bi-directional gene flow between the North and South Highlands, and between the Highlands and Coast. We detect minimal admixture among neighboring groups between ∼2,000-500 BP, although we do detect cosmopolitanism (people of diverse ancestries living side-by-side) in the heartlands of the Tiwanaku and Inca polities. We also highlight cases of long-range mobility connecting the Andes to Argentina and the Northwest Andes to the Amazon Basin. VIDEO ABSTRACT.

Keywords: Andes; ancient DNA; anthropology; archaeology; population genetics.


Conflict of interest statement

Declaration of Interests The authors declare no competing interests.

Figures

None
Graphical abstract
Figure 1
Figure 1
Distribution of Pre-Hispanic Individuals Over Space and Time (A) Map with the locations of 86 ancient individuals (3 from our study are not included here due to very low coverage). Dotted lines represent regions defined for this study. Highland individuals are triangles and Coast individuals are circles. Coloring corresponds to genetic profiles, which in most cases match the geographic regions. (B) Groupings of ancient individuals based on geography and archaeological period (Table S1). Italics indicate previously published individuals, and sample sizes are in parentheses (yellow indicates shotgun sequences). Map was made with Natural Earth.
Figure S1
Figure S1
Images of Archaeological Sites, Related to STAR Methods (A) Location of Pukara in the Altiplano of northern Chile and South America (https://satellites.pro/mapa_de_Chile#-17.801972,-69.317661,19). (B) Undisturbed stone funerary cist of Pukara 3, close to the border of the cliff above Pukara 1. (C) Cist 1 and 2 (left to right) of Pukara 6. Disturbed and badly preserved human remains for this study come from cist or Tomb 1 (60 cm height, less than one m in diameter). The cists are surrounded by tola vegetation. (D) Iroco site (Bolivia). (E) Tiwanaku burial (Locus 785). (F) Tiwanaku cist tomb (Locus 719) with the sample individual 5 (MIS5). (G) Fragment of keru with the representation of the “staffed god.”
Figure S2
Figure S2
Mitochondrial DNA Tree, Related to Figures 3 and 4 Phylogenetic tree built with maximum parsimony algorithm of 136 ancient mtDNA (newly reconstructed sequences in red and previously published sequences in blue) and 197 modern mtDNA sequences (in black font) built using MEGA6 (Tamura et al., 2013) with an African mtDNA sequence used to root the tree (not shown). (A) Tree section including mtDNA haplogroups C1, D4h3a and D1. (B) Tree section including mtDNA haplogroup A2 and B2. Related to Table S1.
Figure S3
Figure S3
ADMIXTURE Plot at Different K Values, Related to Figure 2 The run with the highest log-likelihood score after 100 trials was taken for each K value.
Figure 2
Figure 2
Principal Components Analysis (PCA) of Ancient Individuals Projected onto Modern Variation from Labeled Groups Modern individuals are in gray, and ancient individuals form a gradient that correlates to latitude (coloring is directly based on latitude with blue most north and red most south; numbers are latitude degrees). We removed 16 outliers from North Chile, Cusco, and Argentina that have evidence of ancestry from gene flows outside each region, and Peru_Lauricocha_8600BP and Peru_Cuncaicha_9000BP, which were too old to share the latitudinal cline (Figure S4 includes them). The percentage of total variation explained by each PC is shown in parentheses on each axis.
Figure S4
Figure S4
PCA of Additional Samples Removed from Figure 2, Related to Figure 2 Principal Components Analysis (PCA) of ancient samples projected onto modern individuals from the Andes and Amazon region (Barbieri et al., 2019). Eigenvector 1 coordinates were reversed so that the PCA correlates with geographical structure. Ancient individuals of Figure 2 are shown on a blue-red latitudinal gradient. Modern individuals are in gray. In black are all individuals that we removed from Figure 2 due to their outlier status reflecting distinctive histories that we discuss in the text (NorthChile individuals, Cusco individuals, the Argentinian Inca individual, and the Peru_Lauricocha_8600BP and Peru_Cuncaicha_9000BP individuals). The percentage of total variation explained by each PC is shown in parentheses on each axis.
Figure 3
Figure 3
Neighbor-Joining Tree Based on Inverted Outgroup-f3 Statistics (1/f3(Mbuti; Group1, Group2)) Only individuals with >40,000 SNPs are included.
Figure S5
Figure S5
Multi-Dimensional Scaling (MDS) Plot of the Matrix of Statistics of the Form 1-f3(Mbuti; South American 1, South American 2), Related to Figure 2 Only individuals with > 100,000 SNPs are included. (A) Plot of all groups. (B) Plot of all groups younger than ~5900 BP, with the outliers Peru_Lauricocha_3600BP and Peru_Cuncaicha_3300BP removed. (C) Plot of all Andean groups younger than ~3000 BP.
Figure S6
Figure S6
Admixture Graphs Generated through a Semi-Automated Process, Related to Figures 3 and 4 and Table S1 (A) This is the best fitting graph relating these groups (maximum |Z-score| = 2.5). Mixtures between South Peru Highlands (Peru_Cuncaicha_4200BP) and North Peru Highlands (Peru_Lauricocha_5800BP and Peru_LaGalgada_4100BP) were required in all fitting graphs (maximum |Z| < 3). (B) Admixture graph modeling Amazonian ancestry (related to Peru_SanMartin_modern) in NorthPeruCoast, NorthPeruHighlands, and CentralPeruCoast. Maximum |Z-score| = 3.0. (C) Admixture graph that fits the data (maximum |Z-score| = 3.1), showing Argentina_LagunaChica_1600BP as admixed from a population related to Argentina_LagunaChica_6800BP and NorthChile.
Figure S7
Figure S7
Heatmap of Outgroup f3-Statistics, Related to Figure 2 Color coding is based on statistics of the form f3(Mbuti; Ancient, Modern), where the Ancient groups are (A) Peru_SouthHighlands_Cuncaicha_9000BP, (B) Peru_NorthHighlands_Lauricocha_8600BP, (C) Peru_NorthHighlands_Lauricocha_5800BP, (D) Peru_SouthHighlands_Cuncaicha_4200BP, (E) Peru_NorthHighlands_LaGalgada_4100BP, (F) NorthPeruCoast, (G) NorthPeruHighlands, (H) CentralPeruCoast, (I) SouthPeruCoast, (J) SouthPeruHighlands, (K) NorthChile, (L) Peru_TiticacaBasin_RioUncallane_1700BP, (M) Bolivia_TiticacaBasin_Tiwanaku_1000BP, and (N) Peru_Cusco_SanSebastian_610-490BP. Modern groups are from Barbieri et al. (2019). Related to Table S6.
Figure 4
Figure 4
Overview of Findings Admixture graph fit (maximum |Z| score between observed and expected f-statistics is 3.1). Chile_Pica8_700BP was removed from NorthChile due to low coverage.
Figure S8
Figure S8
qpWave Analyses, Related to STAR Methods qpWave analyses with all pairs (Pairs_Rank0) or triplets (Triplets_Rank0 or Triplets_Rank1) of all Andean and North Chile groups when compared with Peru_Lauricocha_8600BP. Rank 0 and 1 refers to a model in which all populations in the analysis fit as derived from one or two ancestral populations, respectively, relative to the outgroups (rejection of these ranks means that additional sources of ancestry are required to model the populations). Modern groups and shotgun samples were excluded due to potential for artifacts. Peru_Lauricocha_5800BP and Peru_Lauricocha_3600BP were also excluded due to their previously known lack of California Channel Island-related ancestry (Posth et al., 2018). Color-coding refers to pairs or triples that include groups that consistently do not fit in some two-source or three-source models: the Cuncaicha 3300 BP and 4200 BP individuals are the only groups that are consistently poorly modeled even without a third source of ancestry. Related to Table S8.
Figure 5
Figure 5
Map Summarizing Genetic Exchanges in the Central Andes (1) Bi-directional mixture between the North and Central Coasts and the Northwest Amazon. (2) Genetic exchange between NorthPeruCoast and NorthPeruHighlands. (3) Genetic interaction between CentralPeruCoast and NorthPeruHighlands_Lauricocha before ~5800 BP. (4) Genetic exchange between NorthPeruHighlands and SouthPeruHighlands. (5) Individuals of NorthPeruCoast and Titicaca Basin-related ancestry found in Cusco (Torontoy) during the Inca Empire (~450 BP). (6) Spread of SouthPeruHighlands-related ancestry into the Cusco region 450 BP–present. (7) Genetic exchange between SouthPeruHighlands and Titicaca Basin before 1,700 BP. (8) Greater allele sharing between Tiwanaku and SouthPeruHighlands relative to other individuals in Titicaca Basin during the Tiwanaku period (~1,000 BP). (9) SouthPeruHighlands-related ancestry found in Pukara in Northern Chile ~700 BP. (10) Genetic exchange between NorthChile and Titicaca Basin before ~1,700 BP. (11) NorthPeruCoast-related ancestry found in an Inca sacrifice victim in Argentina. (12) Gene flow between NorthChile or SouthPeruHighlands and the Pampas region of Argentina.

References

    1. Alconini S., Covey R.A. Oxford University Press; 2018. The Oxford Handbook of the Incas.
    1. Aldenfelder M.S. High elevation foraging societies. In: Silverman H., Isbell W.H., editors. The Handbook of South American Archaeology. Springer; 2008. pp. 131–143.
    1. Alexander D.H., Novembre J., Lange K. Fast model-based estimation of ancestry in unrelated individuals. Genome Res. 2009;19:1655–1664. - PMC - PubMed
    1. Arriaza B.T., Standen V.G., Cassman V., Santoro C.M. Chinchorro culture: pioneers of the coast of the Atacama Desert. In: Silverman H., Isbell W.H., editors. The Handbook of South American Archaeology. Springer; 2008. pp. 45–58.
    1. Aufderheide A.C., Kelley M.A., Rivera M., Gray L., Tieszen L.L., Iversen E., Krouse H.R., Carevic A. Contributions of chemical dietary reconstruction to the assessment of adaptation by ancient highland immigrants (Alto Ramirez) to coastal conditions at Pisagua, North Chile. J. Archaeol. Sci. 1994;21:515–524.

Publication types

LinkOut - more resources