. 2020 May 28;181(5):1062-1079.e30.
doi: 10.1016/j.cell.2020.04.018. Epub 2020 May 7.

Unblending of Transcriptional Condensates in Human Repeat Expansion Disease

Affiliations

Unblending of Transcriptional Condensates in Human Repeat Expansion Disease

Shaon Basu et al. Cell. .

Abstract

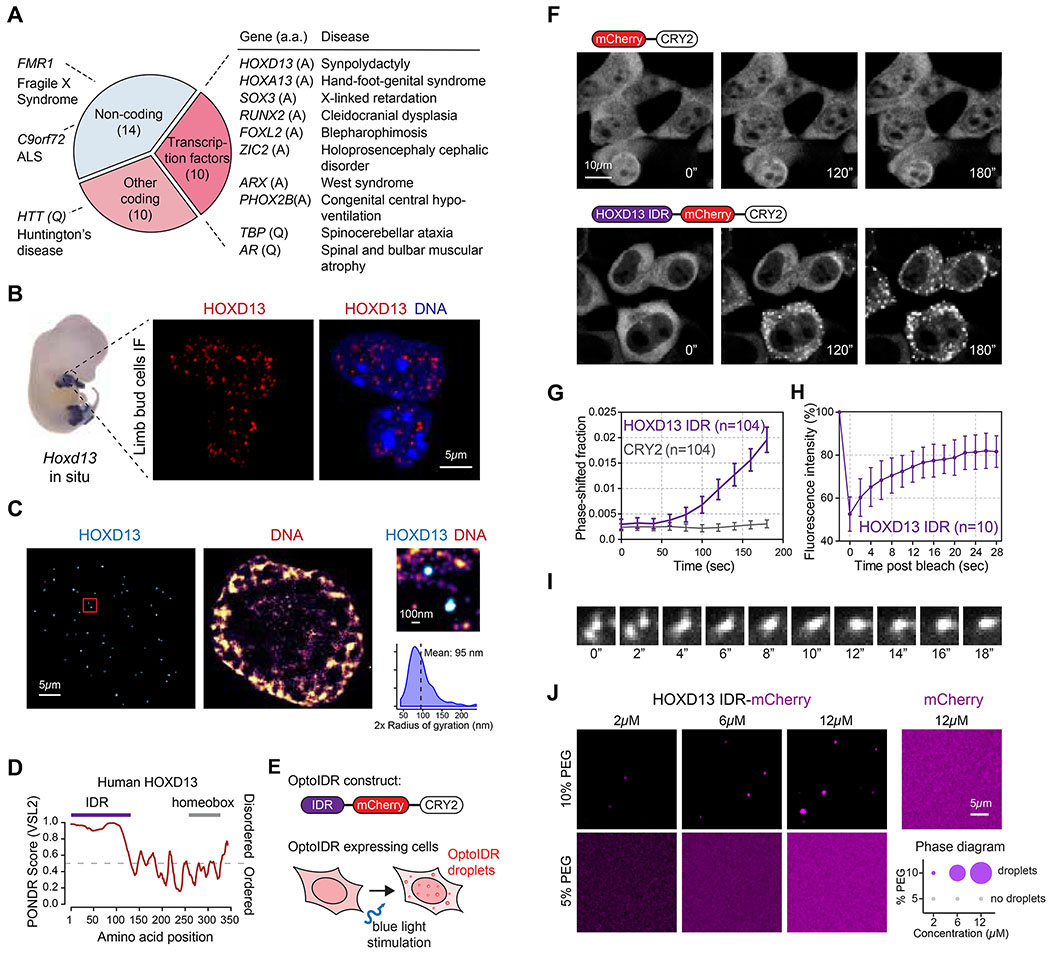
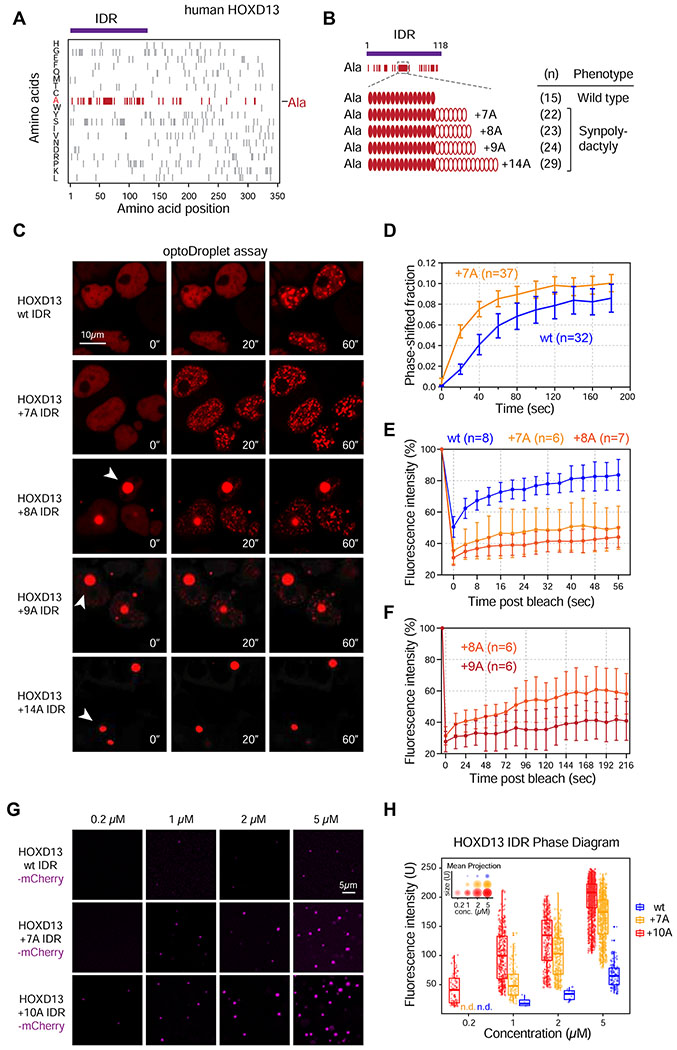
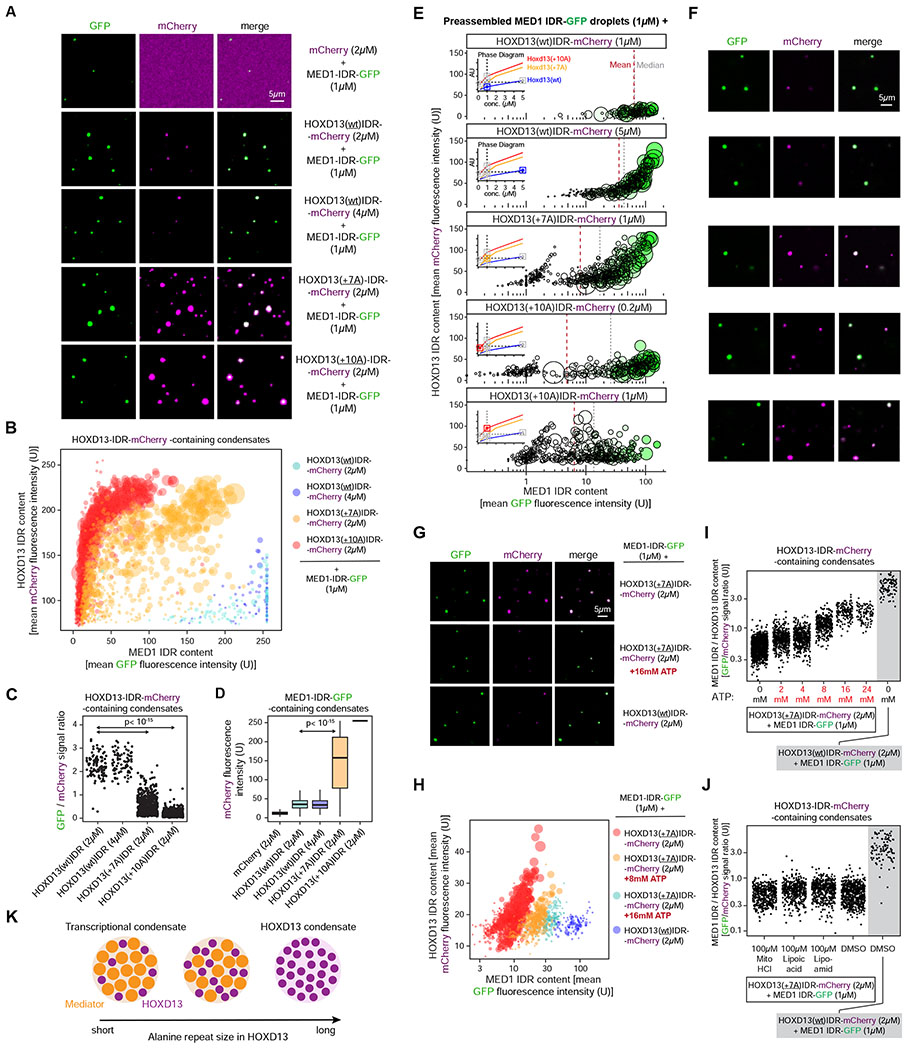
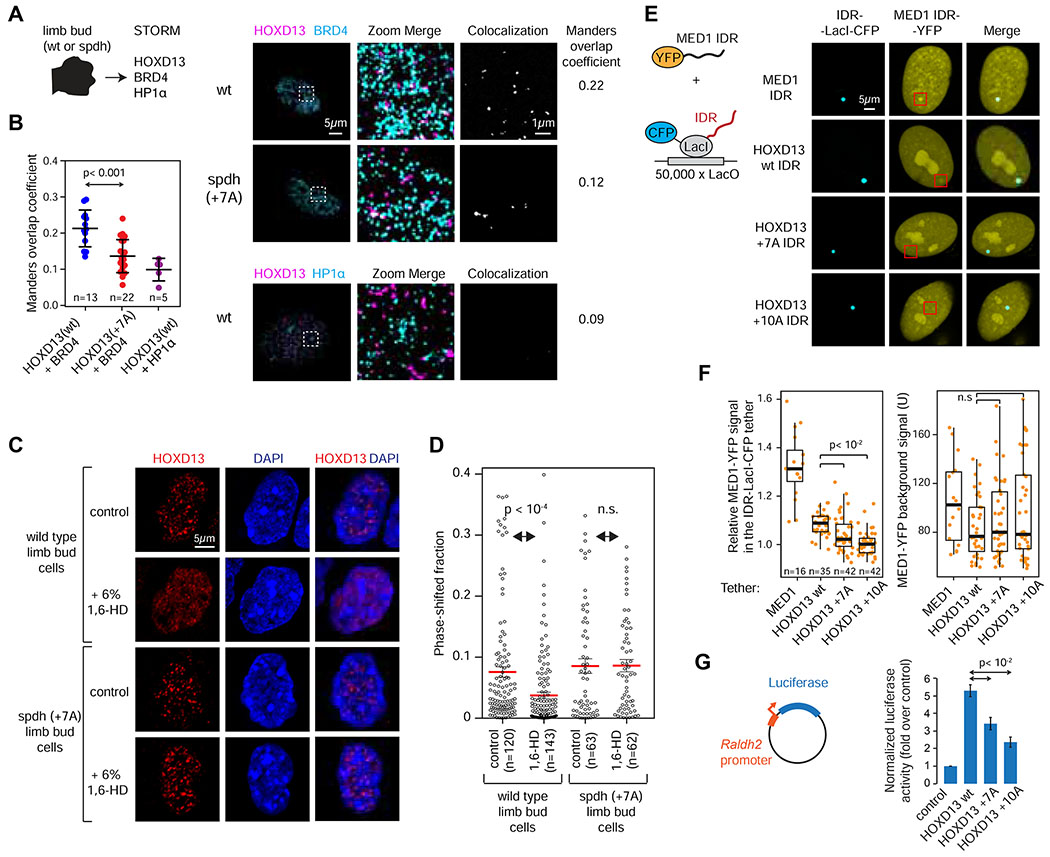
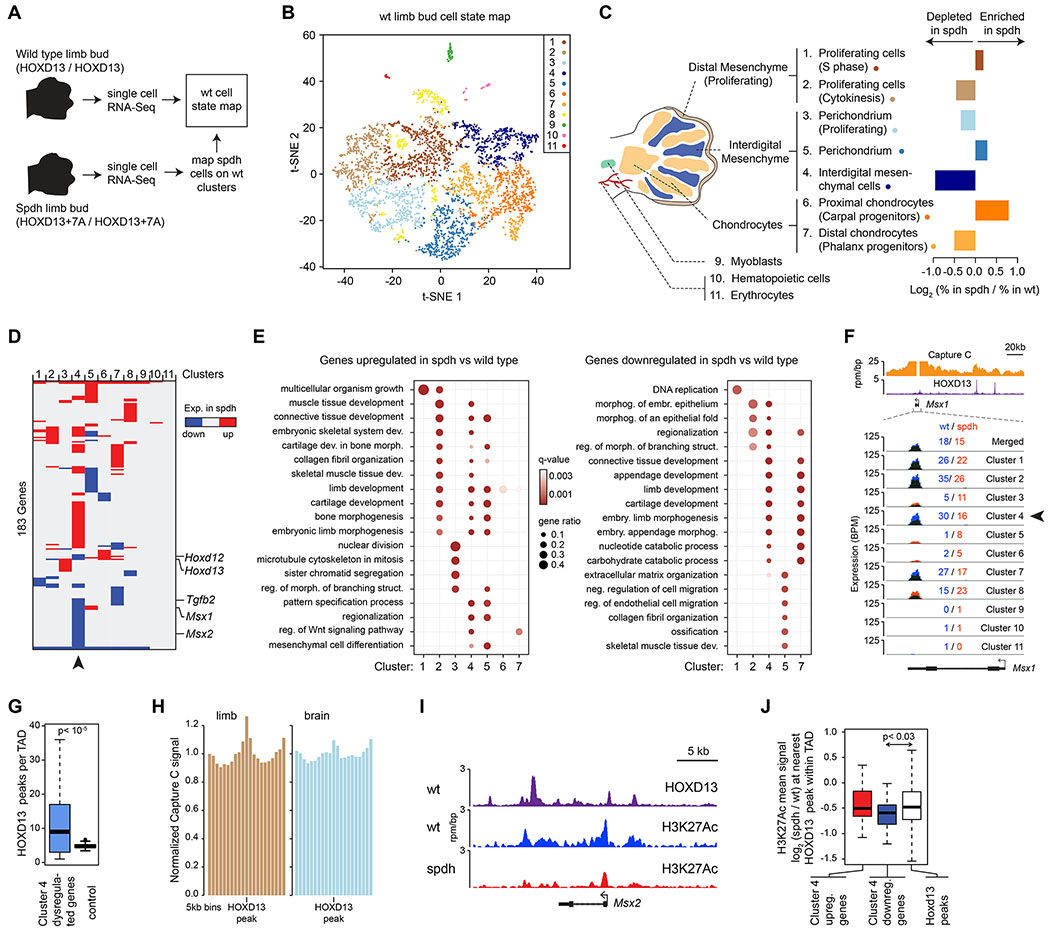
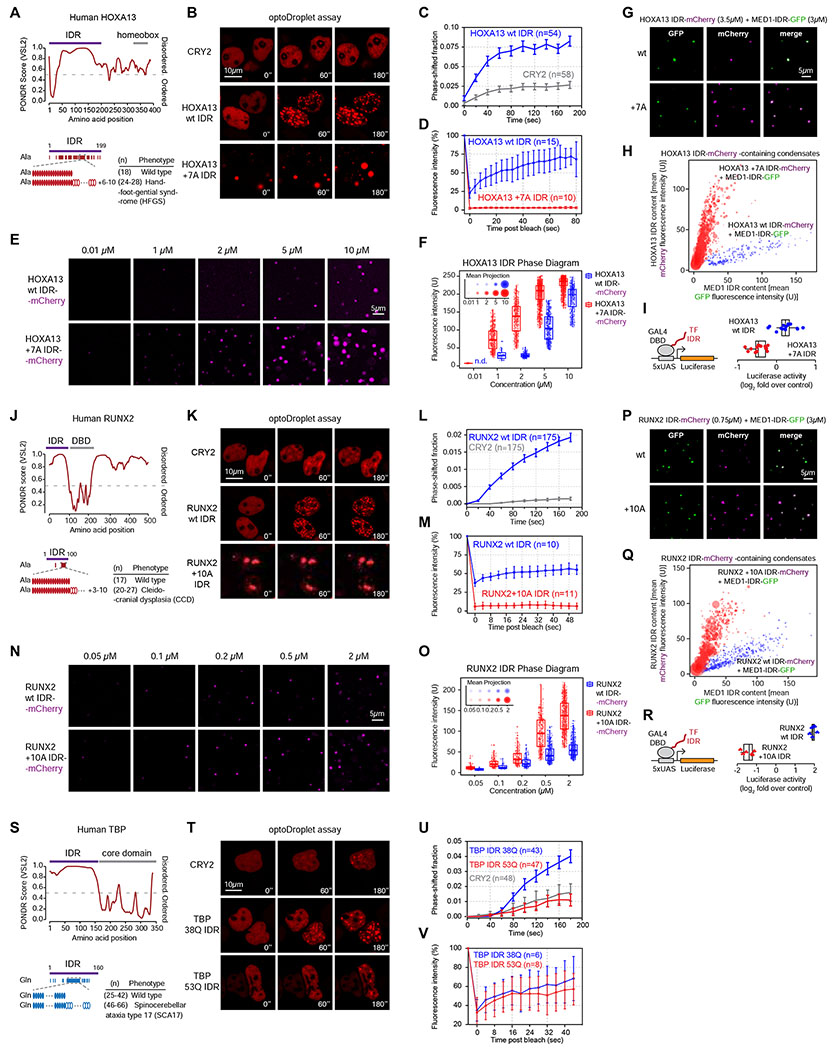
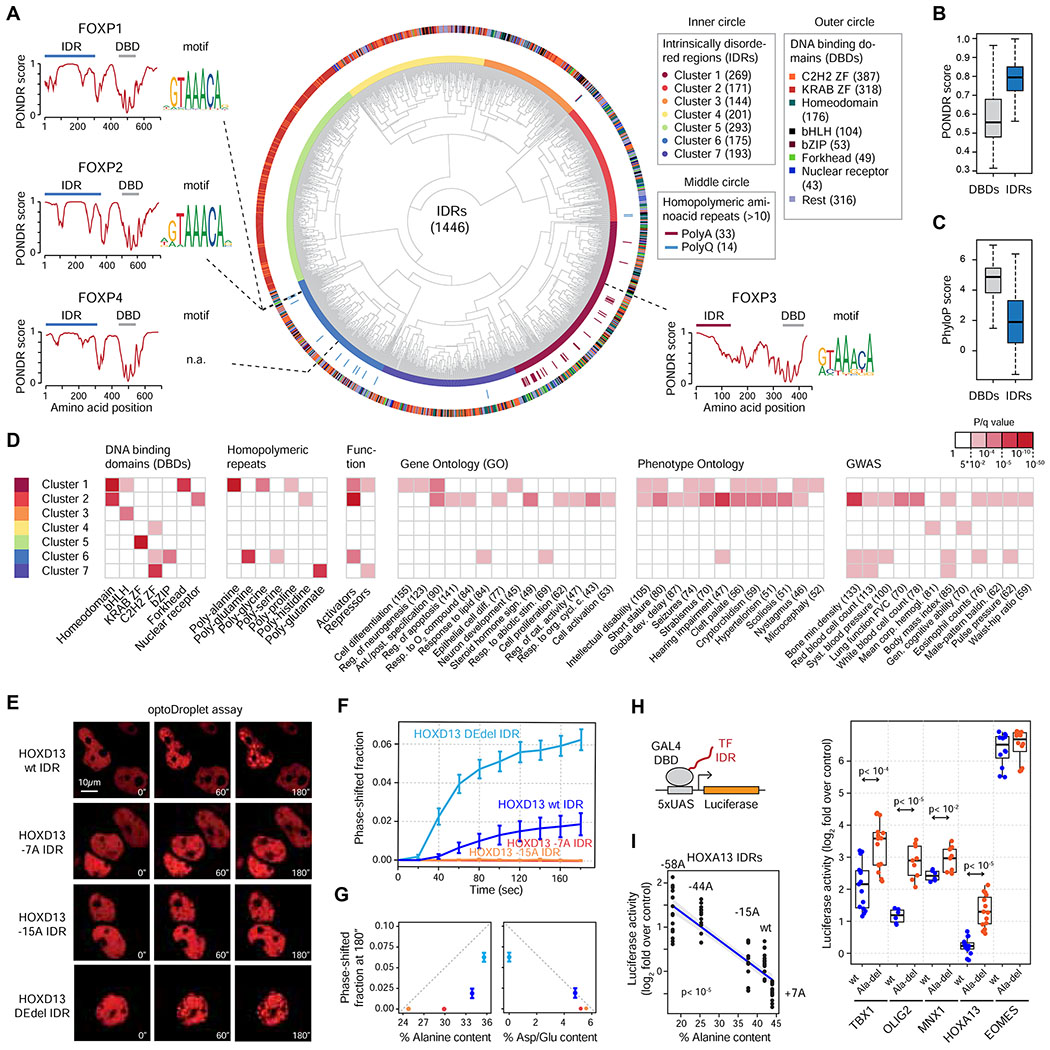
Expansions of amino acid repeats occur in >20 inherited human disorders, and many occur in intrinsically disordered regions (IDRs) of transcription factors (TFs). Such diseases are associated with protein aggregation, but the contribution of aggregates to pathology has been controversial. Here, we report that alanine repeat expansions in the HOXD13 TF, which cause hereditary synpolydactyly in humans, alter its phase separation capacity and its capacity to co-condense with transcriptional co-activators. HOXD13 repeat expansions perturb the composition of HOXD13-containing condensates in vitro and in vivo and alter the transcriptional program in a cell-specific manner in a mouse model of synpolydactyly. Disease-associated repeat expansions in other TFs (HOXA13, RUNX2, and TBP) were similarly found to alter their phase separation. These results suggest that unblending of transcriptional condensates may underlie human pathologies. We present a molecular classification of TF IDRs, which provides a framework to dissect TF function in diseases associated with transcriptional dysregulation.

Keywords: activation domain; condensate; intrinscially disordered region; phase separation; repeat expansion; synpolydactyly; transcription factor; transcriptional condensate.


Conflict of interest statement

Declaration of Interests The Max Planck Society has filed a patent application based on this paper.

Figures

Figure 1.
Figure 1.. The HOXD13 IDR drives phase separation
(A) Disease-associated repeat expansions in humans. (a.a: amino acid) (B) (left) Hoxd13 whole mount in situ hybridization in an E12.5 mouse embryo. (right) HOXD13 Immunofluorescence (IF) in E12.5 mouse limb bud cells. (C) Stochastic optical reconstruction microscopy (STORM) images of E12.5 mouse limb bud cells. The zoomed-in area on the right is highlighted with a red box on the left. (D) Graph plotting intrinsic disorder for human HOXD13. The IDR cloned for subsequent experiments is highlighted with a purple bar. (E) Scheme of the optoDroplet assay. The optoIDR construct consists of the HOXD13 IDR fused to mCherry and the A. thaliana CRY2 PHR domain. (F) Representative images of live HEK-293T cells expressing mCherry-CRY2 (top) and HOXD13 IDR-mCherry-CRY2 (bottom) fusion proteins. Cells were stimulated with 488nm laser every 20s for 3 minutes. (G) Quantification of the fraction of the cytoplasmic area occupied by HOXD13 IDR-mCherry-CRY2 and mCherry-CRY2 droplets in HEK-293T cells over time. Data displayed as mean+/− SEM. (H) Fluorescence intensity of HOXD13 IDR-mCherry-CRY2 droplets before, during and after photobleaching. Data displayed as mean+/−SD. (I) Time lapse images of a droplet fusion event in HEK-293T cells expressing HOXD13 IDR-mCherry-CRY2 fusion protein. (J) (left) Representative images of droplet formation by purified HOXD13-mCherry and mCherry at the indicated concentrations. (right) Phase diagram of HOXD13-mCherry in the presence of different concentrations of PEG-8000. The size of the circles is proportional to the size of droplets detected in the respective buffer conditions. See also Figure S1.
Figure 2.
Figure 2.. Synpolydactyly-associated repeat expansions enhance HOXD13 IDR phase separation
(A) Amino acid composition of human HOXD13. Ticks represent amino acids indicated on the y-axis at the positions indicated on the x-axis. The IDR cloned for subsequent experiments is highlighted with a purple bar. (B) Alanines within the HOXD13 IDR sequence are indicated as red ticks. The central alanine repeat consists of 15As in the wild type protein. (C) Representative images of live HEK-293T nuclei expressing wt and repeat-expanded HOXD13 IDR-mCherry-CRY2 fusion proteins. Cells were stimulated with 488nm laser every 20s for 3 minutes. Arrowheads highlight spontaneously forming IDR condensates present without 488nm laser stimulation. (D) Quantification of the fraction of the nuclear area occupied by HOXD13 wt IDR-mCherry-CRY2 and HOXD13 +7A IDR-mCherry-CRY2 droplets in HEK-293T cells over time. Data displayed as mean+/−SEM. (E) Fluorescence intensity of light-induced wt, +7A and +8A HOXD13 IDR droplets before, during and after photobleaching. Data displayed as mean+/−SD. (F) Fluorescence intensity of +8A and +9A spontaneously formed HOXD13 IDR condensates before, during and after photobleaching. Data displayed as mean+/−SD. (G) Representative images of droplet formation by purified HOXD13 IDR-mCherry fusion proteins in droplet formation buffer. (H) Phase diagram of HOXD13 IDR-mCherry fusion proteins. Every dot represents a detected droplet. The inset depicts the projected average size of the droplets as mean+/− SD (middle circle: mean, inner and outer circle: SD). n.d.: not detected See also Figure S2.
Figure 3.
Figure 3.. Synpolydactyly-associated repeat expansions alter the composition of Hoxd13-containing condensates in vitro
(A) Representative images of droplet formation by purified MED1-IDR-GFP and HOXD13 IDR-mCherry fusion proteins in droplet formation buffer. (B) Quantification of GFP and mCherry fluorescence intensity in HOXD13 IDR-mCherry containing droplets in the indicated MED1 IDR-GFP mixing experiments. Each dot represents one droplet, and the size of the dot is proportional to the size of the droplet. (C) Quantification of the ratio of GFP and mCherry fluorescence intensity in HOXD13 IDR-mCherry containing droplets in the indicated MED1 IDR-GFP mixing experiments. P value is from a Welch’s t-test. (D) Quantification of mCherry fluorescence intensity in MED1 IDR-GFP containing droplets in the indicated MED1 IDR-GFP mixing experiments. P value is from a Welch’s t-test. (E) Quantification of GFP and mCherry fluorescence intensity in HOXD13 IDR-mCherry containing droplets. Each dot represents one droplet. The size of the dot is proportional to the size of the droplet, and the color of the dot is scaled to the MED1 signal in the droplet. The insets show a simplified phase diagram of HOXD13 IDRs based on the data displayed in Figure 2H. x-axis is in log10 scale. (F) Representative images of the mixtures in (E). (G) Representative images of droplets formed by purified MED1-IDR-GFP and HOXD13 IDR-mCherry fusion proteins. (H) Quantification of GFP and mCherry fluorescence intensity in HOXD13 IDR-mCherry containing droplets in the indicated MED1 IDR-GFP mixing experiments. Each dot represents one droplet, and the size of the dot is proportional to the size of the droplet. x-axis is in log10 scale. (I-J) Quantification of the ratio of GFP and mCherry fluorescence in HOXD13 IDR-mCherry containing droplets in the indicated mixing experiments. In (I), the y-axis is in log10 scale. (K) Condensate unblending model of the impact of HOXD13 alanine repeat expansions.
Figure 4.
Figure 4.. Altered composition and properties of repeat-expanded HOXD13-condensates in vivo
(A) (left) Experimental scheme (right) Stochastic optical reconstruction microscopy (STORM) images of wt and spdh E12.5 mouse limb bud cell nuclei. The zoomed-in area on the right is highlighted with a white box in the middle. (B) Manders overlap coefficients of the STORM co-localizations. P value is from a Student’s t test. (C) (left) Experimental scheme (right) Representative images of wild type and spdh mouse limb bud cells with or without treatment with 6% 1,6-hexanediol for 1min. (D) Quantification of signal within HOXD13 puncta in mouse limb bud cells [displayed in (C)] with or without treatment with 6% 1,6-hexanediol for 1min. (E) Fluorescence images of ectopically expressed MED1 IDR-YFP in U2OS cells co-transfected with the indicated HOXD13 IDR-LacI-CFP fusion constructs. (F) Quantification of the relative MED1 IDR-YFP signal intensity in the HOXD13 IDR foci. P values are from a Welch’s t-test. (G) Luciferase reporter assays of HOXD13 wt, +7A and +10A mutants co-expressed with a Raldh2-luciferase reporter construct. P value is from a Student’s t test. See also Figure S3.
Figure 5.
Figure 5.. HOXD13 repeat expansion alters the transcriptional program of several cell types in a cell-specific manner
(A) Scheme of the scRNA-Seq experiment strategy. (B) Visualization of the wild-type scRNA-seq data using t-distributed Stochastic Neighbor Embedding (t-SNE). (C) Changes in cell type composition in spdh limb buds. Displayed are the relative changes in the proportions of cells that belong to the designated clusters (i.e. cell states) between wt and spdh limb buds. (D) Heatmap of differentially up- or downregulated genes in the spdh limb bud relative to wt within the 11 cell clusters. Arrowhead highlights the interdigital mesenchymal cells. (E) Gene Ontology (GO) term enrichment analysis of differentially up- or downregulated genes in the spdh limb bud relative to wt within individual cell clusters. (F) Profiles of Capture C, HOXD13 ChIP-Seq and scRNA-Seq data at the Msx1 locus. The mean expression value in spdh (red) and wt cells (blue) within each cluster are also displayed. Arrowhead highlights the expression level in interdigital mesenchymal cells, where the expression difference is the most profound. (G) Number of HOXD13 peaks in topologically associating domains (TADs) that contain a gene dysregulated in Cluster 4. P value is from a Wilcoxon rank sum test. (H) Mean Capture C signal around HOXD13 peaks within topologically associating domains (TADs) that contain a gene dysregulated in Cluster 4. (I) ChIP-Seq binding profiles around the Msx2 locus. (J) Quantification of the mean H3K27Ac signal at the nearest HOXD13 binding sites around the indicated genes within the same TAD. P value is from a Wilcoxon rank sum test. See also Figure S4, S5.
Figure 6.
Figure 6.. Disease-associated repeat expansions alter the phase separation capacity of other TF IDRs
(A, J, S) Graphs plotting intrinsic disorder for HOXA13, RUNX2 and TBP. The IDRs cloned for subsequent experiments are highlighted with a purple bar. (B, K, T) Representative images of HEK-293T nuclei expressing the indicated TF IDR-mCherry-CRY2 fusion proteins. Cells were stimulated with 488nm laser every 20s for 3 minutes. (C, L, U) Quantification of the fraction of the nuclear area occupied by droplets of the indicated TF IDR-mCherry-CRY2 fusion proteins in HEK-293T nuclei over time. Data displayed as mean+/−SEM. (D, M, V) Fluorescence intensity of droplets of the indicated TF IDR-mCherry-CRY2 fusion proteins before, during and after photobleaching. For the HOXA13 +7A IDR and the RUNX2 +10A IDR the spontaneously formed droplets were bleached, for all other fusion proteins the light-induced droplets were bleached. Data displayed as mean+/−SD. (E, N) Representative images of droplet formation by purified TF IDR-mCherry fusion proteins in droplet formation buffer. (F, O) Phase diagram of TF IDR-mCherry fusion proteins. Every dot represents a detected droplet. The inset depicts the projected average size of the droplets as mean+/− SD (middle circle: mean, inner and outer circle: SD). n.d.: not detected (G, P) Representative images of droplet formation by purified MED1-IDR-GFP and TF IDR-mCherry fusion proteins in droplet formation buffer with 10% PEG-8000. (H, Q) Quantification of GFP and mCherry fluorescence intensity in TF IDR-mCherry containing droplets in the indicated MED1 IDR-GFP mixing experiments. Each dot represents one droplet, and the size of the dot is proportional to the size of the droplet. (I, R) (left): GAL4 activation assay schematic. The luciferase reporter plasmid, and the expression vector for the GAL4 DBD-TF IDR fusion proteins were transfected into HEK-293T cells. (right): Luciferase reporter activity of the indicated TF IDRs fused to GAL4-DBD. p <10−3 for both wt/mutant comparisons (Student’s t-test). See also Figure S6.
Figure 7.
Figure 7.. A catalog of human transcription factor IDRs
(A) Classification of human TF IDRs. The inner circle depicts the clusters of TF IDRs. The outer circle includes the annotation of the DBDs of the TFs whose IDRs were classified in the inner circle. (B) Boxplot of PONDR scores (disorder) of human TF DBDs and IDRs. (C) Boxplot of phyloP scores (conservation) of human TF DBDs and IDRs (D) Enrichment of TFs whose IDRs belong to the seven IDR clusters for the indicated sequence features, functional and phenotypic categories. Red box highlights significant enrichment (q<0.05). (E) Representative images of HEK-293T cells expressing the indicated HOXD13 IDR-mCherry-CRY2 fusion proteins. Cells were stimulated with 488nm laser every 20s for 3 minutes. (F) Quantification of the fraction of the nuclear area occupied by HOXD13 IDR-mCherry-CRY2 droplets in HEK-293T cells over time. Data displayed as mean+/−SEM. (G) Plot of the nuclear area occupied by HOXD13 IDR-mCherry-CRY2 droplets versus the Alanine content and Asp/Glu content of the IDR constructs. Data displayed as mean+/−SEM. (H) (left): GAL4 activation assay schematic. The luciferase reporter plasmid, and the expression vector for the GAL4 DBD-TF IDR fusion proteins were transfected into HEK-293T cells. (right): Luciferase reporter activity of the indicated TF IDRs fused to GAL4-DBD. P values are from a Welch’s t-test. (I) Normalized luciferase activity of the indicated HOXA13 IDRs fused to GAL4 DBD. The blue line is a linear regression line, and the grey zones denote the 95% conference interval. P value is from a t-test. See also Figure S7.

References

    1. Akiyama H, Chaboissier MC, Martin JF, Schedl A, and de Crombrugghe B (2002). The transcription factor Sox9 has essential roles in successive steps of the chondrocyte differentiation pathway and is required for expression of Sox5 and Sox6. Genes & development 16, 2813–2828. - PMC - PubMed
    1. Alberti S, Gladfelter A, and Mittag T (2019). Considerations and Challenges in Studying Liquid-Liquid Phase Separation and Biomolecular Condensates. Cell 176, 419–434. - PMC - PubMed
    1. Albrecht A, and Mundlos S (2005). The other trinucleotide repeat: polyalanine expansion disorders. Curr Opin Genet Dev 15, 285–293. - PubMed
    1. Albrecht AN, Kornak U, Boddrich A, Suring K, Robinson PN, Stiege AC, Lurz R, Stricker S, Wanker EE, and Mundlos S (2004). A molecular pathogenesis for transcription factor associated polyalanine tract expansions. Human molecular genetics 13, 2351–2359. - PubMed
    1. Artimo P, Jonnalagedda M, Arnold K, Baratin D, Csardi G, de Castro E, Duvaud S, Flegel V, Fortier A, Gasteiger E, et al. (2012). ExPASy: SIB bioinformatics resource portal. Nucleic acids research 40, W597–603. - PMC - PubMed

Publication types

Supplementary concepts