. 2020 May 7;26(5):755-765.e7.
doi: 10.1016/j.stem.2019.12.006.

Hematopoietic Stem and Progenitor Cells Exhibit Stage-Specific Translational Programs via mTOR- and CDK1-Dependent Mechanisms

Affiliations

Hematopoietic Stem and Progenitor Cells Exhibit Stage-Specific Translational Programs via mTOR- and CDK1-Dependent Mechanisms

Christina C Spevak et al. Cell Stem Cell. .

Abstract

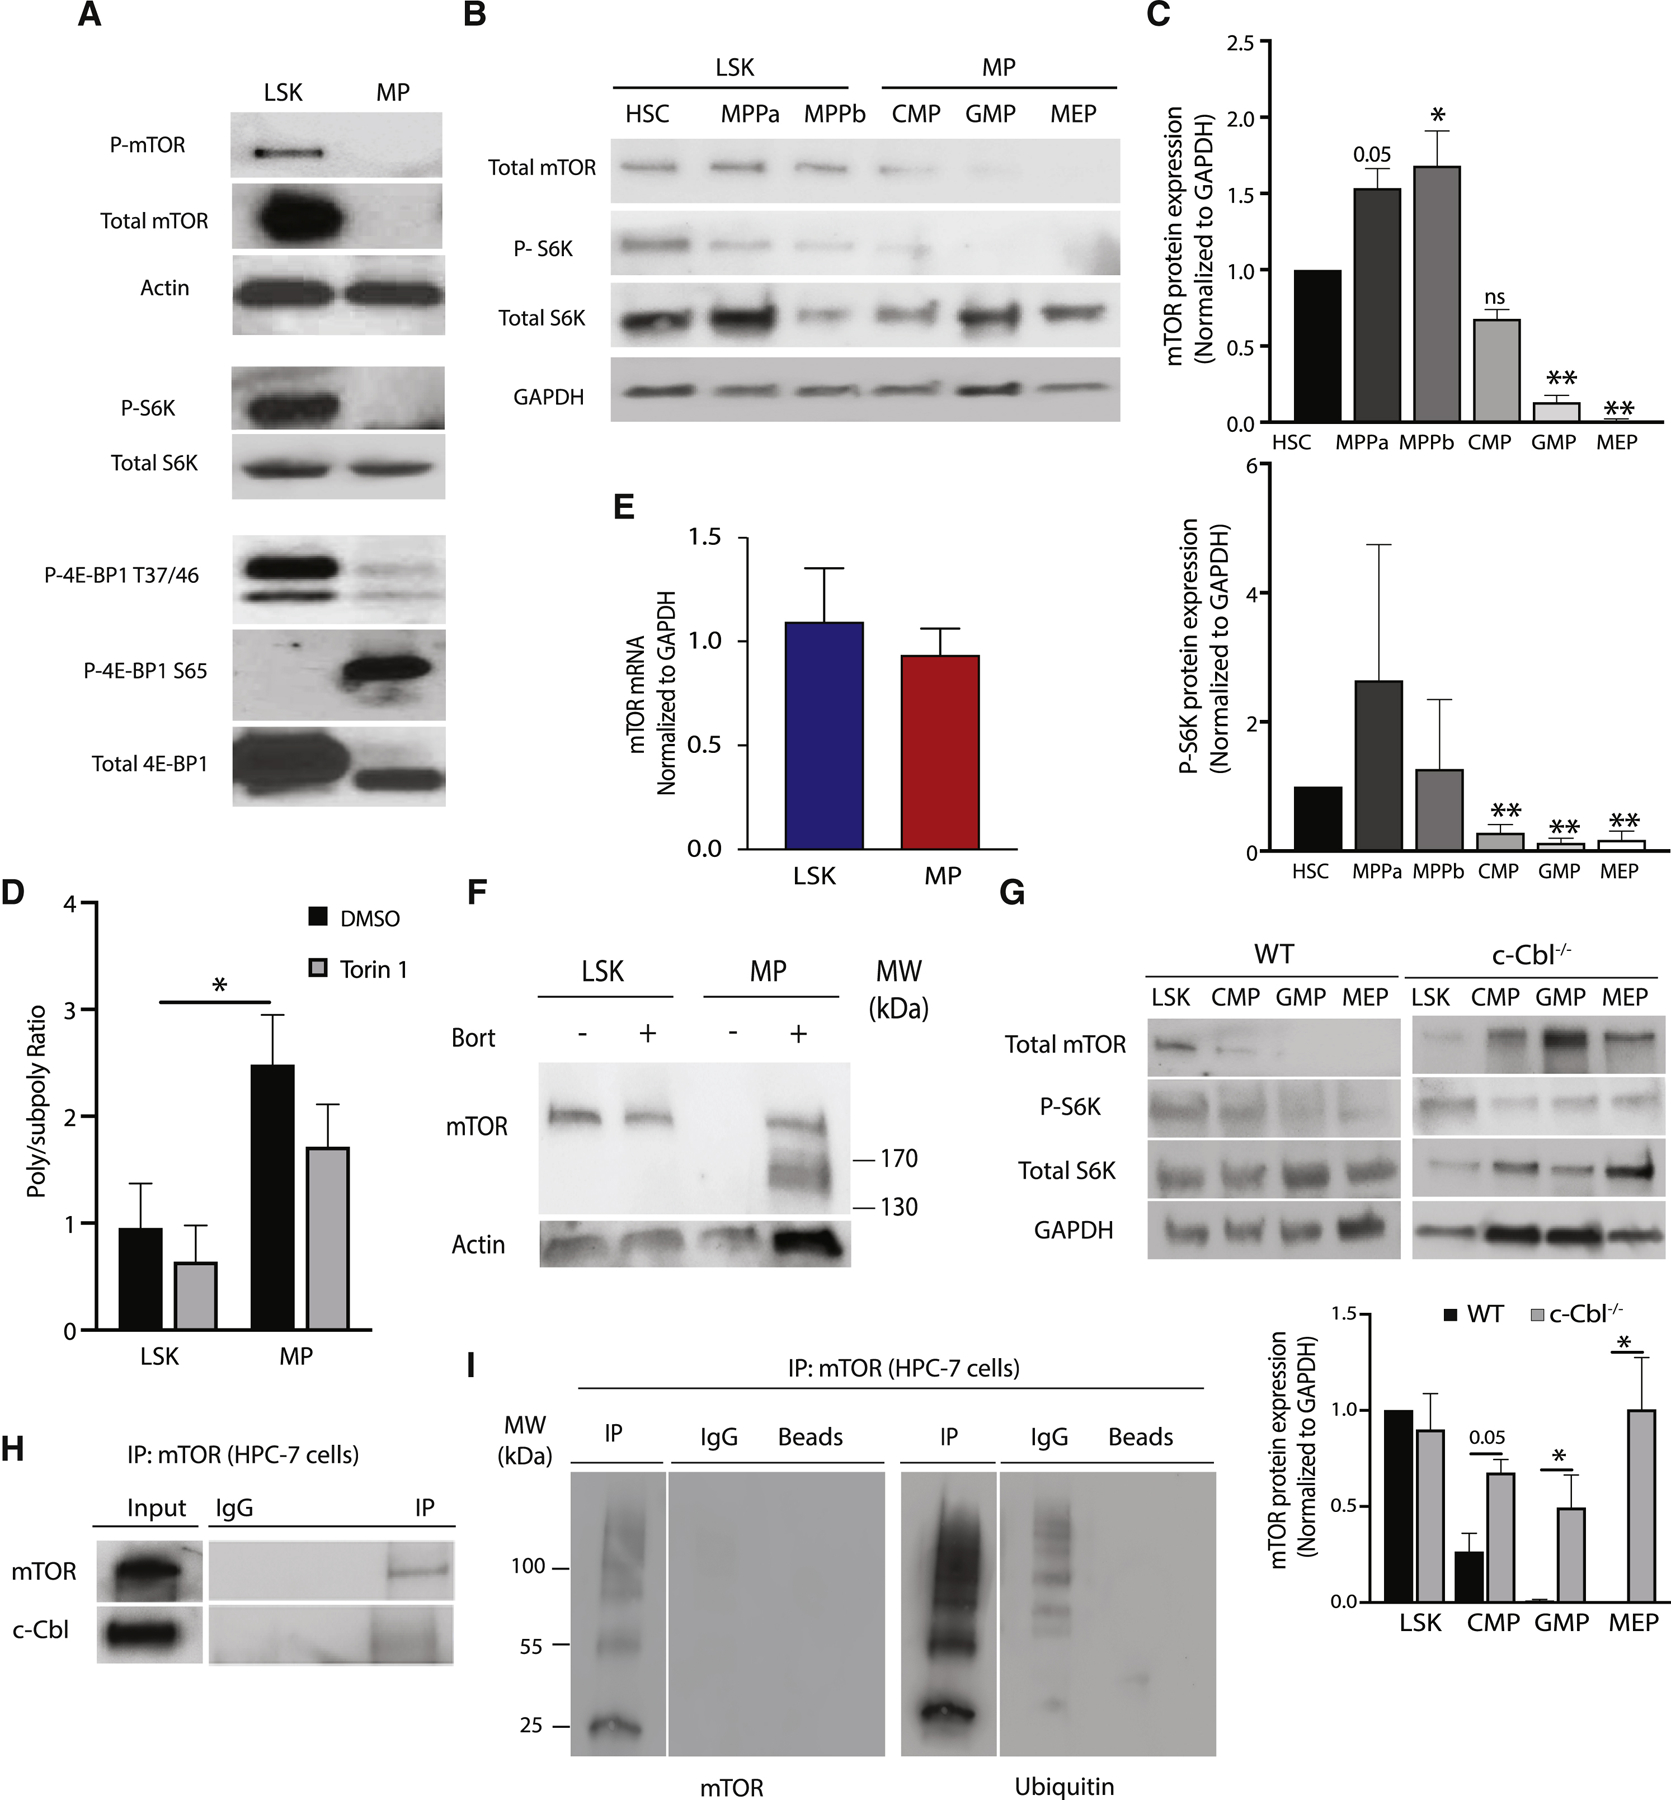
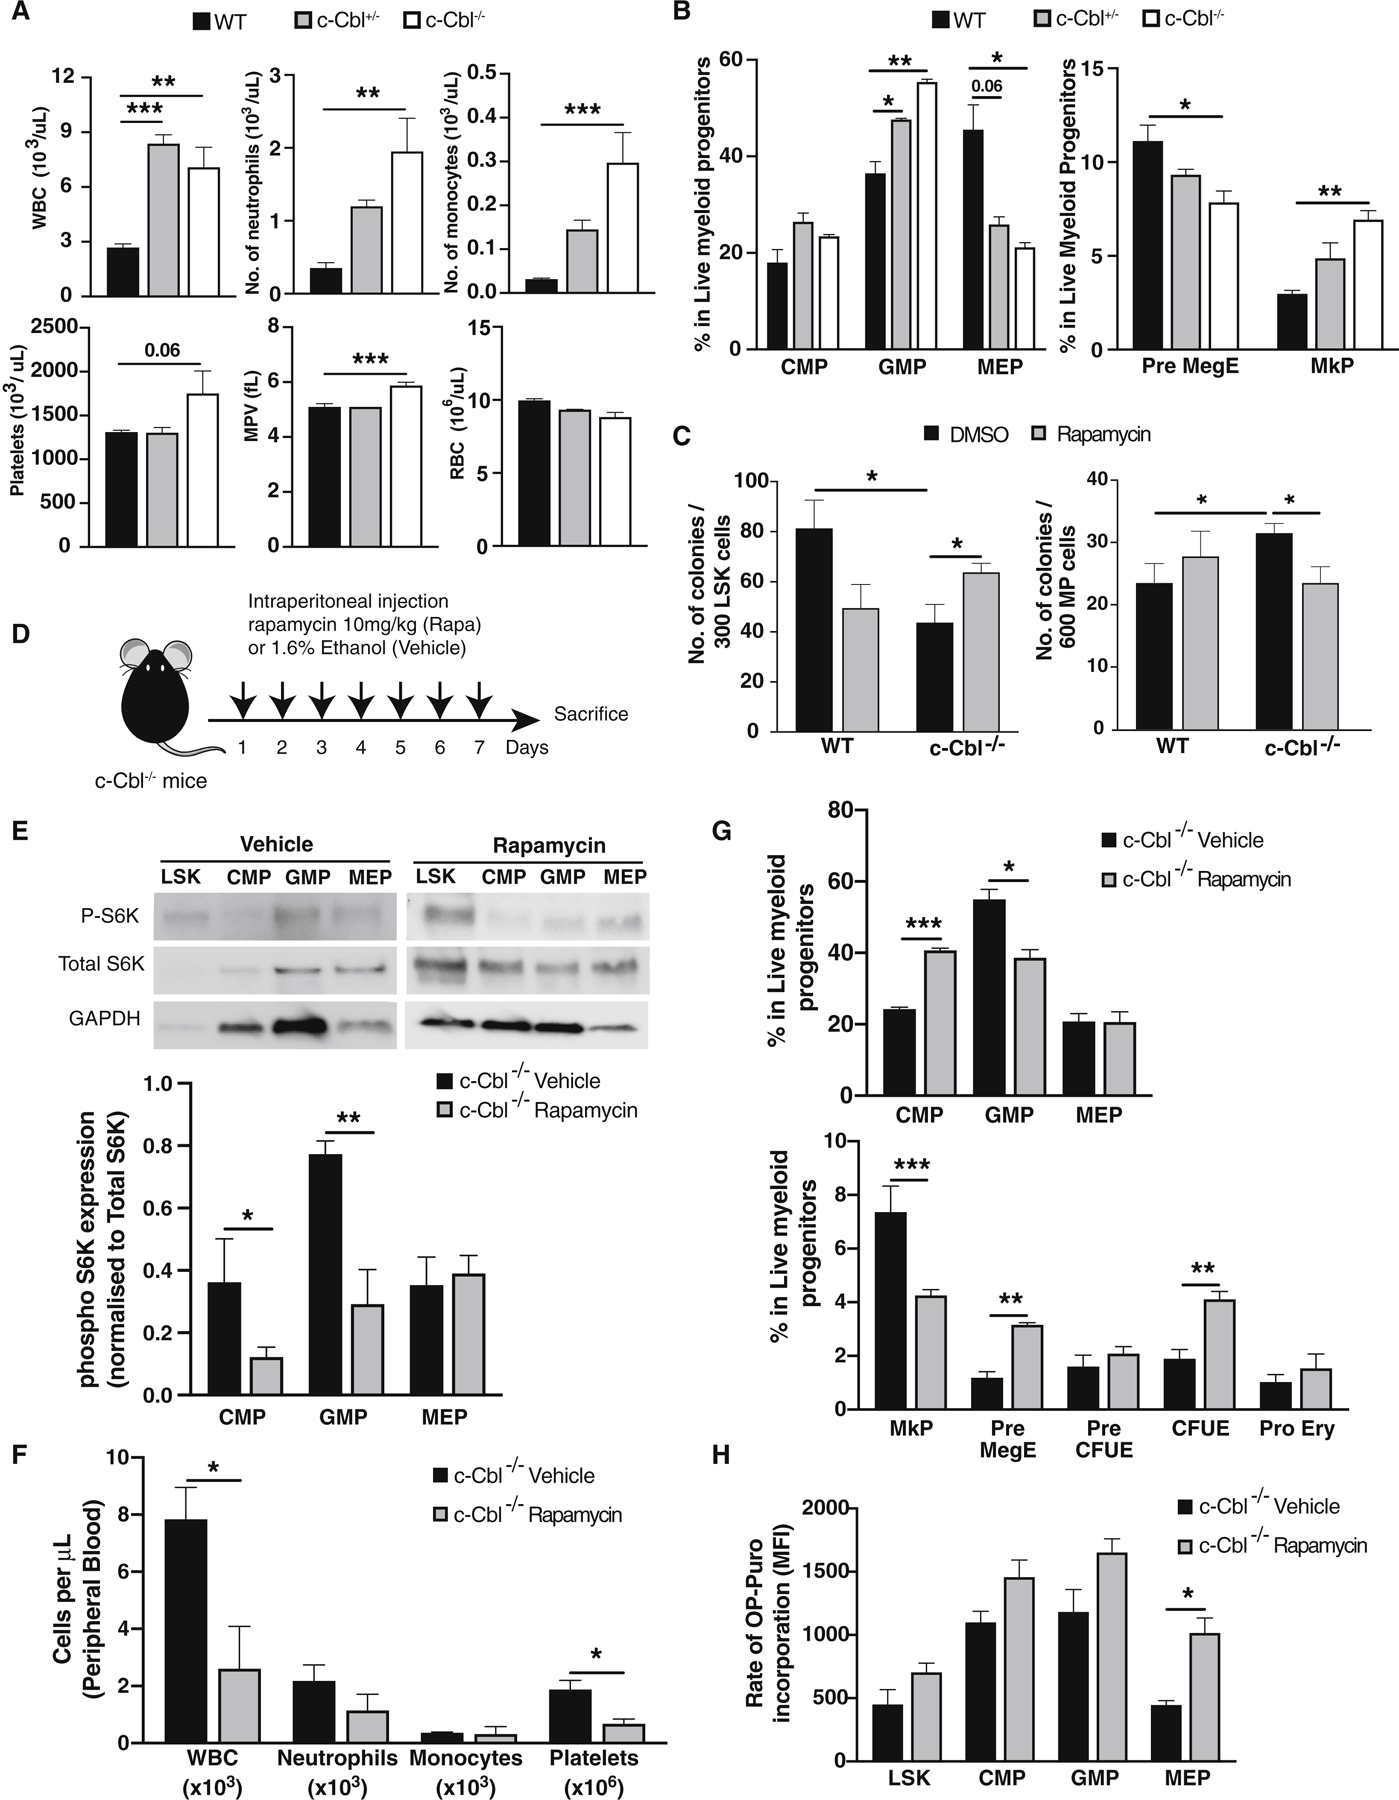
Hematopoietic stem cells (HSCs) require highly regulated rates of protein synthesis, but it is unclear if they or lineage-committed progenitors preferentially recruit transcripts to translating ribosomes. We utilized polysome profiling, RNA sequencing, and whole-proteomic approaches to examine the translatome in LSK (Lin-Sca-1+c-Kit+) and myeloid progenitor (MP; Lin-Sca-1-c-Kit+) cells. Our studies show that LSKs exhibit low global translation but high translational efficiencies (TEs) of mRNAs required for HSC maintenance. In contrast, MPs activate translation in an mTOR-independent manner due, at least in part, to proteasomal degradation of mTOR by the E3 ubiquitin ligase c-Cbl. In the near absence of mTOR, CDK1 activates eIF4E-dependent translation in MPs through phosphorylation of 4E-BP1. Aberrant activation of mTOR expression and signaling in c-Cbl-deficient MPs results in increased mature myeloid lineage output. Overall, our data demonstrate that hematopoietic stem and progenitor cells (HSPCs) undergo translational reprogramming mediated by previously uncharacterized mechanisms of translational regulation.

Keywords: hematopoiesis; mTOR; myeloid progenitors; polysome; proteomics; ribosome; stem cells; transcriptome; translation; ubiquitination.


Conflict of interest statement

Declaration of Interests The authors declare no competing interests.

Figures

Figure 1.
Figure 1.. LSK and MP cells exhibit unique translational programs.
(A) Schematic of cell populations evaluated (top). Representative polysome profiles from LSK (LinSca-1+c-Kit+) and MP (LinSca-1c-Kit+) cells. 28S and 18S ribosomal RNA bands from total RNA prepared from each fraction are shown. Polysome/subpolysome RNA ratios (poly/subpoly) were calculated by dividing total RNA from polysomes (fractions 5–10) by total RNA in subpolysomes (fractions 1–4) (n=3, p < 0.05). (B) Comparison of differentially expressed genes based on total RNA or TE. More differentially expressed genes are highly expressed in LSK compared to MP cells based on total RNA (top). Breakdown of differential gene expression based on TE (bottom): high TE in LSK (green), high TE in MP (blue), no difference in TE or protein expression between LSK and MP cells (gray). (C) Integration of RNA-seq and whole proteome data. Differentially expressed genes based on total RNA-seq and protein expression in LSK versus MP cells (top panel). Number of genes in each quadrant is indicated and also expressed as a percentage of all differentially expressed genes identified. Comparison of TE to protein expression in LSK and MP cells for group II and IV genes in the top panel (bottom panel). (D) Heatmap showing pathways significantly enriched in LSK or MP cells based on TE. (E) Enrichment plots for pathways enriched in LSK cells based on TE (left) or total RNA expression (right).
Figure 2.
Figure 2.. Myeloid progenitors degrade mTOR protein in a c-Cbl dependent manner.
(A) Representative immunoblot assessing mTOR signaling mediators in LSK and MP cells. (B) Representative immunoblot of mTOR signaling mediators in hematopoietic stem and myeloid progenitor cell populations present within LSK (HSC, MPPa, MPPb) and MP (CMP, GMP and MEP) populations. (C) Quantitation of total mTOR and phosphorylated p70S6K was performed by normalizing to GAPDH and total S6K expression, respectively (n = 3), in hematopoietic stem and myeloid progenitor cell populations. (D) Poly/subpoly RNA ratios for WT LSK and MP cells following ex vivo treatment with Torin 1 or DMSO for 2 hours. (E) qPCR for mTOR mRNA in LSK and MP cells (n=4). (F) Immunoblot for mTOR after in vivo bortezomib treatment of WT mice. Equal numbers (100,000 cells) of LSK and MP cells were analyzed. (G) Immunoblots and quantitation of mTOR in LSK and MP subpopulations (CMP, GMP, MEP) from WT and c-Cbl−/− mice. Representative immunoblots shown (n=3). (H) Representative immunoprecipitation experiment of mTOR in the mouse hematopoietic progenitor cell line, HPC-7 (n=3). (I) Immunoblots for ubiquitin following immunoprecipitation with mTOR or control antibodies from HPC-7 lysates.
Figure 3.
Figure 3.. Loss of c-Cbl results in aberrant mTOR signaling in myeloid progenitors and increased mature myeloid cell output.
(A) Complete blood counts from WT, c-Cbl+/− and c-Cbl−/− mice (n=4–5). (B) Flow cytometric analysis of bone marrow cells in the myeloid progenitor (MP) compartment from WT, c-Cbl+/−, and c-Cbl−/− mice. Frequencies were determined using mononuclear cells from two femurs and two tibiae (n = 3–4 mice). (C) Colony forming activity of WT and c-Cbl−/− LSK and MP cells plated in complete methylcellulose for 8 days treated with DMSO or rapamycin (20nM) (n=3). (D) Experimental scheme for in vivo rapamycin treatment studies in c-Cbl−/− mice (n=3/group). (E) Representative immunoblots of mTOR signaling intermediates in LSK and MP subpopulations (CMP, GMP and MEP) from rapamycin treated mice. Phosphorylated p70S6K was quantified by normalizing to both total S6K and GAPDH expression (n=3). (F) Complete blood counts in vehicle and rapamycin treated c-Cbl−/− mice. (G) Flow cytometric analysis of bone marrow MP subpopulations in vehicle and rapamycin treated c-Cbl−/− mice. (H) OP-Puro incorporation assays in LSK and MP cells from vehicle and rapamycin treated c-Cbl−/− mice.
Figure 4.
Figure 4.. Cyclin Dependent Kinase-1 (CDK1) mediates 4E-BP1 Ser-65 phosphorylation and activates eIF4E-(cap)-dependent translation in myeloid progenitors.
(A) Expression of detectable cyclin-dependent kinase family members in LSK and MP cells as determined by mass spectrometry (PSM, peptide spectral matches) (n=3). (B) Immunoblot and quantitation of CDK1 expression in LSK and MP cells. Representative blot shown (n=3). (C) Immunoblot and quantitation of CDK1 and phosphorylated 4E-BP1 Ser-65 in MP cells treated with DMSO or RO-3306 (10uM) for 2 hours. Representative blot shown (n=3). (D) Immunoprecipitation experiment of CDK1 in MP cells treated with DMSO or RO-3066 for 2 hours. Representative blot shown (n=3). (E) Immunoprecipitation experiment of transfected WT and 4E-BP1 phosphorylation site mutants (T37A. T46A, and S65A) constructs in HEK-293T cells. Representative blot shown (n=2). (F) Immunoblot of cap-bead binding experiments performed with WT LSK and MP cells following 2-hour treatment with DMSO vehicle or RO-3306 (top panel). Quantitation of eIF4E bound to cap-beads in LSK and MP cells (bottom panel) Representative blot shown (n=3). (G) Poly/sub poly RNA ratios in WT LSK and MPs cells following 2-hour ex vivo treatment (n=4). (H) Colony forming activity of LSK and MP cells following treatment (n=3). (I) Absolute number of live LSK and MP cells in CFC assays on day 8, following treatment (n=3). (J) Model for translational reprogramming in early hematopoiesis. Despite lower total global translation, LSK cells exhibit mTOR signal activation and preferentially translate mTOR activated mRNAs as well as mRNAs required for HSC maintenance. In contrast, MP cells shows increased global translation despite proteasome-mediated mTOR protein degradation, stimulated by the E3 ubiquitin ligase activity of c-Cbl. Aberrant mTOR expression in MPs has significant consequences, resulting in increased mature myeloid cell output. In the absence of mTOR in MPs, eIF4E-cap-dependent translation is activated through the action of CDK1, which phosphorylates the S65 residue of 4E-BP1, allowing release of eIF4E.

References

    1. An W, Nadeau SA, Mohapatra BC, Feng D, Zutshi N, Storck MD, Arya P, Talmadge JE, Meza JL, Band V, et al. (2015). Loss of Cbl and Cbl-b ubiquitin ligases abrogates hematopoietic stem cell quiescence and sensitizes leukemic disease to chemotherapy. Oncotarget 6, 10498–10509. - PMC - PubMed
    1. Araki K, Morita M, Bederman AG, Konieczny BT, Kissick HT, Sonenberg N, and Ahmed R (2017). Translation is actively regulated during the differentiation of CD8(+) effector T cells. Nat Immunol 18, 1046–1057. - PMC - PubMed
    1. Bilanges B, Argonza-Barrett R, Kolesnichenko M, Skinner C, Nair M, Chen M, and Stokoe D (2007). Tuberous sclerosis complex proteins 1 and 2 control serum-dependent translation in a TOP-dependent and -independent manner. Mol Cell Biol 27, 5746–5764. - PMC - PubMed
    1. Gingras AC, Raught B, Gygi SP, Niedzwiecka A, Miron M, Burley SK, Polakiewicz RD, Wyslouch-Cieszynska A, Aebersold R, and Sonenberg N (2001). Hierarchical phosphorylation of the translation inhibitor 4E-BP1. Genes Dev 15, 2852–2864. - PMC - PubMed
    1. Guertin DA, Stevens DM, Thoreen CC, Burds AA, Kalaany NY, Moffat J, Brown M, Fitzgerald KJ, and Sabatini DM (2006). Ablation in mice of the mTORC components raptor, rictor, or mLST8 reveals that mTORC2 is required for signaling to Akt-FOXO and PKCalpha, but not S6K1. Dev Cell 11, 859–871. - PubMed

Publication types

MeSH terms

Substances