. 2020 Jun 4;106(6):893-904.
doi: 10.1016/j.ajhg.2020.04.005. Epub 2020 May 7.

Mutations in the Kinesin-2 Motor KIF3B Cause an Autosomal-Dominant Ciliopathy

Collaborators, Affiliations

Mutations in the Kinesin-2 Motor KIF3B Cause an Autosomal-Dominant Ciliopathy

Benjamin Cogné et al. Am J Hum Genet. .

Abstract

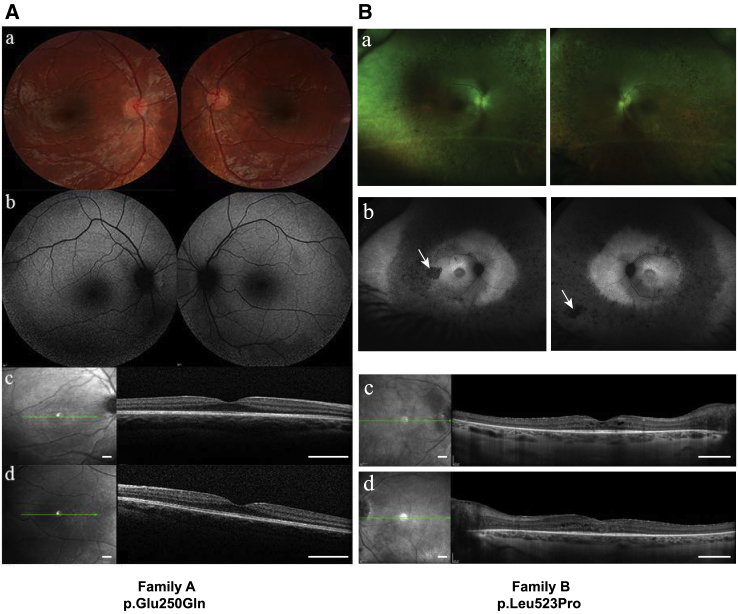
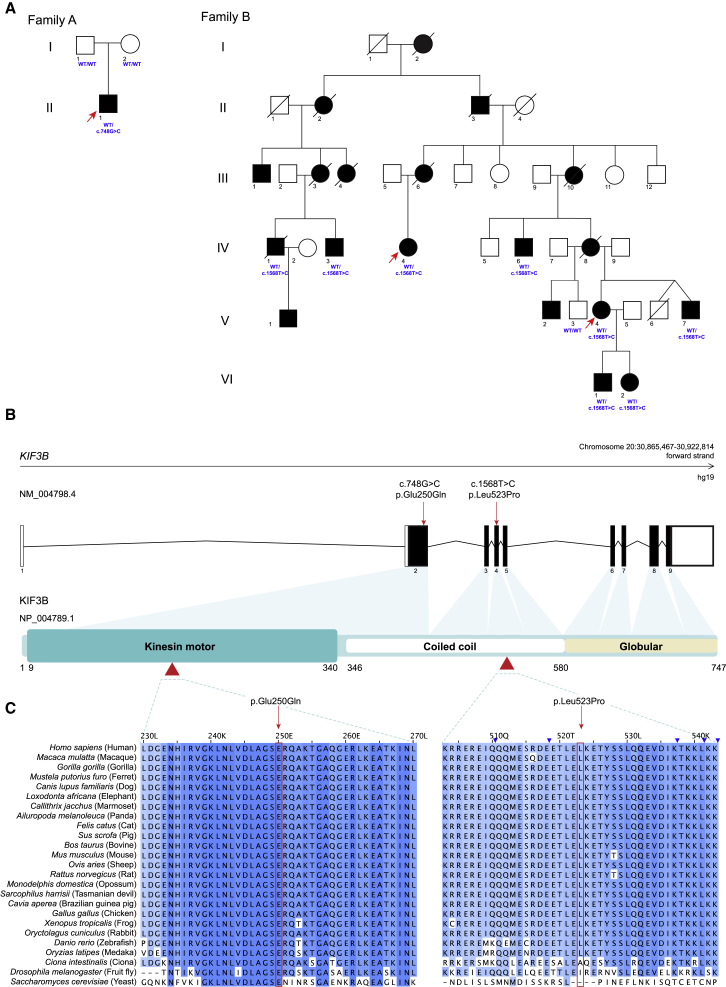
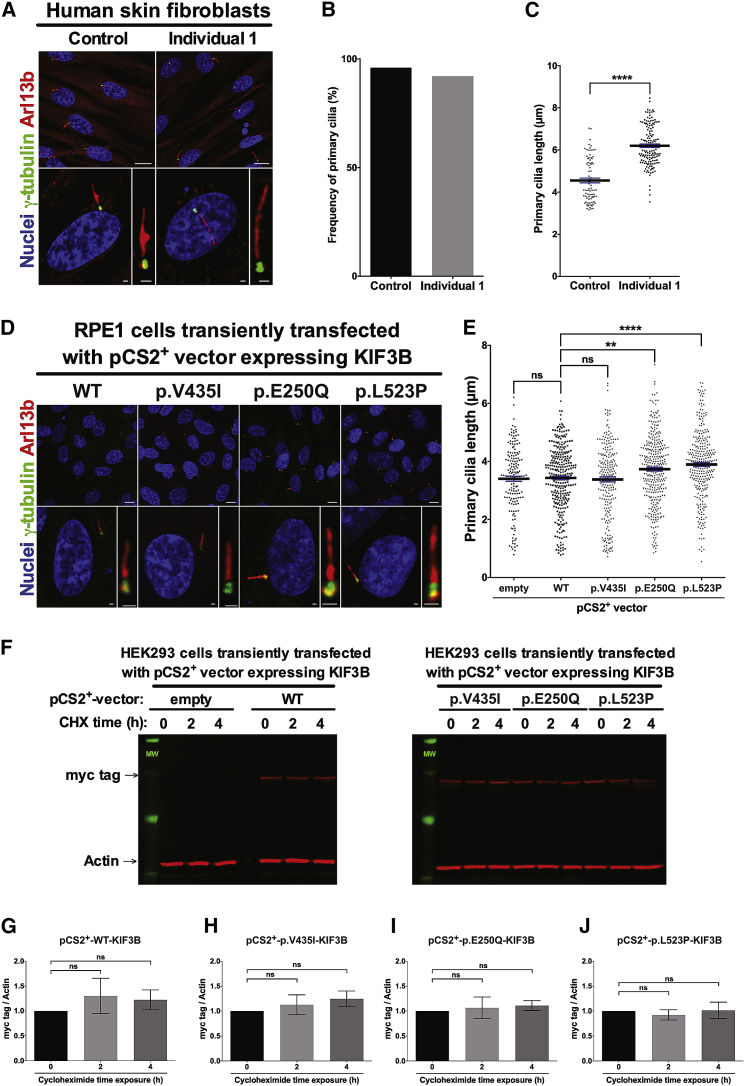
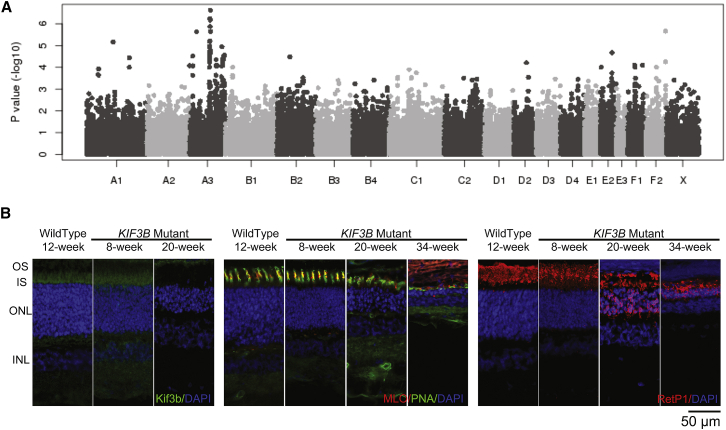
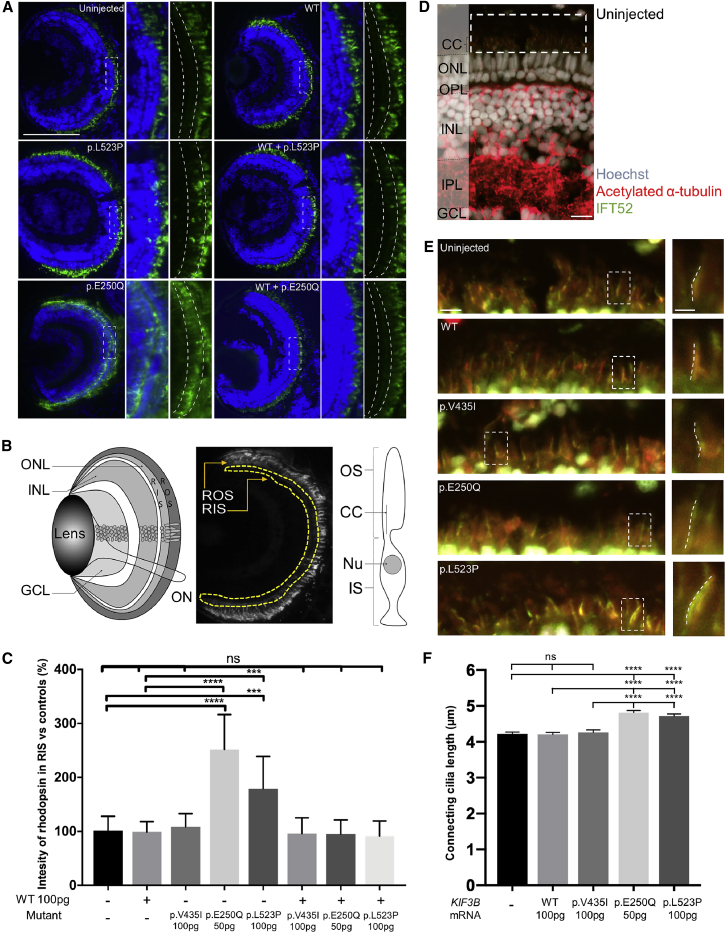
Kinesin-2 enables ciliary assembly and maintenance as an anterograde intraflagellar transport (IFT) motor. Molecular motor activity is driven by a heterotrimeric complex comprised of KIF3A and KIF3B or KIF3C plus one non-motor subunit, KIFAP3. Using exome sequencing, we identified heterozygous KIF3B variants in two unrelated families with hallmark ciliopathy phenotypes. In the first family, the proband presents with hepatic fibrosis, retinitis pigmentosa, and postaxial polydactyly; he harbors a de novo c.748G>C (p.Glu250Gln) variant affecting the kinesin motor domain encoded by KIF3B. The second family is a six-generation pedigree affected predominantly by retinitis pigmentosa. Affected individuals carry a heterozygous c.1568T>C (p.Leu523Pro) KIF3B variant segregating in an autosomal-dominant pattern. We observed a significant increase in primary cilia length in vitro in the context of either of the two mutations while variant KIF3B proteins retained stability indistinguishable from wild type. Furthermore, we tested the effects of KIF3B mutant mRNA expression in the developing zebrafish retina. In the presence of either missense variant, rhodopsin was sequestered to the photoreceptor rod inner segment layer with a concomitant increase in photoreceptor cilia length. Notably, impaired rhodopsin trafficking is also characteristic of recessive KIF3B models as exemplified by an early-onset, autosomal-recessive, progressive retinal degeneration in Bengal cats; we identified a c.1000G>A (p.Ala334Thr) KIF3B variant by genome-wide association study and whole-genome sequencing. Together, our genetic, cell-based, and in vivo modeling data delineate an autosomal-dominant syndromic retinal ciliopathy in humans and suggest that multiple KIF3B pathomechanisms can impair kinesin-driven ciliary transport in the photoreceptor.

Keywords: KIF3B; feline genetics; hepatic fibrosis; kinesin; primary cilia; retinopathy; whole-exome sequencing; zebrafish.


Conflict of interest statement

N.K. is a paid consultant for and holds significant stock of Rescindo Therapeutics, Inc.

Figures

Figure 1
Figure 1
Individuals Harboring Nonsynonymous KIF3B Variants Display Retinal Phenotypes (A) Ophthalmological examination of individual 1 (family A) who harbors a de novo c.748G>C (p.Glu250Gln) KIF3B variant. Shown are (a) ophthalmological fundus imaging of the right and the left eyes; (b) fundus autofluorescence imaging of the right and the left eyes; (c) spectral domain optical tomography of the right fovea (scale: 1 mm); and (d) spectral domain optical tomography of the left fovea (scale: 1 mm). Refraction was performed under cyploplegia with chlorhydrate of cyclopentolate 0.5% (Alcon). Optical coherence tomography (OCT) analysis and the autofluorescence fundus imaging were conducted with an OCT spectal domain (Heidelberg Engineering, Spectralis HRA-OCT). (B) Ophthalmological examination of individual VI-2 (family B) who harbors a c.1569T>C (p.Leu523Pro) KIF3B variant. White arrows indicate retinal pigments characteristic of retinitis pigmentosa. Shown are (a) ophthalmological fundus imaging of the right and the left eyes; (b) fundus autofluorescence imaging of the right and the left eyes; (c) spectral domain optical tomography of the right fovea (scale: 1 mm); and (d) spectral domain optical tomography of the left fovea (scale: 1 mm).
Figure 2
Figure 2
Heterozygous Nonsynonymous Variants in KIF3B Segregate with Ciliopathy Phenotypes in Dominant Pedigrees (A) Pedigrees of families A and B with segregation of KIF3B variants. Filled circles and squares represent affected female or male individuals, respectively; unfilled circles and squares represent unaffected female or male individuals; respectively. Deceased individuals are indicated by diagonal lines. Exome sequencing was performed for individuals marked with an arrow. Individual genotypes at the KIF3B locus are indicated in blue. All affected individuals in family B carried the KIF3B c.1568T>C (p.Leu523Pro) encoding variant (IV-1, IV-3, IV-4, IV-6, V-4, V-7, VI-1, VI-2) but the unaffected individual (V-3) was WT. (B) Schematic of KIF3B gene organization and protein domains. Untranslated exons, white boxes; translated exons, black boxes; red arrows and arrowheads, KIF3B variants identified in humans. Kinesin motor, coiled coil, and globular domains (UniProtKB, PROSITE annotations, GenBank: NP_004789.1) are indicated. (C) Conservation of 40 amino acid blocks impacted by nonsynonymous changes shown with a multiple sequence alignment (Clustal W v1.81) of 25 species sorted by pairwise identity. Red boxes, variant residues; blue shading of amino acids from dark to light represents most to least conserved, respectively. UniProtKB identifiers: Homo sapiens, O15066; Macaca mulatta, F6S877; Gorilla gorilla, G3RAF7; Mustela putorius furo, M3Z2F0; Canis lupus familiaris, E2QUS2; Loxodonta africana, G3T0G8; Callithrix jacchus, F7IBN6; Ailuropoda melanoleuca, G1M429; Felis catus, A0A2I2UKW2; Sus scrofa, F1S519; Bos taurus, F1N020; Mus musculus, Q61771; Ovis aries, W5NZV7; Rattus norvegicus, D3ZI07; Monodelphis domestica, F6RWN1; Sarcophilus harrisii, G3WA27; Cavia aperea, ENSCAPP00000010080 (ensembl, UniProtKB identifier not available); Gallus gallus, Q5F423; Xenopus tropicalis, F6R640; Oryctolagus cuniculus, G1U1D0; Danio rerio, F1QN54; Oryzias latipes, H2LAE9; Ciona intestinalis, F7B875; Drosophila melanogaster, P46867; Saccharomyces cerevisiae, P28742.
Figure 3
Figure 3
KIF3B p.Glu250Gln and p.Leu523Pro Variants Increase Primary Cilia Length (A) Representative confocal images of primary human fibroblasts from the family A proband. Cells were methanol-fixed and immunostained with anti-ARL13b rabbit polyclonal antibody (red) and anti-γ-tubulin mouse IgG1 monoclonal antibody (green) and mounted with DAPI-Fluoromount G (blue) as markers of the primary cilium, basal body, and nuclei, respectively. Scale bars: 10 μm (top row) and 1 μm (bottom row). See Table S3 for details about antibodies used. (B) Frequency of ciliated cells in primary skin fibroblasts from individual 1 (family A) and a matched control subject. (C) Quantification of the primary cilia length measured on cells from a matched human control (4.55 ± 0.11 μm, n = 82) and individual 1 (family A) primary fibroblasts (6.20 ± 0.08 μm, n = 141). For (B) and (C), six random images were assessed for each of control and affected; two independent replicates. (D) Representative confocal images of hTERT-RPE1 cells transiently transfected with pCS2+-KIF3B-myc vectors and immunostained with anti-ARL13b (red) and anti-γ-tubulin (green) and mounted with DAPI-Fluoromount G as markers of the primary cilium, basal body, and nuclei, respectively. Scale bars: 10 μm (top row) and 1 μm (bottom row). (E) Quantification of primary cilia length of hTERT-RPE1 cells transiently transfected with pCS2+-empty (3.40 ± 0.09 μm, n = 166), pCS2+-KIF3B-WT-myc (3.43 ± 0.06 μm, n = 302), pCS2+-KIF3B-p.V435I-myc (3.38 ± 0.09 μm, n = 233), pCS2+-KIF3B-p.E250Q-myc (3.73 ± 0.07 μm, n = 341), and pCS2+-KIF3B-p.L523P-myc (3.89 ± 0.07 μm, n = 303) vectors. Data are collected from six independent replicate experiments. (F) Western blot analysis of myc tag (KIF3B protein levels) and actin in HEK293 cells transiently transfected with pCS2+-KIF3B-myc vectors and exposed 48 h post transfection to 50 μM cycloheximide for 0, 2, and 4 h. (G–J) Quantitative analysis of immunoblotting results shown in (F); myc tag (KIF3B protein levels) was normalized to actin in transiently transfected HEK293 cells and data are shown relative to pCS2+-KIF3B-WT-myc vector. Performed in biological triplicates. Data in all panels represent mean ± SEM. Statistical comparisons were performed with two-tailed unpaired t test (GraphPad PRISM software). ns, not significant, ∗∗p < 0.01; ∗∗∗∗p < 0.0001.
Figure 4
Figure 4
A Recessive c.1000G>A (p.Ala334Thr) Mutation in KIF3B Is a Likely Cause for Progressive Retinal Atrophy in Bengal Cats (A) Manhattan plot of GWAS for cat progressive retinal atrophy. After Bonferroni correction, several SNPs on cat chromosome A3 suggest a significant association with Bengal cat progressive retinal atrophy (Table S5). Cat chromosome A3 has genes homologous to human chromosome 20. (B) Morphological and cellular changes as analyzed by immunohistochemistry. Left panel, anti-Kif3b antibody labels the region of the photoreceptor inner segment (IS) in wild-type cats. Similar labeling was detectable in sections from 8-week-old KIF3B homozygous mutants, but not in sections from 20-week-old mutant kittens. See Table S3 for details of antibodies used. Central panel, combination staining of the cone markers peanut agglutinin (PNA; cone sheath) with cone ML opsin (MLO). Cone morphology in KIF3B mutants at 8 weeks appears relatively normal but by 20 weeks there was distortion and stunting of outer segments with reduced ML opsin labeling. By 34 weeks of age, only short residual PNA labeling material remained with reduced ML opsin labeling. The outer nuclear layer (ONL) was progressively thinned. Right panel, labeling with a rhodopsin marker (RetP1). Rhodopsin is mislocalized in mutants to the inner segment as early as 8 weeks of age, then mislocalized to the outer nuclear layer cells bodies and synaptic terminals by 20 weeks. The rod inner and outer segments (OS) also showed some degeneration with disease progression.
Figure 5
Figure 5
Retinal Phenotypes in Zebrafish Larvae with Heterologous Mutant KIF3B Expression (A) Representative images of optic sections obtained from 5 dpf larvae and immunostained with anti-rhodopsin mouse monoclonal antibody (green) and Hoechst stain (blue). Dashed boxes indicate insets (right; with and without Hoescht). Dashed curved lines in insets demarcate rod inner segment (RIS). Scale bar: 50 μm, with equivalent scaling for each condition. (B) Schematic of the zebrafish larval eye (left). GCL, ganglion cell layer; INL, inner nuclear layer; ONL, outer nuclear layer; ON, optic nerve. Schematic to indicate measurement of rhodopsin intensity in RIS of optic sections obtained from 5 dpf larvae (center). Area of interest is within yellow dashed lines; ROS, rod outer segment. Schematic of a rod photoreceptor (right). IS, inner segment; OS, outer segment. (C) Quantification of rhodopsin intensity of RIS in optic sections (A and B) normalized to controls in 5 dpf larvae. n = 10 larvae per condition, repeated twice with similar results. Error bars indicate standard deviation (SD) of the mean. (D) Representative merged image of an optic section obtained from a 5 dpf uninjected larva that was immunostained with anti-acetylated α-tubulin mouse monoclonal antibody (red, ciliary axoneme), anti-IFT52 rabbit polyclonal antibody (green, anterograde IFT), and Hoechst staining (gray; nuclei). CC, connecting cilium; OPL, outer plexiform layer; IPL, inner plexiform layer. Scale bar, 10 μm. Note that in addition to ciliary microtubules, anti-acetylated α-tubulin stains axon tracts throughout the retina. (E) Left, representative magnified views with enhanced contrast to enable visualization of connecting cilia (equivalent across images; see dashed white box in D), scale bar: 5 μm, with equivalent scaling for each condition; right, insets show a magnified view of a representative connecting cilium (see dashed white box at left); dashed lines indicate ciliary length measurement, scale bar: 2 μm, with equivalent scaling for each condition. (F) Quantification of photoreceptor connecting cilia length in 5 dpf retinas. n = 10–12 larvae per condition, n = 174–246 cilia per retina, repeated twice with similar results. Error bars indicate standard error of the mean (SEM). Statistical comparisons were performed with a non-parametric one-way ANOVA followed by Tukey’s multiple comparison (GraphPad PRISM software; v.7.0c). ∗∗∗∗p < 0.0001, ∗∗∗p < 0.001; ns, not significant; WT, wild type; p.Glu250Gln and p.Leu523Pro are variants identified in cases; p.Val435Ile is a negative control (rs41288638; 230/276,748 alleles in gnomAD). See Table S3 for antibodies used.

References

    1. Reilly M.L., Stokman M.F., Magry V., Jeanpierre C., Alves M., Paydar M., Hellinga J., Delous M., Pouly D., Failler M. Loss of function mutations in KIF14 cause severe microcephaly and kidney development defects in humans and zebrafish. Hum. Mol. Genet. 2019;28:778–795. - PMC - PubMed
    1. Goetz S.C., Anderson K.V. The primary cilium: a signalling centre during vertebrate development. Nat. Rev. Genet. 2010;11:331–344. - PMC - PubMed
    1. Badano J.L., Mitsuma N., Beales P.L., Katsanis N. The ciliopathies: an emerging class of human genetic disorders. Annu. Rev. Genomics Hum. Genet. 2006;7:125–148. - PubMed
    1. van Dam T.J., Wheway G., Slaats G.G., Huynen M.A., Giles R.H., SYSCILIA Study Group The SYSCILIA gold standard (SCGSv1) of known ciliary components and its applications within a systems biology consortium. Cilia. 2013;2:7. - PMC - PubMed
    1. Kumar P., Henikoff S., Ng P.C. Predicting the effects of coding non-synonymous variants on protein function using the SIFT algorithm. Nat. Protoc. 2009;4:1073–1081. - PubMed

Publication types

MeSH terms