

Common Genetic Variants Modulate the Electrocardiographic Tpeak-to-Tend Interval
- PMID: 32386560
- PMCID: PMC7273524
- DOI: 10.1016/j.ajhg.2020.04.009
Common Genetic Variants Modulate the Electrocardiographic Tpeak-to-Tend Interval
Abstract
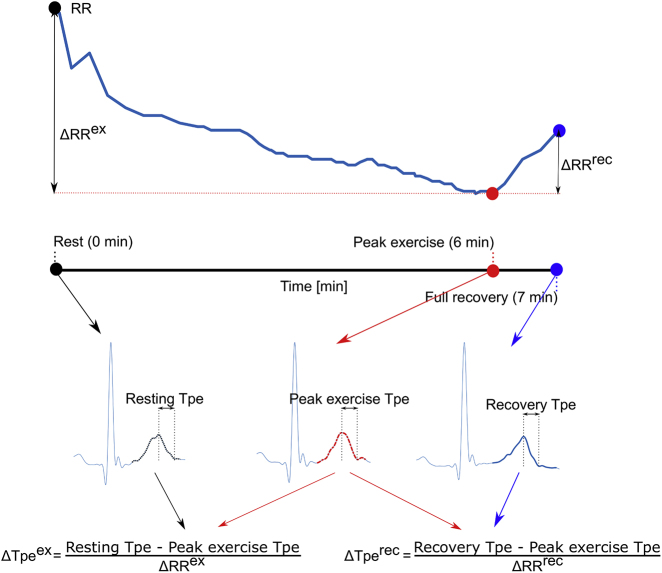
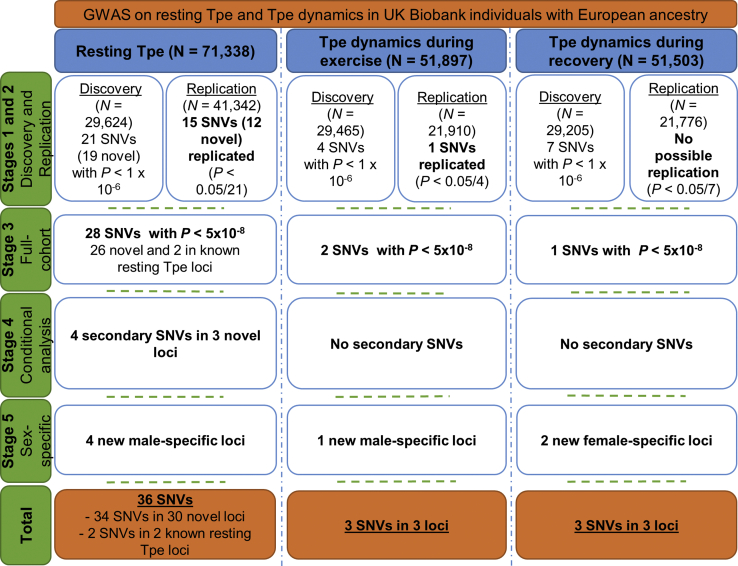
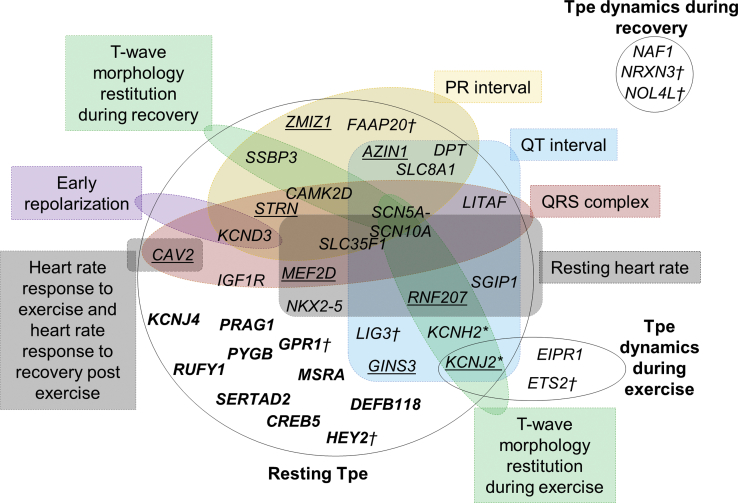
Sudden cardiac death is responsible for half of all deaths from cardiovascular disease. The analysis of the electrophysiological substrate for arrhythmias is crucial for optimal risk stratification. A prolonged T-peak-to-Tend (Tpe) interval on the electrocardiogram is an independent predictor of increased arrhythmic risk, and Tpe changes with heart rate are even stronger predictors. However, our understanding of the electrophysiological mechanisms supporting these risk factors is limited. We conducted genome-wide association studies (GWASs) for resting Tpe and Tpe response to exercise and recovery in ∼30,000 individuals, followed by replication in independent samples (∼42,000 for resting Tpe and ∼22,000 for Tpe response to exercise and recovery), all from UK Biobank. Fifteen and one single-nucleotide variants for resting Tpe and Tpe response to exercise, respectively, were formally replicated. In a full dataset GWAS, 13 further loci for resting Tpe, 1 for Tpe response to exercise and 1 for Tpe response to exercise were genome-wide significant (p ≤ 5 × 10⁻⁸). Sex-specific analyses indicated seven additional loci. In total, we identify 32 loci for resting Tpe, 3 for Tpe response to exercise and 3 for Tpe response to recovery modulating ventricular repolarization, as well as cardiac conduction and contraction. Our findings shed light on the genetic basis of resting Tpe and Tpe response to exercise and recovery, unveiling plausible candidate genes and biological mechanisms underlying ventricular excitability.
Keywords: T-peak-to-T-end interval; cardiac conduction and contraction; cardiovascular dynamics; electrocardiogram; genetic risk score; genetics; genome-wide association study; sudden cadiac death; ventricular arrhythmias; ventricular repolarization.
Copyright © 2020 The Authors. Published by Elsevier Inc. All rights reserved.
Conflict of interest statement
The authors declare no competing interests.
Figures
Similar articles
-
A common variant near the KCNJ2 gene is associated with T-peak to T-end interval.Heart Rhythm. 2012 Jul;9(7):1099-103. doi: 10.1016/j.hrthm.2012.02.019. Epub 2012 Feb 15. Heart Rhythm. 2012. PMID: 22342860 Free PMC article.
-
Genetic Basis and Prognostic Value of Exercise QT Dynamics.Circ Genom Precis Med. 2020 Aug;13(4):e002774. doi: 10.1161/CIRCGEN.119.002774. Epub 2020 Jun 11. Circ Genom Precis Med. 2020. PMID: 32527199 Free PMC article.
-
Plasma potassium concentration and cardiac repolarisation markers, Tpeak-Tend and Tpeak-Tend/QT, during and after exercise in healthy participants and in end-stage renal disease.Eur J Appl Physiol. 2022 Mar;122(3):691-702. doi: 10.1007/s00421-021-04870-7. Epub 2022 Jan 20. Eur J Appl Physiol. 2022. PMID: 35048183
-
Common genetic variation modulating cardiac ECG parameters and susceptibility to sudden cardiac death.J Mol Cell Cardiol. 2012 Mar;52(3):620-9. doi: 10.1016/j.yjmcc.2011.12.014. Epub 2012 Jan 8. J Mol Cell Cardiol. 2012. PMID: 22248531 Review.
-
Traditional and novel electrocardiographic conduction and repolarization markers of sudden cardiac death.Europace. 2017 May 1;19(5):712-721. doi: 10.1093/europace/euw280. Europace. 2017. PMID: 27702850 Review.
Cited by
-
CLIN_SKAT: an R package to conduct association analysis using functionally relevant variants.BMC Bioinformatics. 2022 Oct 23;23(1):441. doi: 10.1186/s12859-022-04987-2. BMC Bioinformatics. 2022. PMID: 36274122 Free PMC article.
-
Genetic architecture of spatial electrical biomarkers for cardiac arrhythmia and relationship with cardiovascular disease.Nat Commun. 2023 Mar 14;14(1):1411. doi: 10.1038/s41467-023-36997-w. Nat Commun. 2023. PMID: 36918541 Free PMC article.
-
2025 Heart Disease and Stroke Statistics: A Report of US and Global Data From the American Heart Association.Circulation. 2025 Feb 25;151(8):e41-e660. doi: 10.1161/CIR.0000000000001303. Epub 2025 Jan 27. Circulation. 2025. PMID: 39866113 Review.
-
[Intrinsic steady-state pattern of mouse cardiac electrophysiology: analysis using a characterized quantitative electrocardiogram strategy].Nan Fang Yi Ke Da Xue Xue Bao. 2024 Oct 20;44(10):1985-1994. doi: 10.12122/j.issn.1673-4254.2024.10.17. Nan Fang Yi Ke Da Xue Xue Bao. 2024. PMID: 39523099 Free PMC article. Chinese.
-
Cardiovascular waveforms - can we extract more from routine signals?JRSM Cardiovasc Dis. 2022 Sep 7;11:20480040221121438. doi: 10.1177/20480040221121438. eCollection 2022 Jan-Dec. JRSM Cardiovasc Dis. 2022. PMID: 36092374 Free PMC article.
References
-
- Wong C.X., Brown A., Lau D.H., Chugh S.S., Albert C.M., Kalman J.M., Sanders P. Epidemiology of Sudden Cardiac Death: Global and Regional Perspectives. Heart Lung Circ. 2019;28:6–14. - PubMed
-
- Myerburg R.J., Reddy V., Castellanos A. Indications for implantable cardioverter-defibrillators based on evidence and judgment. J. Am. Coll. Cardiol. 2009;54:747–763. - PubMed
-
- Yamaguchi M., Shimizu M., Ino H., Terai H., Uchiyama K., Oe K., Mabuchi T., Konno T., Kaneda T., Mabuchi H. T wave peak-to-end interval and QT dispersion in acquired long QT syndrome: a new index for arrhythmogenicity. Clin. Sci. (Lond.) 2003;105:671–676. - PubMed
Publication types
MeSH terms
Grants and funding
LinkOut - more resources
Full Text Sources
Medical
