. 2020 Jun 18;27(6):678-697.e13.
doi: 10.1016/j.chembiol.2020.04.002. Epub 2020 May 7.

Blockade of Oncogenic NOTCH1 with the SERCA Inhibitor CAD204520 in T Cell Acute Lymphoblastic Leukemia

Affiliations

Blockade of Oncogenic NOTCH1 with the SERCA Inhibitor CAD204520 in T Cell Acute Lymphoblastic Leukemia

Matteo Marchesini et al. Cell Chem Biol. .

Abstract

The identification of SERCA (sarco/endoplasmic reticulum calcium ATPase) as a target for modulating gain-of-function NOTCH1 mutations in Notch-dependent cancers has spurred the development of this compound class for cancer therapeutics. Despite the innate toxicity challenge associated with SERCA inhibition, we identified CAD204520, a small molecule with better drug-like properties and reduced off-target Ca2+ toxicity compared with the SERCA inhibitor thapsigargin. In this work, we describe the properties and complex structure of CAD204520 and show that CAD204520 preferentially targets mutated over wild-type NOTCH1 proteins in T cell acute lymphoblastic leukemia (T-ALL) and mantle cell lymphoma (MCL). Uniquely among SERCA inhibitors, CAD204520 suppresses NOTCH1-mutated leukemic cells in a T-ALL xenografted model without causing cardiac toxicity. This study supports the development of SERCA inhibitors for Notch-dependent cancers and extends their application to cases with isolated mutations in the PEST degradation domain of NOTCH1, such as MCL or chronic lymphocytic leukemia (CLL).

Keywords: CAD204520; NOTCH1; NOTCH1 mutation; P-type ATPases screening; PEST mutation; SERCA; T cell acute lymphoblastic leukemia (T-ALL); crystal structure; mantle cell lymphoma (MCL); thapsigargin.


Conflict of interest statement

Author Contributions Conceptualization and Design, M.M., A.G., W.D.-B., A.-M.L.W., M.B., and G.R.; Methodology, all authors; Resources, all authors; Investigation, all authors; Formal Analysis, all authors; Writing – Original Draft, W.D.-B., A.-M.L.W., M.M., M.B., and G.R.; Writing – Review & Editing, W.D.-B., A.-M.L.W., M.M., M.B., and G.R.; Data Curation, W.D.-B., A.-M.L.W., P.S., R.L.S., C.M., F.A., K.S., M.B., and G.R. Funding Acquisition, P.S., C.M., R.L.S., K.S., M.M., and G.R.; Project Administration, M.M. and G.R.; Supervision, G.R. Declaration of Interests W.D.-B. and A.-M.L.W. are CaDo Biotechnology IvS employees. The compounds studied are part of a patent application wholly owned by CaDo Biotechnology IvS, Denmark. K.S. has previously consulted for Novartis and Rigel Pharmaceuticals and currently receives grant funding from Novartis on topics unrelated to this manuscript.

Figures

Figure 1:
Figure 1:. Identification, structure activity relationship (SAR) and co-crystal structure of CAD204520
A) Identification of CAD204520. 191,000 Small molecules were screened for inhibition of the fungal H+-ATPase Pma1. Molecules with an enzymatic inhibition of the H+-ATPase that exceed 50% were retained for subsequent hit validation. The 407 molecules were counter screened for (Pma1 over SERCA or Na+/K+) ATPase selectivity and minimum growth inhibitory capacity (MIC) < 150 μM. Hits were then characterized as described in (Kjellerup et al., 2017). From a subsequent hit optimization program (see panel B), CAD204520 was identified as the most promising candidate against mammalian Ca2+ -ATPase (SERCA). B) Structure activity relationship (SAR) of CAD204520. C) Crystal structure of the SERCA-CAD204520 complex. Right panel: cartoon and surface representation of SERCA (light blue) with CAD204520 bound at the membrane interface (orange surface representation). Left panels: Close-up of the CAD204520 binding sites, as seen parallel to the membrane (upper panel) or along the membrane normal (lower panel). Dashed lines indicate polar interactions with Asp59 (2.9 Å) and Asn101 (2.7 Å). Nitrogen is shown in blue, oxygen in red, fluorine in cyan. Carbon is light blue for SERCA and orange for CAD204520. D) Simulated annealing omit map (green mesh) of CAD204520 (orange), contoured at 3.0 sigma. Top panel, viewed roughly along the membrane plane, bottom panel, viewed roughly perpendicular to the membrane. See also Figure S1 and Table S1
Figure 2:
Figure 2:. CAD204520 overcomes thapsigargin resistance in T-ALL
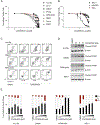
A) Lollipop graphs showing sequenced mutations in the exonic region of ATP2A1, ATP2A2 and ATP2A3 genes. Allelic variants are depicted with a circle (black = synonymous; red = missense) relative to their amino acid position (gray bottom bar, aa) and to their protein domains (color coded). The length of the lollipop (# mutations) bar indicates if 0 = no mutations occur; 1 = mutations occur in one sample; 2 = mutation occur in both samples. B) Effect of CAD204520 and thapsigargin and CAD204520 treatment in naïve and resistant ALL/SIL cells lines. Histograms show percentage of cell alive after 72 hours of treatment at indicated concentrations (~C50). Error bar denotes the mean ± SD of a minimum of three replicates. Statistical significance among groups (****P ≤ 0.0001) was determined by one-way ANOVA. C) Surface plots analysis of ALL/SIL, DND41 and RPMI-8402 T-ALL cells lines and a primary NOTCH1 mutated T-ALL sample treated with vehicle, CAD204520, thapsigargin, or CAD204520 plus thapsigargin. Each point represents and independent measurement representative of three biological replicates. Plots were generated using the Combenefit script by MATLAB R201, which represents the Loewe (dose-effect based approach) analysis. A color scale bar represents the level of drugs antagonism or synergism. D) Combination index analysis for the combinations of CAD204520 with thapsigargin in ALL/SIL, DND41 and RPMI-8402 T-ALL cell lines and a primary NOTCH1 mutated T-ALL treated for three days. On the y axis is represented the combination index, on the x axis the fraction of cells inhibited. E) BRAID index analysis for the combinations of CAD204520 with thapsigargin in ALL/SIL, DND41 and RPMI-8402 T-ALL cell lines and a primary NOTCH1 mutated T-ALL treated for three days. A color scale bar represents the level of drugs antagonism or synergism. K index is indicated. See also Figure S2
Figure 3:
Figure 3:. CAD204520 impairs T-ALL proliferation
A) Effect of CAD204520 on cell viability after 72 hours of treatments in the indicated T-ALL cell lines. Error bars denote ± SD of 2 replicates. B) Effect of CAD204520 on cell viability after 72 hours of treatments in the indicated MCL cell lines. Error bars denote ± SD of 2 replicates. C) Effect of CAD204520 treatment on induction of apoptosis. Annexin V/propidium iodide staining of T-ALL cells following 72 hours of treatment with the indicated concentrations of CAD204520. A minimum of 20,000 events was collected for each condition. D) Western immunoblot showing expression of cleaved PARP in NOTCH1 mutated cell lines (ALL/SIL, DND41, RPMI-8402 and REC-1) cells treated at the indicated concentrations of CAD204520 for 24 hours. β-Actin was used as a loading control. E) Effect of CAD204520 treatments on cycling ALL/SIL, DND41, RPMI-8402 and REC-1 cells. Percentage of DNA content following four days of treatment with the indicated concentrations of CAD204520 on each cell cycle phase is indicated. A minimum of 20,000 events was collected for each condition. See also Figure S3
Figure 4:
Figure 4:. CAD204520 modulates Notch1 signaling
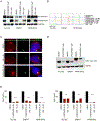
A) Effect of CAD204520 treatment for 24 hours on NOTCH1 (N1) processing and activation in T-ALL cell lines all with heterodimerization mutations (DND41 and ALL/SIL (L1594PΔPEST), and RPMI-8402 (ins1584PVELMPPE). The blot was incubated with an antibody against the C-terminus of NOTCH1 that recognizes both the furin-processed NOTCH1 transmembrane subunit (TM) and the unprocessed NOTCH1 precursor (FL). B) Effect of 24 hours of CAD204520 and GSI (DAPT) treatments on NOTCH1 cell surface staining as assessed by flow cytometry. C) Effect of CAD204520 and GSI (DAPT) treatment (24 hours) on the subcellular localization of NOTCH1. Immunofluorescence images of permeabilized ALL/SIL incubated with anti-Notch1 (C20-Red) and anti-Golgin (Green) are shown. Co-localization is indicated by yellow signal. Bar indicates 100 μm magnification. D) Western immunoblot showing the expression of cleaved NOTCH1 (ICN1) in ALL/SIL, DND41 and RPMI-8402 cells treated at the indicated concentration of CAD204520 for 24 hours. HSP90 was used as a loading control. E) CAD204520 treatment for 24 hours downregulates expression of NOTCH1 target genes in ALL/SIL, DND41 and RPMI-8402 T-ALL cells as assessed by qRT-PCR. Error bars indicate the mean ± SD of 4 replicates. Data were analyzed using the ΔΔCT method and plotted as a percentage relative to the control gene RPL13A. Statistical significance (***P ≤ 0.001; ****P ≤ 0.0001) was determined by one-way ANOVA using Bonferroni’s correction for multiple comparison testing. GSI (DAPT) was used as a positive control. See also Figure S4
Figure 5:
Figure 5:. NOTCH1 mutation sensitizes T-ALL cells to CAD204520 inhibition
A) Interphase and metaphase FISH, with the LSI MYC probe, show split signals between der(8) (red signal) and der(14) (green signal), in the MOLT-16 (left) and SKW-3/ KE-37 (right) cell lines . (b) SKW-3/ KE-37 has two der(8). B) Left: cell-based competition assay. SKW-3/KE-37 and MOLT16 were transduced with a GFP containing vector or an empty control vector respectively and co-cultured 1: 1 ratio. Right: normalized effect of CAD204520 on cellular viability in co-cultured SKW-3/KE-37-GFP and MOLT16 cells treated for 72 hours. Error bars denote the mean ± SD of 2 replicates for vehicle-treated (DMSO) cells and for CAD204520-treated cells. Statistical significance (*P ≤ 0.05) was determined by one- way ANOVA using Bonferroni’s correction for multiple comparison testing. C) Caspase 3/7 luminescence fold induction in SKW-3/KE-37 and MOLT16 cells. Error bars denote the mean ± SD of 6 replicates for vehicle-treated (DMSO) cells and for CAD204520-treated cells. Statistical significance (***P ≤ 0.001) was determined by one-way ANOVA using Bonferroni’s correction for multiple comparison testing. D) Effect of CAD204520 treatment for 24 hours on NOTCH1 (N1) processing and activation in SKW-3/KE-37 and MOLT16 cell lines. The immunoblot was stained with an antibody against the C-terminus of NOTCH1 that recognizes the furin-processed NOTCH1 transmembrane subunit (TM) and the unprocessed NOTCH1 precursor (FL) and HSP90 was used as a loading control. E) Effect of the CAD204520 in primary T-ALL cells (n=9) or isolated lymphocytes (n=6). The whisker plot represents the effect of small molecules on cellular viability calculated using the area under the curve (AUC) model of log-transformed dose-responses data using GraphPad V7. The line in the whisker diagram represents the AUC median. The upper edge (hinge) indicates the 75th percentile of the data set, and the lower hinge the 25th percentile. The ends of the vertical line show the minimum and the maximum data values. Statistical significance (*** P ≤ 0.001) was determined by a non-parametric t-test (Mann-Whitney). F) Normalized effect of the CAD204520 in primary NOTCH1 mutated T-ALL cells (n=2) or primary B-ALL (n=2) on cellular viability. Error bars denote the mean ± SD of 4 replicates. Statistical significance comparing each T-ALL vs. B-ALL case to each dose (***P ≤ 0.001; ****P ≤ 0.0001) was determined by a non-parametric t-test (Mann-Whitney). See also Figure S5
Figure 6:
Figure 6:. Effects of CAD204520 on Ca2+ and UPR activation
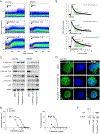
A) Indo-1 AM fluorescence traces of T-ALL cells loaded with 5 μM of Indo-1 AM and treated with DMSO, CAD204520 1μM, or thapsigargin 1μM. Baseline and post-treatment fluorescence is indicated by a black arrow. Cells were acquired for a minimum of ten minutes a LSR Fortessa X20 flow cytometer. B) Time course of ER calcium release and reuptake traces recorded in DMSO, CAD204520 and thapsigargin T-ALL treated cells. Each trace is representative of five (DMSO) or four (CAD204520 and thapsigargin) independent experiments. In green the area under the curve (AUC). Values are reported as mean ± SEM; f/f0_peak: peak fluorescence normalized to baseline fluorescence; time_50%-f/f0: time at 50% of fluorescence signal decay measured from the peak time; f/f0_3min, 5min, and 10 min: fluorescence computed at 3, 5, and 10 minutes from the peak time. *P < 0.05 vs DMSO; # P < 0.05 vs 1μM CAD204520. Statistical significance was determined by a Kruskal-Wallis test and differences among groups were determined by a Mann-Whitney non-parametric t-test. C) Effect of CAD204520 and thapsigargin treatment for 24 hours in ALL/SIL and DND41 cell lines. The blot was stained with an antibody against the C-terminus of NOTCH1 that recognizes the furin-processed NOTCH1 transmembrane subunit (TM) and the unprocessed NOTCH1 precursor (FL), an antibody that recognizes the cleaved NOTCH1 (ICN1), P-eIF2α, total eIF2α, BiP and HSP90 used as a loading control. D) Effect of CAD204520 and thapsigargin treatment for 24 hours on ATF6 in ALL/SIL cell line. Immunofluorescence of permeabilized ALL/SIL cells stained with ATF6 (green) is shown. Cell nuclei were stained with DAPI (blue). Scale bar: 100 μm. E) Effects of CAD204520 (left) and thapsigargin (right) on cell viability after 72 hours of treatments in HL-1 and ALL/SIL cell lines. Error bars denote ± SD of a minimum of 2 replicates. F) Effect of CAD204520 and thapsigargin treatment for 24 hours in HL-1 cell lines. The blot was stained with BiP and β-Actin used as a loading control. See also Figure S6
Figure 7:
Figure 7:. Effects of CAD204520 on preclinical model of T-ALL
A-C left panels. Effect of CAD204520 treatment on rat cardiomyocyte mechanics. Single experiments are represented by two dots interconnected by a solid line. Specifically, the line between dots connects the quantification of Maximal Rate of Shortening (A: −dl/dtmax), Maximal Rate of re-Lengthening (B: +dl/dtmax), and Fraction of Shortening (C: FS%), before and after the CAD204520 (5 μM) or thapsigargin (200 nM) treatment compared to control (Control). A-C right panels: Mean percentage effect of CAD204520 (CAD2045202hr) and thapsigargin (Thapsigargin200nM) on the same cardiac functions. Graph bars: mean ± SD of the 6 CAD204520 treated cardiomyocyte groups and mean ± SD of the 2 thapsigargin treated cardiomyocyte groups. Statistical significance comparing CAD204520 treated cells vs. thapsigargin treated cells (** P ≤ 0.001; * P ≤ 0.05) was determined by a non-parametric t-test (Mann-Whitney). D) Effect of daily 30 mg/Kg administration of CAD204520 on body weight. Error bars denote the mean ± SD of 6 replicates (3 male and 3 female mice). Statistical significance (n.s.) was determined by a 2-way ANOVA analysis. E) Effect of CAD204520 on T-ALL leukemia burden in a SKW-3/KE-37 xenografted murine model. Anti-leukemic activity of CAD204520 assessed by measuring hCD45+ cells after 4 days of CAD204520 treatment (45 mg/kg/OS BID) or vehicle (tween-80 0.5% w/v and HPMC 1.0% w/v). Representative dotplot showing the effect of CAD204520 on T-ALL growth in a SKW-3/KE-37 murine model. A minimum of 20,000 events was collected for each condition. F) Immunohistochemical analysis of the spleen in a SKW-3/KE-37 xenografted murine model treated with CAD204520 45 mg/kg or vehicle for 4 days. The spleen of all mice was examined; representative results for one control animal and one CAD204520 treated animal are shown. Formalin-fixed, paraffin-embedded tissue sections were stained with hCD45. Scale bars: 20 μm. G) Representative images of hematoxylin/eosin stained sections of the left ventricle from SKW-3/KE-37 xenograft treated with CAD204520 45 mg/kg or vehicle. CAD204520 treatment did not affect the gross structural components of the myocardium neither induced focal areas of damage. Well aligned myofibers in the absence of myocytolytic necrosis or interstitial inflammatory infiltrates are shown at higher magnification (inset). Scale bars: low magnification = 0.2 mm; high magnification (insets) = 0.05 mm. H) Representative images of hematoxylin/eosin stained histological section of the small intestines from SKW-3/KE-37 xenograft treated with CAD204520 45 mg/kg or vehicle. Compared to controls, intestinal villi and crypts appear to be well preserved in CAD204520-treated animals. At higher magnification (inset), no morphological changes in goblet cells and enterocytes were observed in CAD204520-treated mice. Scale bars: low magnification = 0.2 mm; high magnification (insets) = 0.05 mm. I) Effect of CAD204520 on cell blood count WBC, hemoglobin and platelets in a SKW-3/KE-37 murine model after 4 days of CAD204520 treatment (45 mg/kg/OS BID) or vehicle (tween-80 0.5% w/v and HPMC 1.0% w/v). Error bars denote the mean ± SD of 8 CAD204520 treated animals or the mean ± SD of 8 replicates vehicles treated mice. Statistical significance for treated vs. vehicle (n.s.) was determined by non-parametric t-test (Mann-Whitney). See also Figure S7

Similar articles

Cited by

References

    1. Abdullahi A, Stanojcic M, Parousis A, Patsouris D, and Jeschke MG (2017). Modeling Acute ER Stress in Vivo and in Vitro. Shock 47, 506–513. - PMC - PubMed
    1. Adams PD, Afonine PV, Bunkoczi G, Chen VB, Davis IW, Echols N, Headd JJ, Hung LW, Kapral GJ, Grosse-Kunstleve RW, et al. (2010). PHENIX: a comprehensive Python-based system for macromolecular structure solution. Acta Crystallogr D Biol Crystallogr 66, 213–221. - PMC - PubMed
    1. Andersen JP, Lassen K, and Moller JV (1985). Changes in Ca2+ affinity related to conformational transitions in the phosphorylated state of soluble monomeric Ca2+-ATPase from sarcoplasmic reticulum. J Biol Chem 260, 371–380. - PubMed
    1. Andersen TB, Lopez CQ, Manczak T, Martinez K, and Simonsen HT (2015). Thapsigargin--from Thapsia L. to mipsagargin. Molecules 20, 6113–6127. - PMC - PubMed
    1. Arbabian A, Brouland JP, Gelebart P, Kovacs T, Bobe R, Enouf J, and Papp B (2011). Endoplasmic reticulum calcium pumps and cancer. Biofactors 37, 139–149. - PubMed

Publication types

MeSH terms

LinkOut - more resources