. 2020 Jun 18;27(6):728-739.e9.
doi: 10.1016/j.chembiol.2020.04.003. Epub 2020 May 7.

Targeted Degradation of SLC Transporters Reveals Amenability of Multi-Pass Transmembrane Proteins to Ligand-Induced Proteolysis

Affiliations

Targeted Degradation of SLC Transporters Reveals Amenability of Multi-Pass Transmembrane Proteins to Ligand-Induced Proteolysis

Ariel Bensimon et al. Cell Chem Biol. .

Abstract

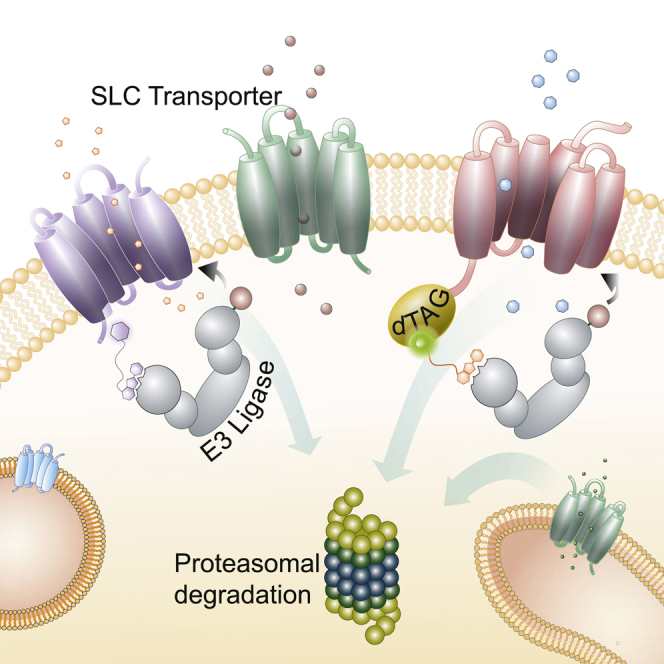
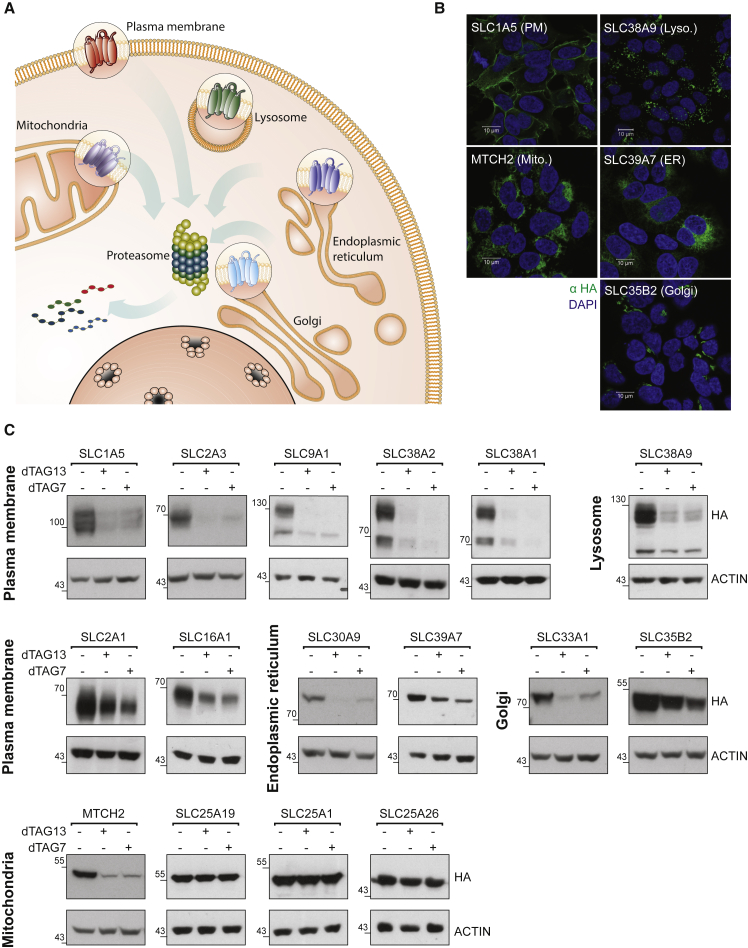
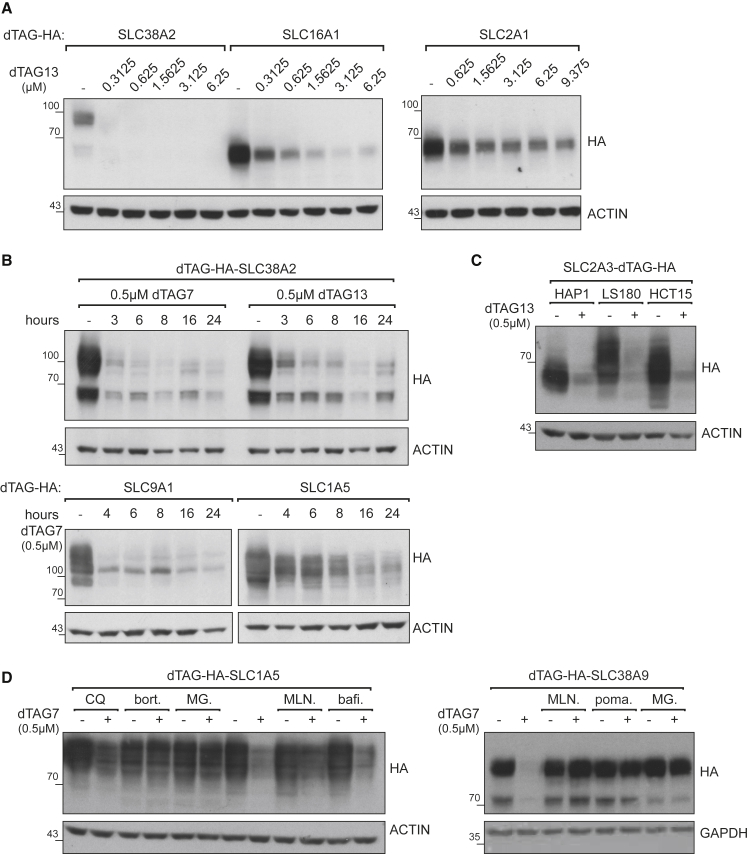
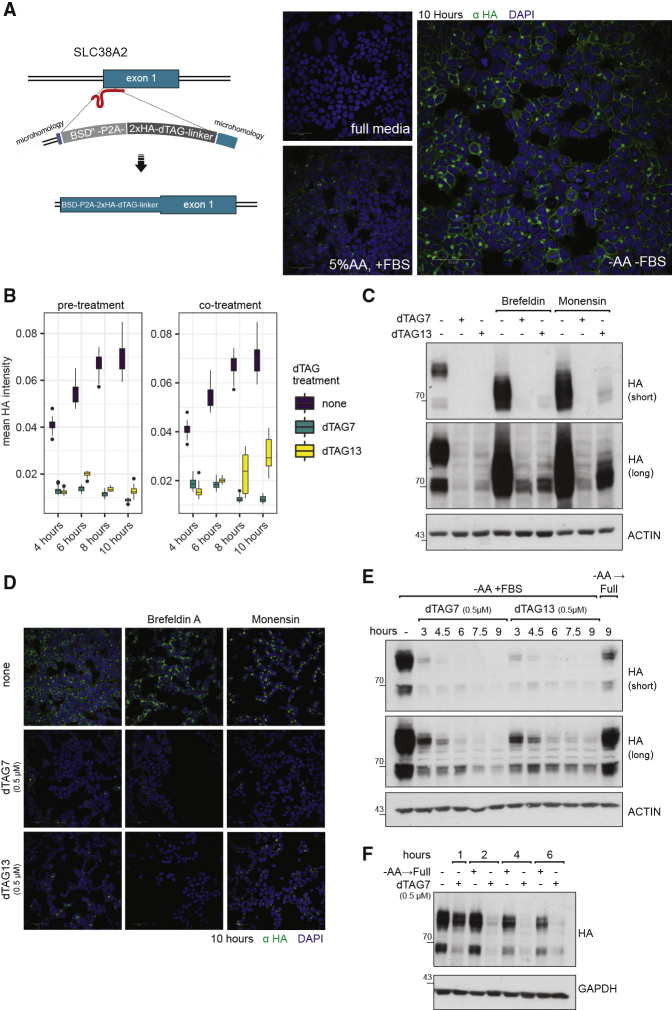
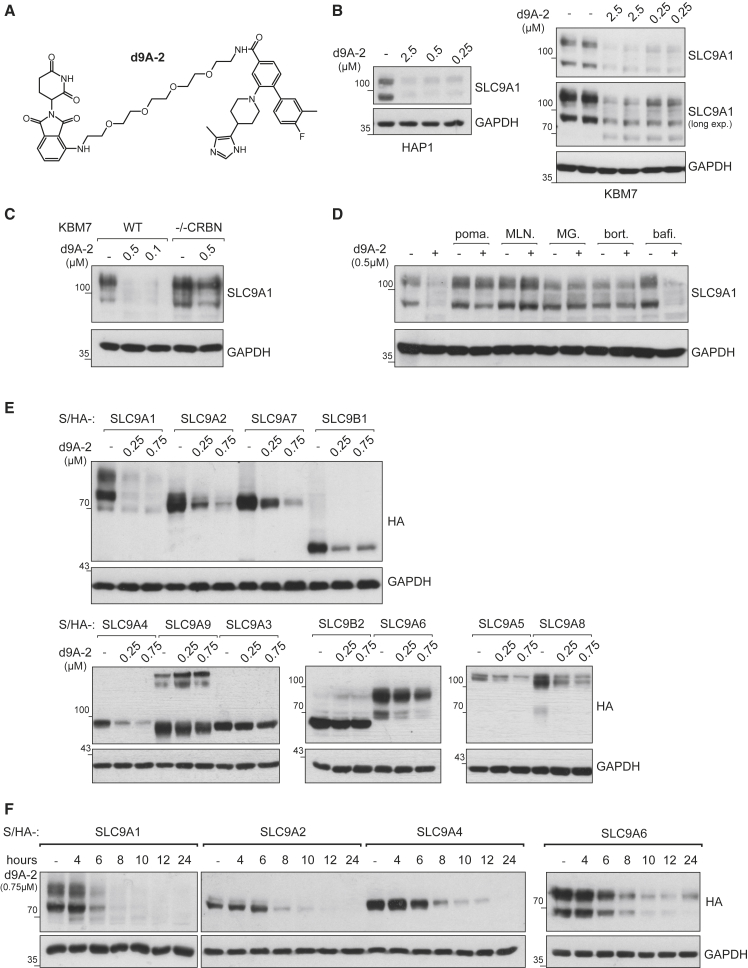
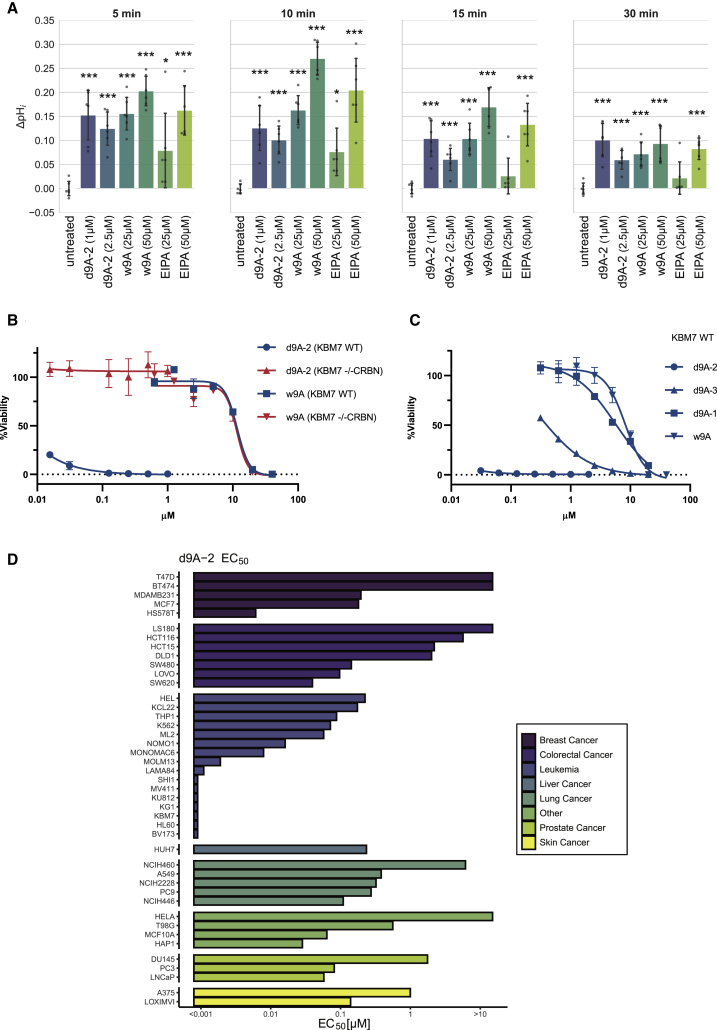
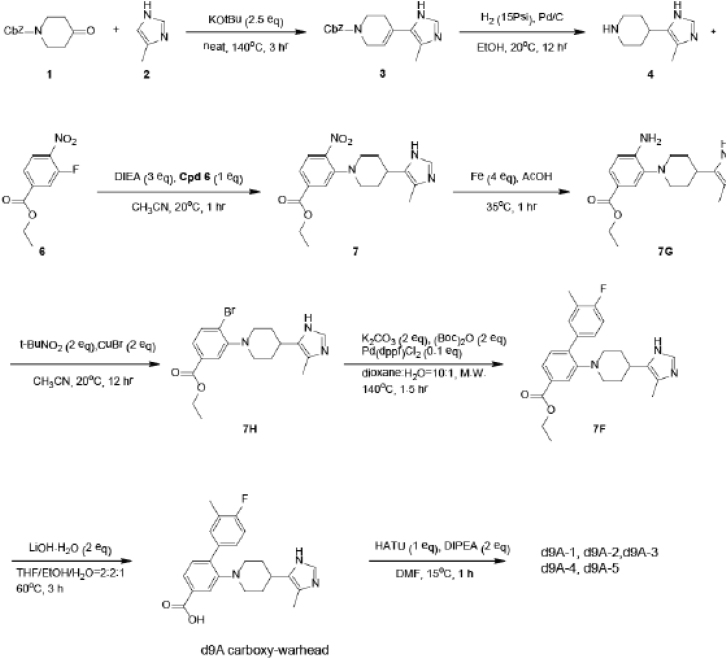
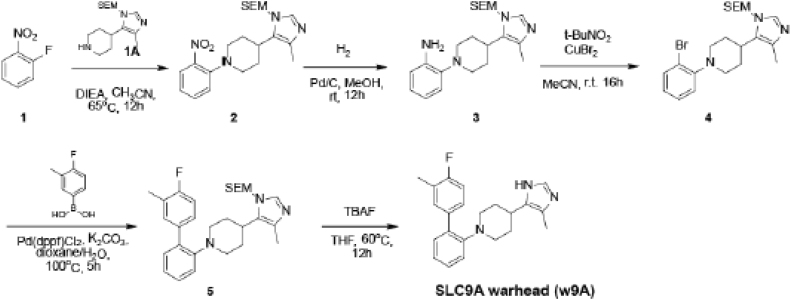
With more than 450 members, the solute carrier (SLC) group of proteins represents the largest class of transporters encoded in the human genome. Their several-pass transmembrane domain structure and hydrophobicity contribute to the orphan status of many SLCs, devoid of known cargos or chemical inhibitors. We report that SLC proteins belonging to different families and subcellular compartments are amenable to induced degradation by heterobifunctional ligands. Engineering endogenous alleles via the degradation tag (dTAG) technology enabled chemical control of abundance of the transporter protein, SLC38A2. Moreover, we report the design of d9A-2, a chimeric compound engaging several members of the SLC9 family and leading to their degradation. d9A-2 impairs cellular pH homeostasis and promotes cell death in a range of cancer cell lines. These findings open the era of SLC-targeting chimeric degraders and demonstrate potential access of multi-pass transmembrane proteins of different subcellular localizations to the chemically exploitable degradation machinery.

Keywords: E3 ligase; SLC38A2; SLC9A1; degrader; multi-pass transmembrane protein; proteasome; proteolysis targeting chimera (PROTAC); solute carrier; targeted degradation; transporter.


Conflict of interest statement

Declaration of Interests A.B., G.E.W., and G.S.-F. are co-authors of a patent application and co-founders of a company related to SLCs. G.S.-F. is the Academic Project Coordinator of the IMI grant RESOLUTE in partnership with Pfizer, Novartis, Bayer, Sanofi, Boehringer Ingelheim, and Vifor Pharma. The G.S.-F. laboratory receives funds from Pfizer and Boehringer Ingelheim.

Figures

None
Graphical abstract
Figure 1
Figure 1
Amenability of SLCs to Targeted Degradation Exogenous expression of solute carriers (SLCs) tagged by FKBP12F36V (“dTAG”) demonstrates amenability to targeted degradation in different cellular compartments: (A) Illustration representing SLC proteins from different subcellular locations (plasma membrane, lysosome, mitochondria, Golgi, endoplasmic reticulum) were selected for testing their amenability to targeted degradation. See also Table 1. (B) Representative images of immunofluorescence (αHA) imaging of the indicated dTAG-HA SLCs confirmed subcellular localization. Scale bar, 10 μm. Co-localization for all SLCs with established cellular markers is detailed in Figure S1. (C) HAP1 cells expressing dTAG-HA SLCs (as indicated) were treated for 24 h with 0.5 μM dTAG7 or dTAG13. All but three mitochondrial SLCs were amenable to targeted degradation at varying efficiency. See also Figure S2.
Figure 2
Figure 2
Characteristics of Targeted Degradation of SLCs by dTAG System (A) A range of dTAG13 concentrations was tested in cell lines expressing dTAG-HA SLC38A2, SLC16A1, or SLC2A1 for 48 h. The dose required for close to complete degradation varies for these example SLCs. Additional examples are in Figure S3A. (B) A time course of dTAG-driven SLC degradation. HAP1 cell lines expressing dTAG-HA SLC38A2, SLC9A1, or SLC1A5 were treated with 0.5 μM dTAG7 or dTAG13, and samples were harvested at several time points. The glycosylated form of SLC38A2 (upper band) appeared to be degraded slightly faster than the unglycosylated form. SLC9A1 and SLC1A5 provide additional examples of variation in time required for degradation. Additional SLCs are in Figure S2D. (C) dTAG-HA SLC2A3 was stably expressed in HAP1, LS180, and HCT15 cells. Following 72 h of treatment with 0.5 μM dTAG13, SLC2A3 was completely degraded. (D) Chemical “rescue” of dTAG-driven degradation of SLCs. HAP1 cell lines expressing dTAG-HA SLC1A5 or SLC38A9 were treated with 0.5 μM dTAG7 for 12 or 18 h, respectively. These cells were also treated with chloroquine (CQ) (50 μM), bortezomib (bort.) (1 μM), MG-132 (MG) (1 μM), MLN4924 (MLN) (1 μM), pomalidomide (poma.) (10 μM), or bafilomycin A1 (bafi.) (2.5 μM). SLC degradation was rescued by inhibiting CRL activity or the proteasome, but not by inhibiting the lysosome machinery. See also Figures S3D and S3E.
Figure 3
Figure 3
dTAG Knockin Are Equally Amenable to Targeted Degradation (A) dTAG knockin: SLC38A2 was tagged at the N terminus with HA-dTAG. Blasticidin was used as the selection marker. The expression of dTAG-HA SLC38A2 was induced by replacing the normal culture medium with DMEM medium deprived of both FBS and amino acids, or supplemented with FBS and only with 5% of non-essential amino acids. Representative immunofluorescence images of HA-dTAG-SLC38A2 expression after 10 h of induction are shown. Scale bar, 50 μm. A time course of this induction can be found in Figure S4A. (B) The expression of HA-dTAG SLC38A2 was induced by replacing the normal culture medium with medium deprived of amino acids and FBS. Cells were treated with medium only (“none”) or treated with medium and dTAG7/13 in one of two regimes: 2-h pre-treatment (left boxplot) or co-treatment (right boxplot). Expression of the endogenous SLC is induced rapidly and was monitored by immunofluorescence (α-HA) imaging and quantified by automated image analysis. The mean HA intensity was plotted for each time point in each regime separately, with the condition none plotted in both graphs as a shared reference. Two-hour pre-treatment with dTAG7 or dTAG13 leads to complete degradation of SLC38A2. Co-treatment with dTAG13, but not dTAG7, leads to accumulation of a signal corresponding to undegraded polypeptide at the later time points of induction, suggesting a difference in kinetics between the two PROTACs. (C) The expression of HA-dTAG SLC38A2 was induced by replacing the normal culture medium with medium deprived of amino acids and FBS. Cells were co-treated with dTAG7 (0.5 μM) or dTAG13 (0.5 μM) for 16 h. In addition, cells were treated with brefeldin A (5 μg/mL) or monensin (2 μM), halting the protein in the ER or Golgi compartment, respectively. SLC38A2 is amenable to degradation in and/or en route to both compartments. In the Golgi, a slight fraction of the SLC is not degraded under dTAG13 co-treatment. See also Figure S4E. (D) Expression, re-localization, and degradation of HA-dTAG SLC38A2 were monitored by immunofluorescence and quantified by automated image analysis. Representative images are presented, and quantification of the data is presented in Figure S4E. HA-dTAG SLC38A2 was induced by replacing the normal culture medium with medium deprived of amino acids and FBS for 10 h. Cells were co-treated, as indicated, with brefeldin A (5 μg/mL) or monensin (2 μM), dTAG7 (0.5 μM), or dTAG13 (0.5 μM). Scale bar, 50 μm. (E) Cells were treated for 10 h in medium lacking amino acids, leading to the induction of HA-dTAG SLC38A2. dTAG7 (0.5 μM) or dTAG13 (0.5 μM) were then added for the indicated hours, to monitor degradation of the glycosylated protein from the plasma membrane. Near-complete degradation is achievable within 3 h, and is maintained for at least 9 h. As a reference for the natural removal of SLC38A2, cells were refed by a change to full medium for 9 h. (F) Cells were treated for 18 h in medium supplemented with 5% amino acids, leading to the induction of HA-dTAG SLC38A2. To closely compare the PROTAC-mediated degradation to the natural removal of the protein, cells were treated with dTAG7 (0.5 μM) or refed with full medium for the indicated time points. dTAG7-mediated degradation was initiated within 1 h and nearly completed within 2 h. Removal of the protein after refeeding was noticeably slower from 4 h onward. See also Figure S4F.
Figure 4
Figure 4
SLC9 PROTAC Series (A) The chemical structure of the SLC degrader d9A-2. See Figure S5A for structures of the related molecules. (B) HAP1 and KBM7 cells were treated with different concentrations of d9A-2. Within 8 h, degradation of SLC9A1 was observed in both cell lines. (C) Both WT and CRBN knockout KBM7 cell lines were treated with indicated concentrations of d9A-2 for 12 h. SLC9A1 degradation is observed in WT but not CRBN knockout. (D) Chemical “rescue” of d9A-2-driven degradation. WT KBM7 cell lines were treated with 0.5 μM d9A-2 for 16 h. These cells were also treated with bortezomib (bort.) (0.25 μM), MG-132 (MG) (1 μM), MLN4924 (MLN) (1 μM), pomalidomide (poma.) (1 μM), or bafilomycin A1 (bafi.) (10 μM). All molecules, apart from bafilomycin, could rescue SLC9A1 from degradation. (E) Selectivity of d9A-2 was tested across HAP1 cell lines expressing Strep/HA-SLC9A1, SLC9A2, SLC9A3, SLC9A4, SLC9A5, SLC9A6, SLC9A7, SLC9A8, SLC9A9, SLC9B1, and SLC9B2. Cells were treated with varying concentrations of d9A-2 for 16 h, after which degradation of the exogenous SLCs was monitored. At 0.25 μM, SLC9A1 is the only SLC9 member that is completely degraded. (F) Kinetics of d9A-2-induced degradation tested in HAP1 cell lines expressing Strep/HA-SLC9A1, SLC9A2, SLC9A4, and SLC9A6. d9A-2 (0.75 μM) was added to HAP1 cell lines for the indicated length of time. SLC9A1 is the only protein that is mostly degraded after 6 h.
Figure 5
Figure 5
Effect of SLC9A1 Degradation on Cell Proton Transport and Viability (A) Effect of indicated molecules on pHi recovery was assessed in the acid load assay. To achieve SLC9 degradation, cells were pre-treated for 8 h with d9A-2 (1 or 2.5 μM). As reference, cells were treated (25 or 50 μM) with the warhead w9A from which d9A-2 was developed or EIPA, a molecule known to inhibit SLC9A1, as a control. Following an acid load perturbation, recovery was compared between untreated and each of the treatments. The difference in recovery, compared with untreated cells (ΔpHi), was calculated at indicated time points after recovery. Each condition was assayed in six replicates. The corresponding raw plots are presented in Figure S6C. In comparison with untreated, a significant change in pH recovery was observed for almost all treatments (∗p < 0.05, ∗∗∗p < 0.0005; one-tailed t test). In comparison with 1 μM d9A-2, the change in pH recovery was higher only in 50 μM w9A (5 min, p < 0.05; 10 min, p < 0.0005; 15 min, p < 0.05) or 50 μM EIPA (10 min, p < 0.05). Data are represented as mean ± SD. See also Figure S6C. (B) Viability WT and CRBN knockout KBM7 was assessed at 72 h post-treatment with d9A-2 or w9A (mean ± SD). The two cell lines display similar sensitivity to the warhead w9A but marked difference in sensitivity to d9A-2 (C) Viability of WT KBM7 was also assessed at 72 h post-treatment with d9A-2, d9A-3, d9A-1, or w9A (mean ± SD), to relate between the effect of these compounds on degradation and cytotoxicity. See also Figures S5 and S6. (D) EC50 values for d9A-2 were estimated for 43 cancer cell lines tested at 72 h post-treatment. The area above the dose response was calculated to capture and compare dose curves for each molecule of the PROTAC series (Figure S6A). Cell lines of leukemic origin display a marked sensitivity to d9A-2 with EC50 < 0.1 μM.
None
None

References

    1. Amith S.R., Fliegel L. Regulation of the Na+/H+ exchanger (NHE1) in breast cancer metastasis. Cancer Res. 2013;73:1259–1264. - PubMed
    1. Atwal K.S., O’Neil S.V., Ahmad S., Doweyko L., Kirby M., Dorso C.R., Chandrasena G., Chen B.-C., Zhao R., Zahler R. Synthesis and biological activity of 5-aryl-4-(4-(5-methyl-1H-imidazol-4-yl)piperidin-1-yl)pyrimidine analogs as potent, highly selective, and orally bioavailable NHE-1 inhibitors. Bioorg. Med. Chem. Lett. 2006;16:4796–4799. - PubMed
    1. Bai X., Moraes T.F., Reithmeier R.A.F. Structural biology of solute carrier (SLC) membrane transport proteins. Mol. Membr. Biol. 2017;34:1–32. - PubMed
    1. Barkai N., Leibler S. Robustness in simple biochemical networks. Nature. 1997;387:913–917. - PubMed
    1. Barretina J., Caponigro G., Stransky N., Venkatesan K., Margolin A.A., Kim S., Wilson C.J., Lehár J., Kryukov G.V., Sonkin D. The Cancer Cell Line Encyclopedia enables predictive modelling of anticancer drug sensitivity. Nature. 2012;483:603–607. - PMC - PubMed

Publication types