. 2020 May 18;53(4):473-491.e9.
doi: 10.1016/j.devcel.2020.04.009. Epub 2020 May 7.

Single-Cell Analysis of Human Retina Identifies Evolutionarily Conserved and Species-Specific Mechanisms Controlling Development

Affiliations

Single-Cell Analysis of Human Retina Identifies Evolutionarily Conserved and Species-Specific Mechanisms Controlling Development

Yufeng Lu et al. Dev Cell. .

Abstract

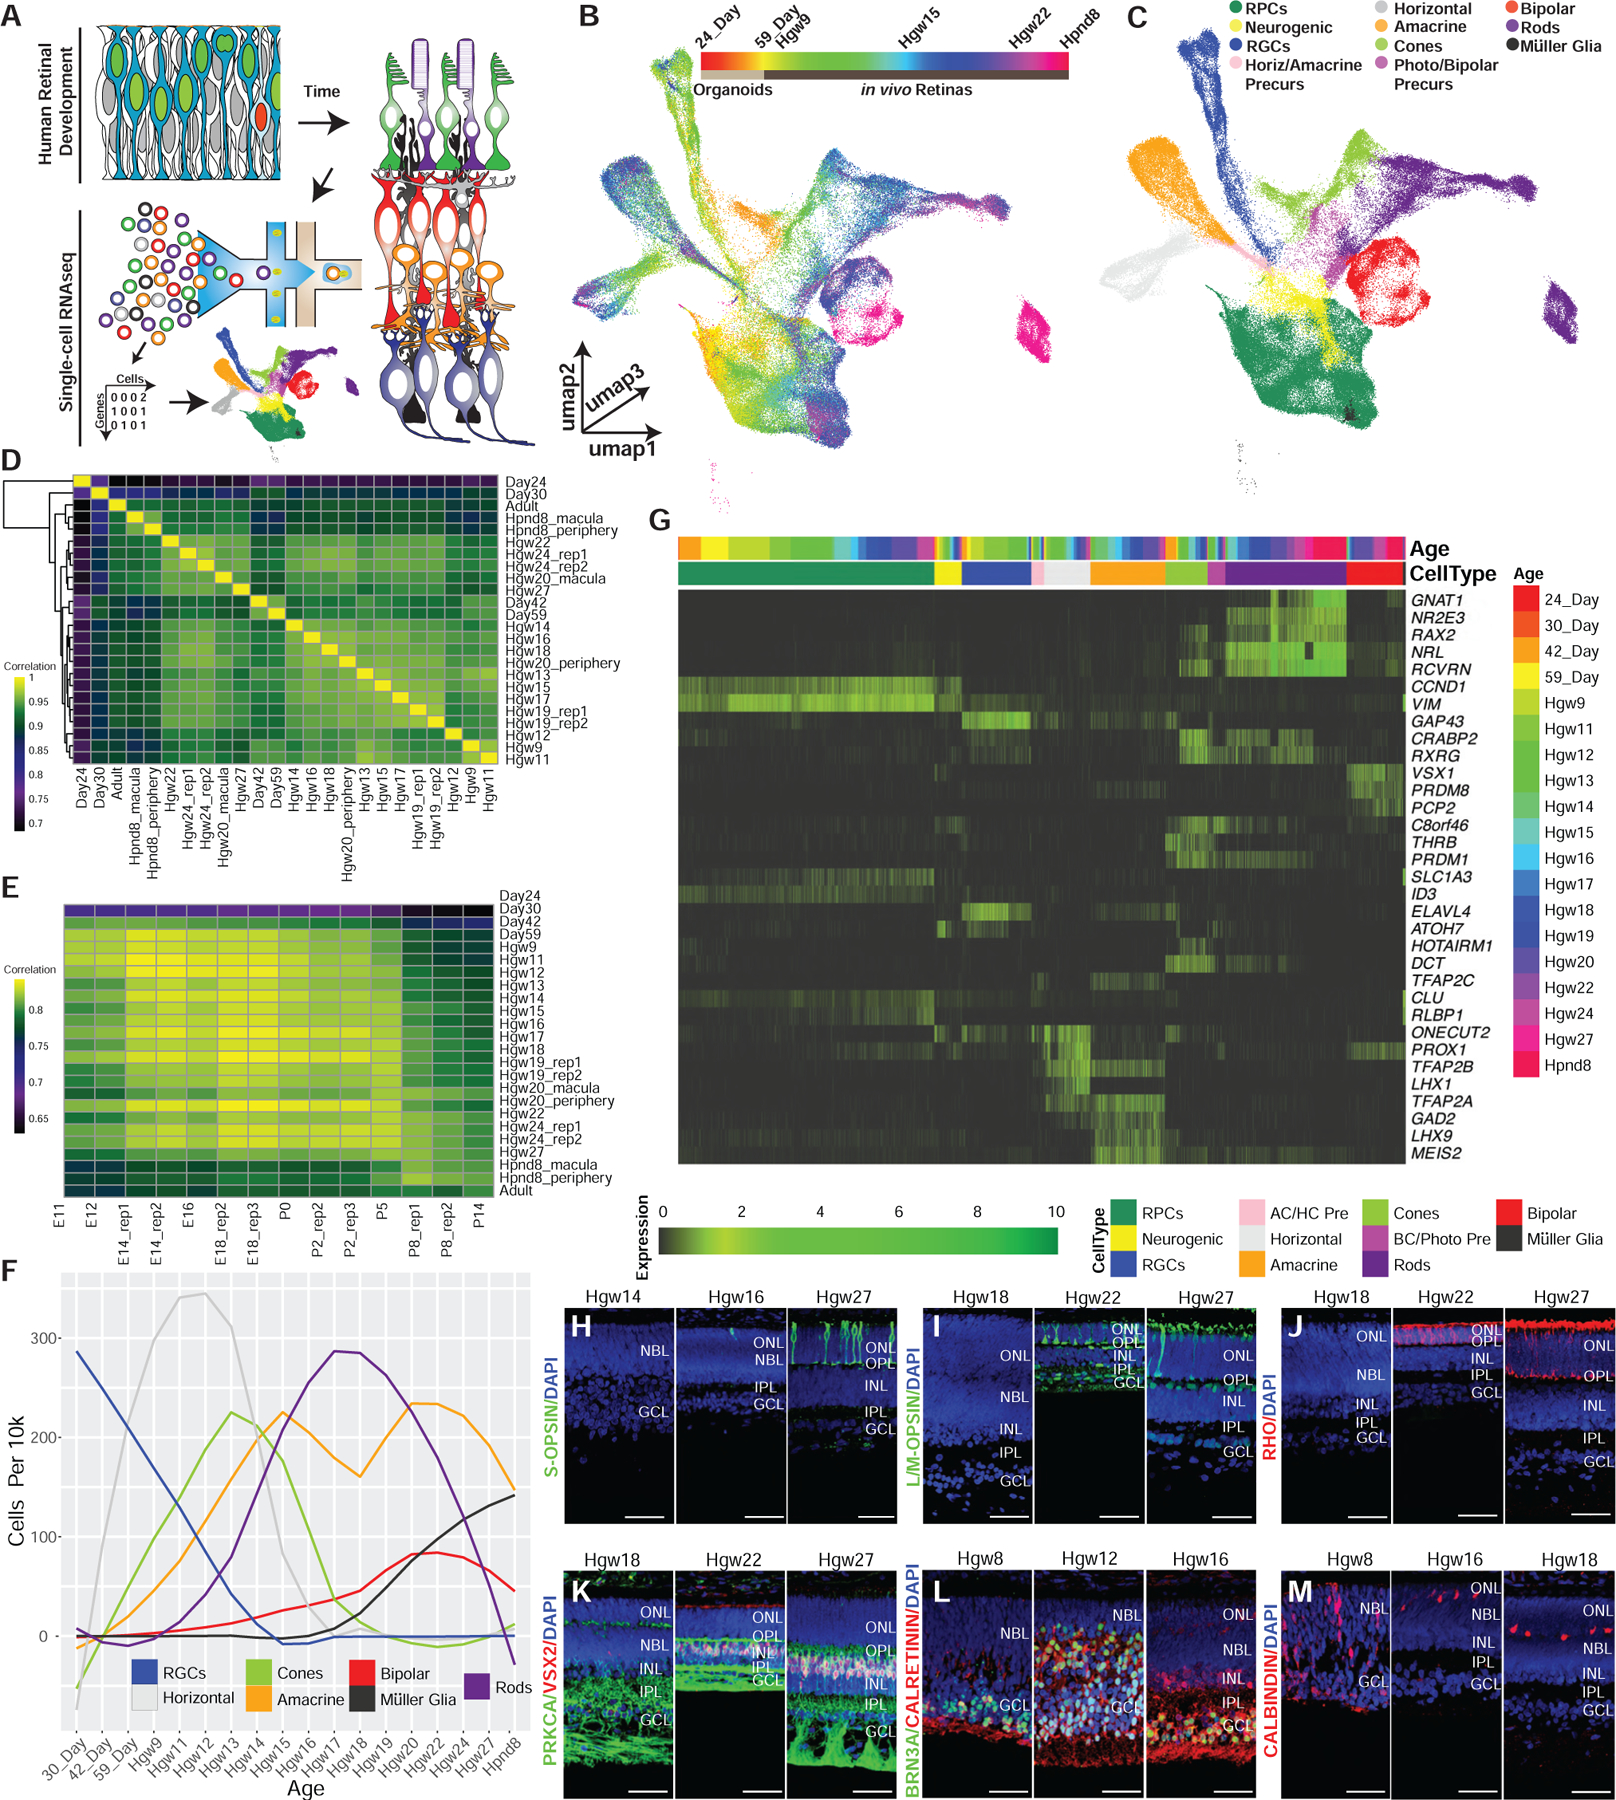
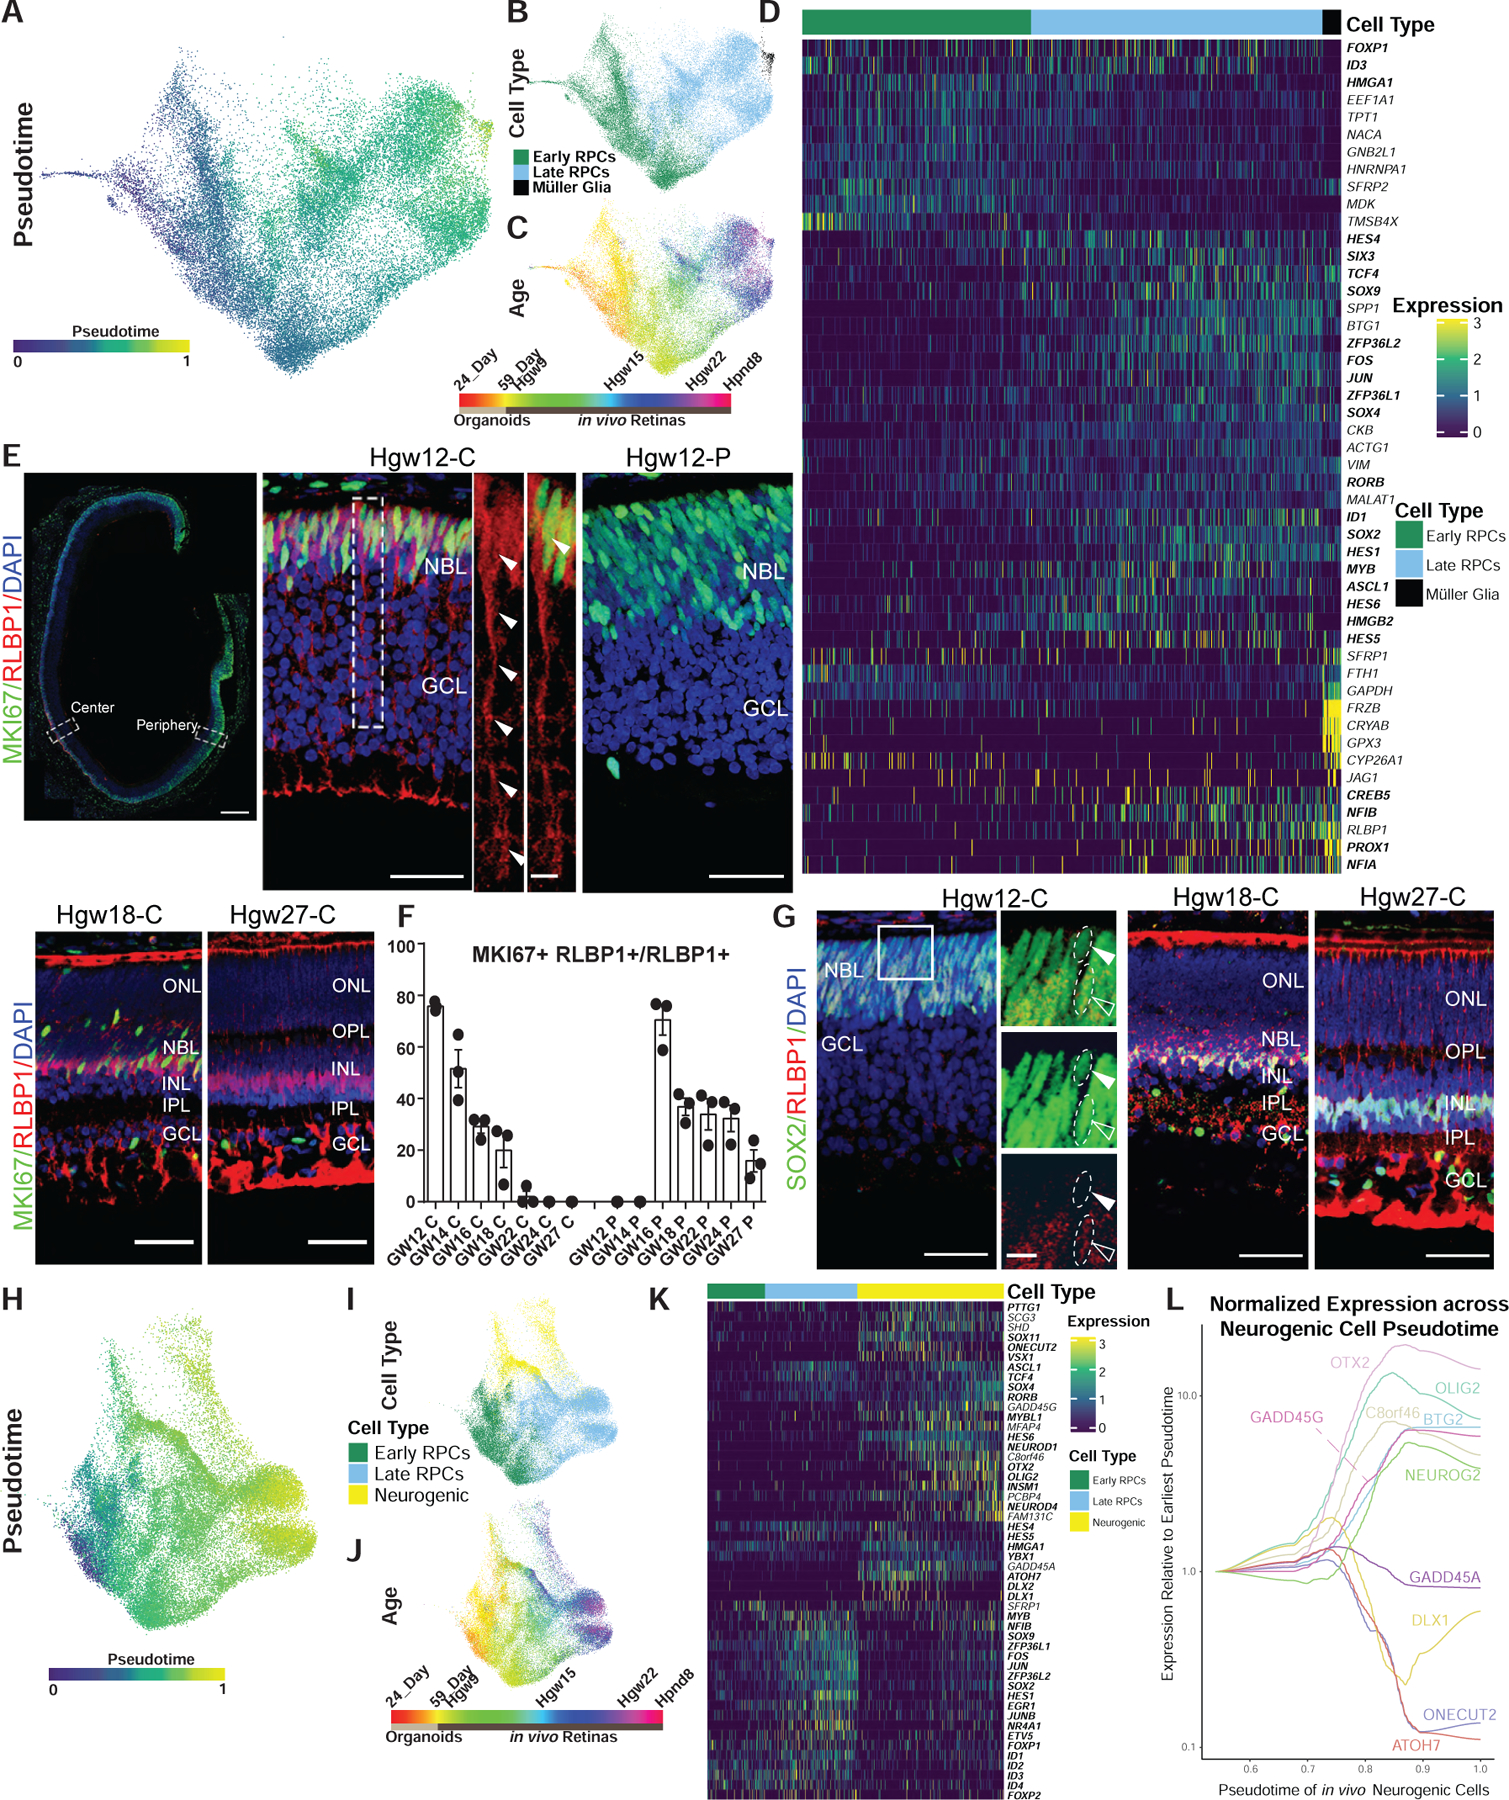
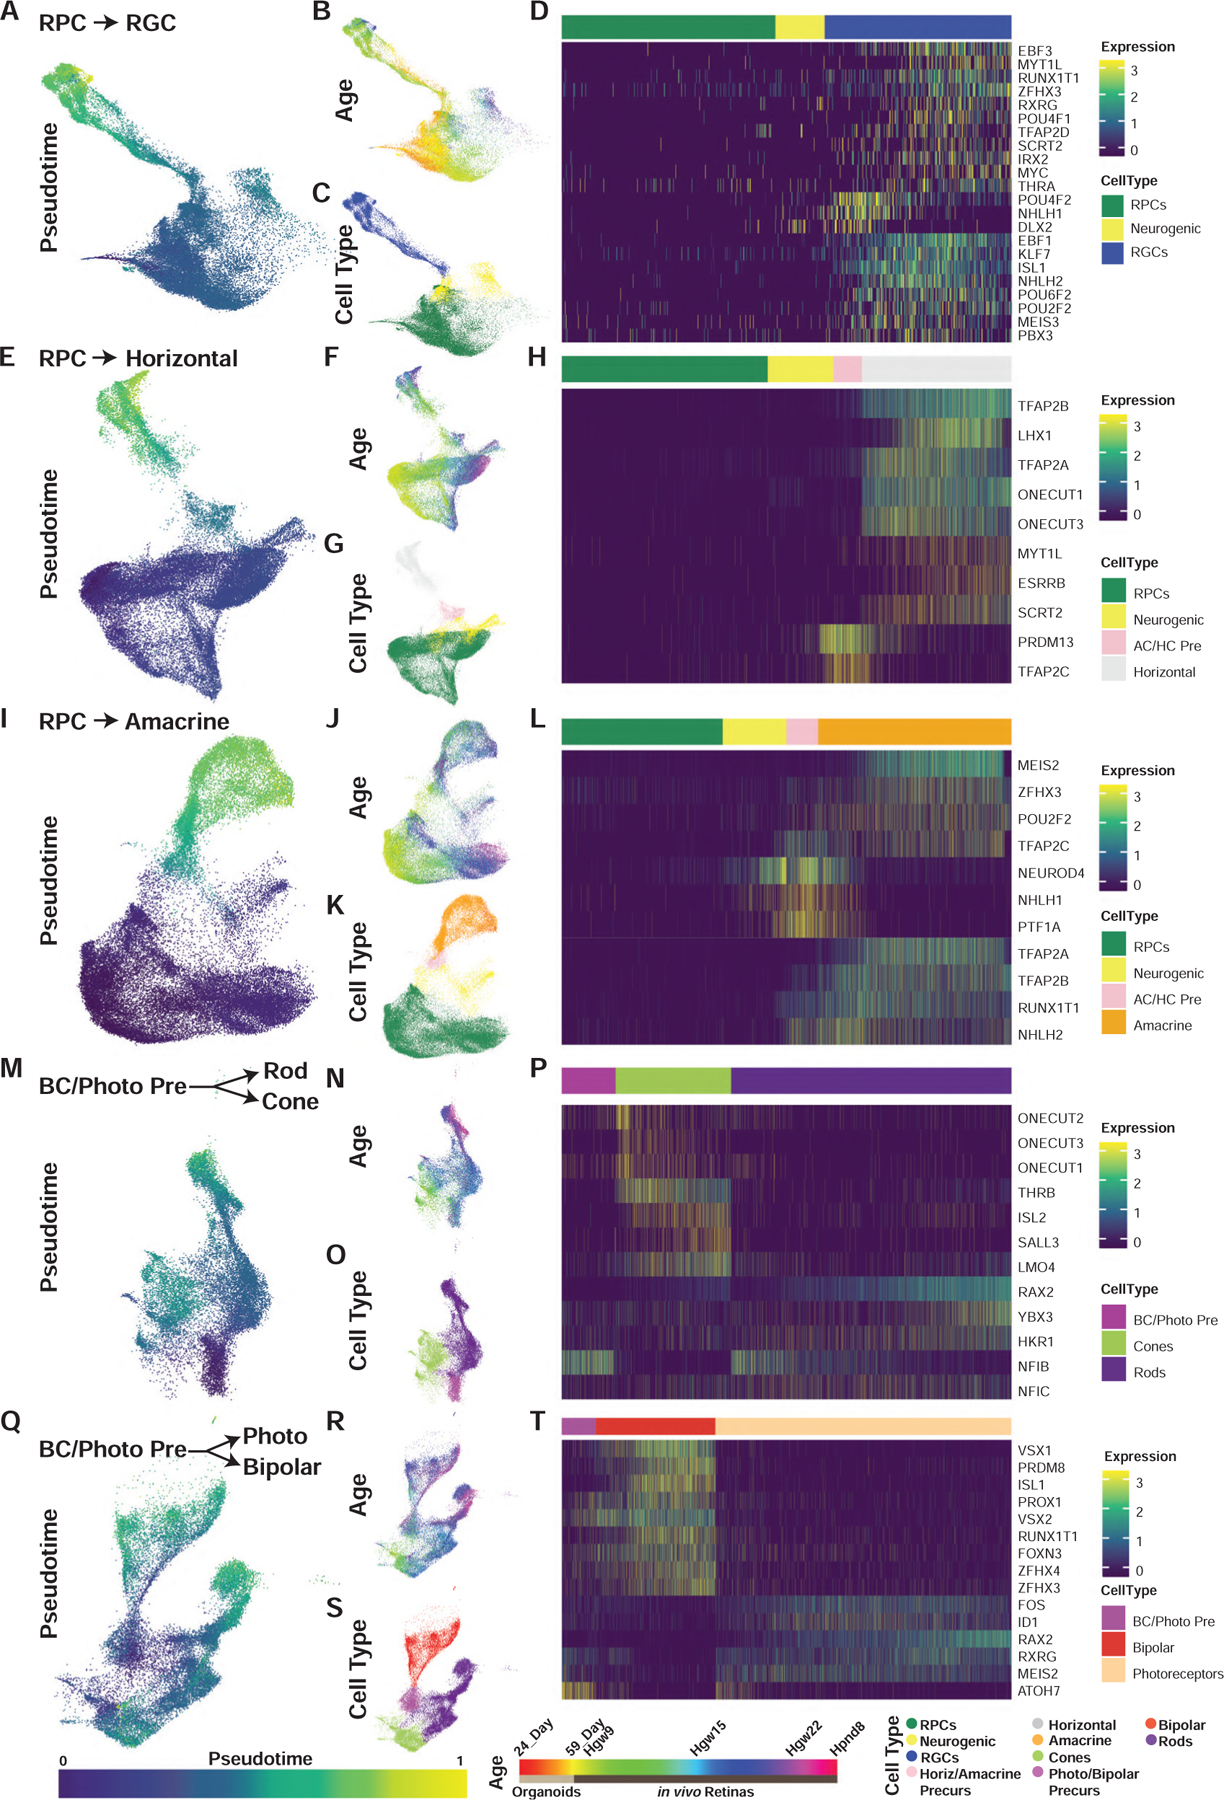
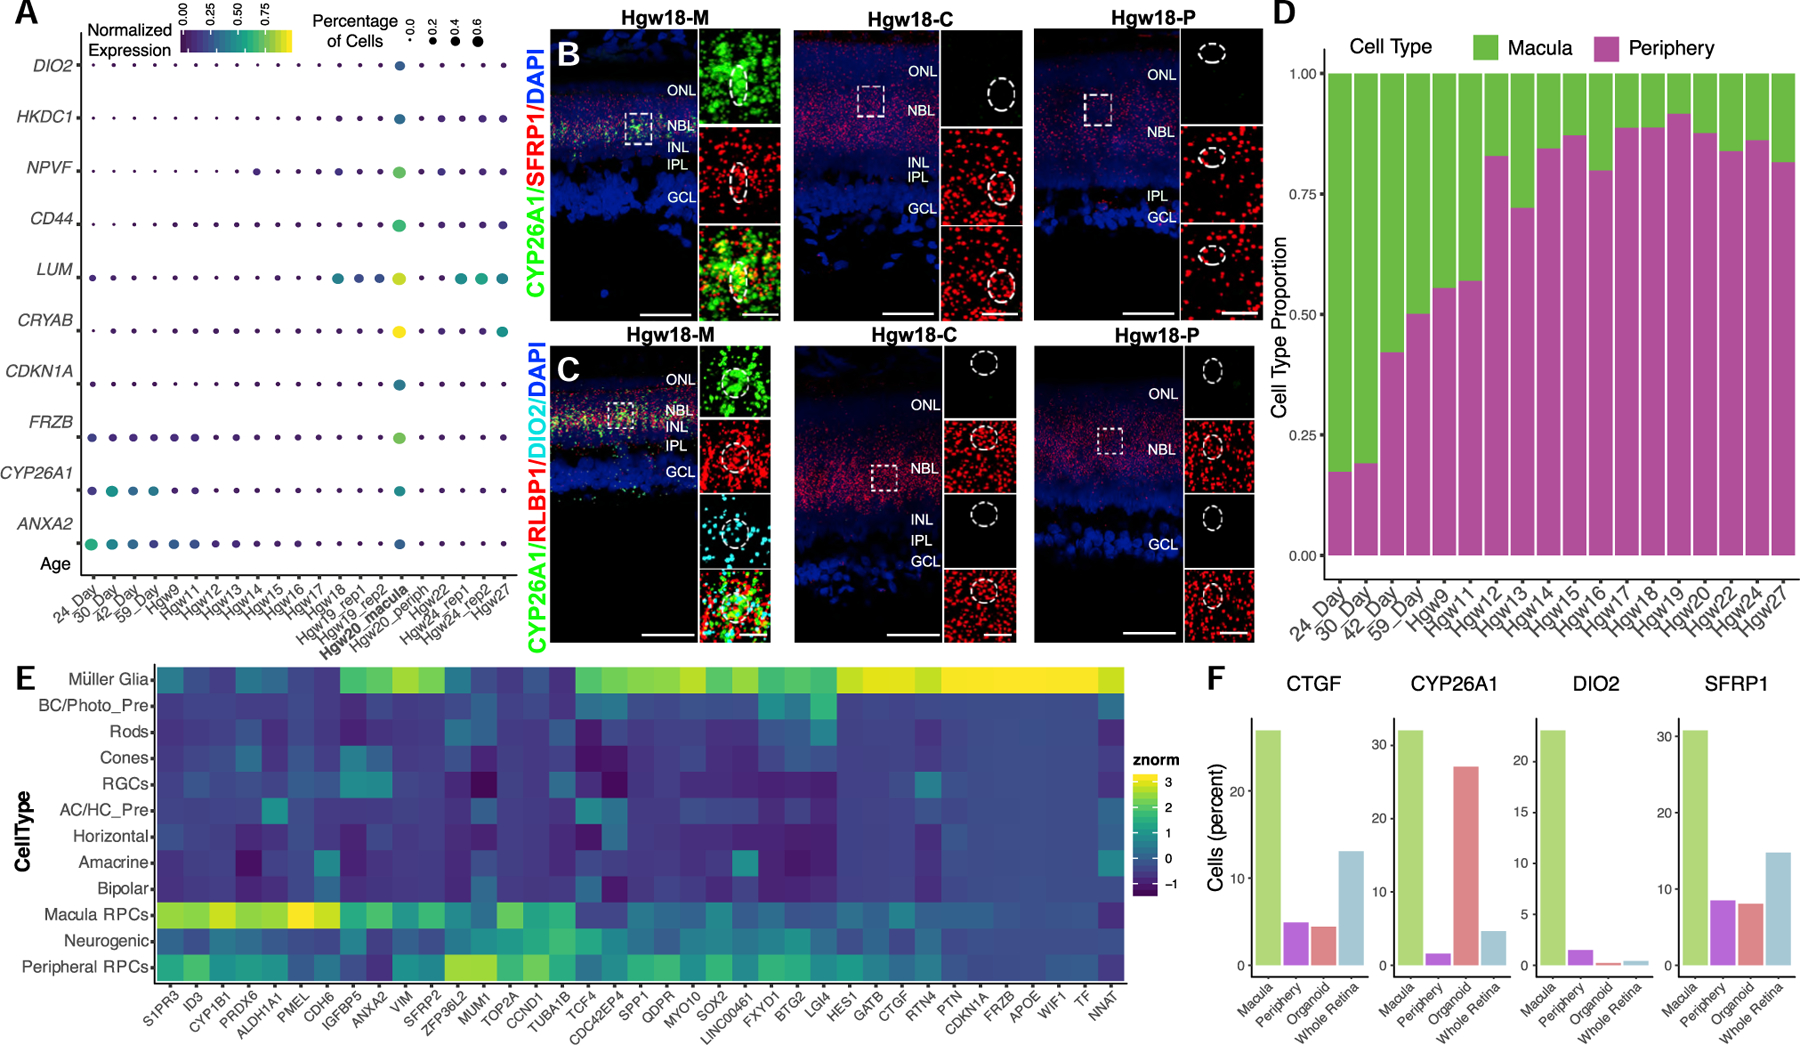
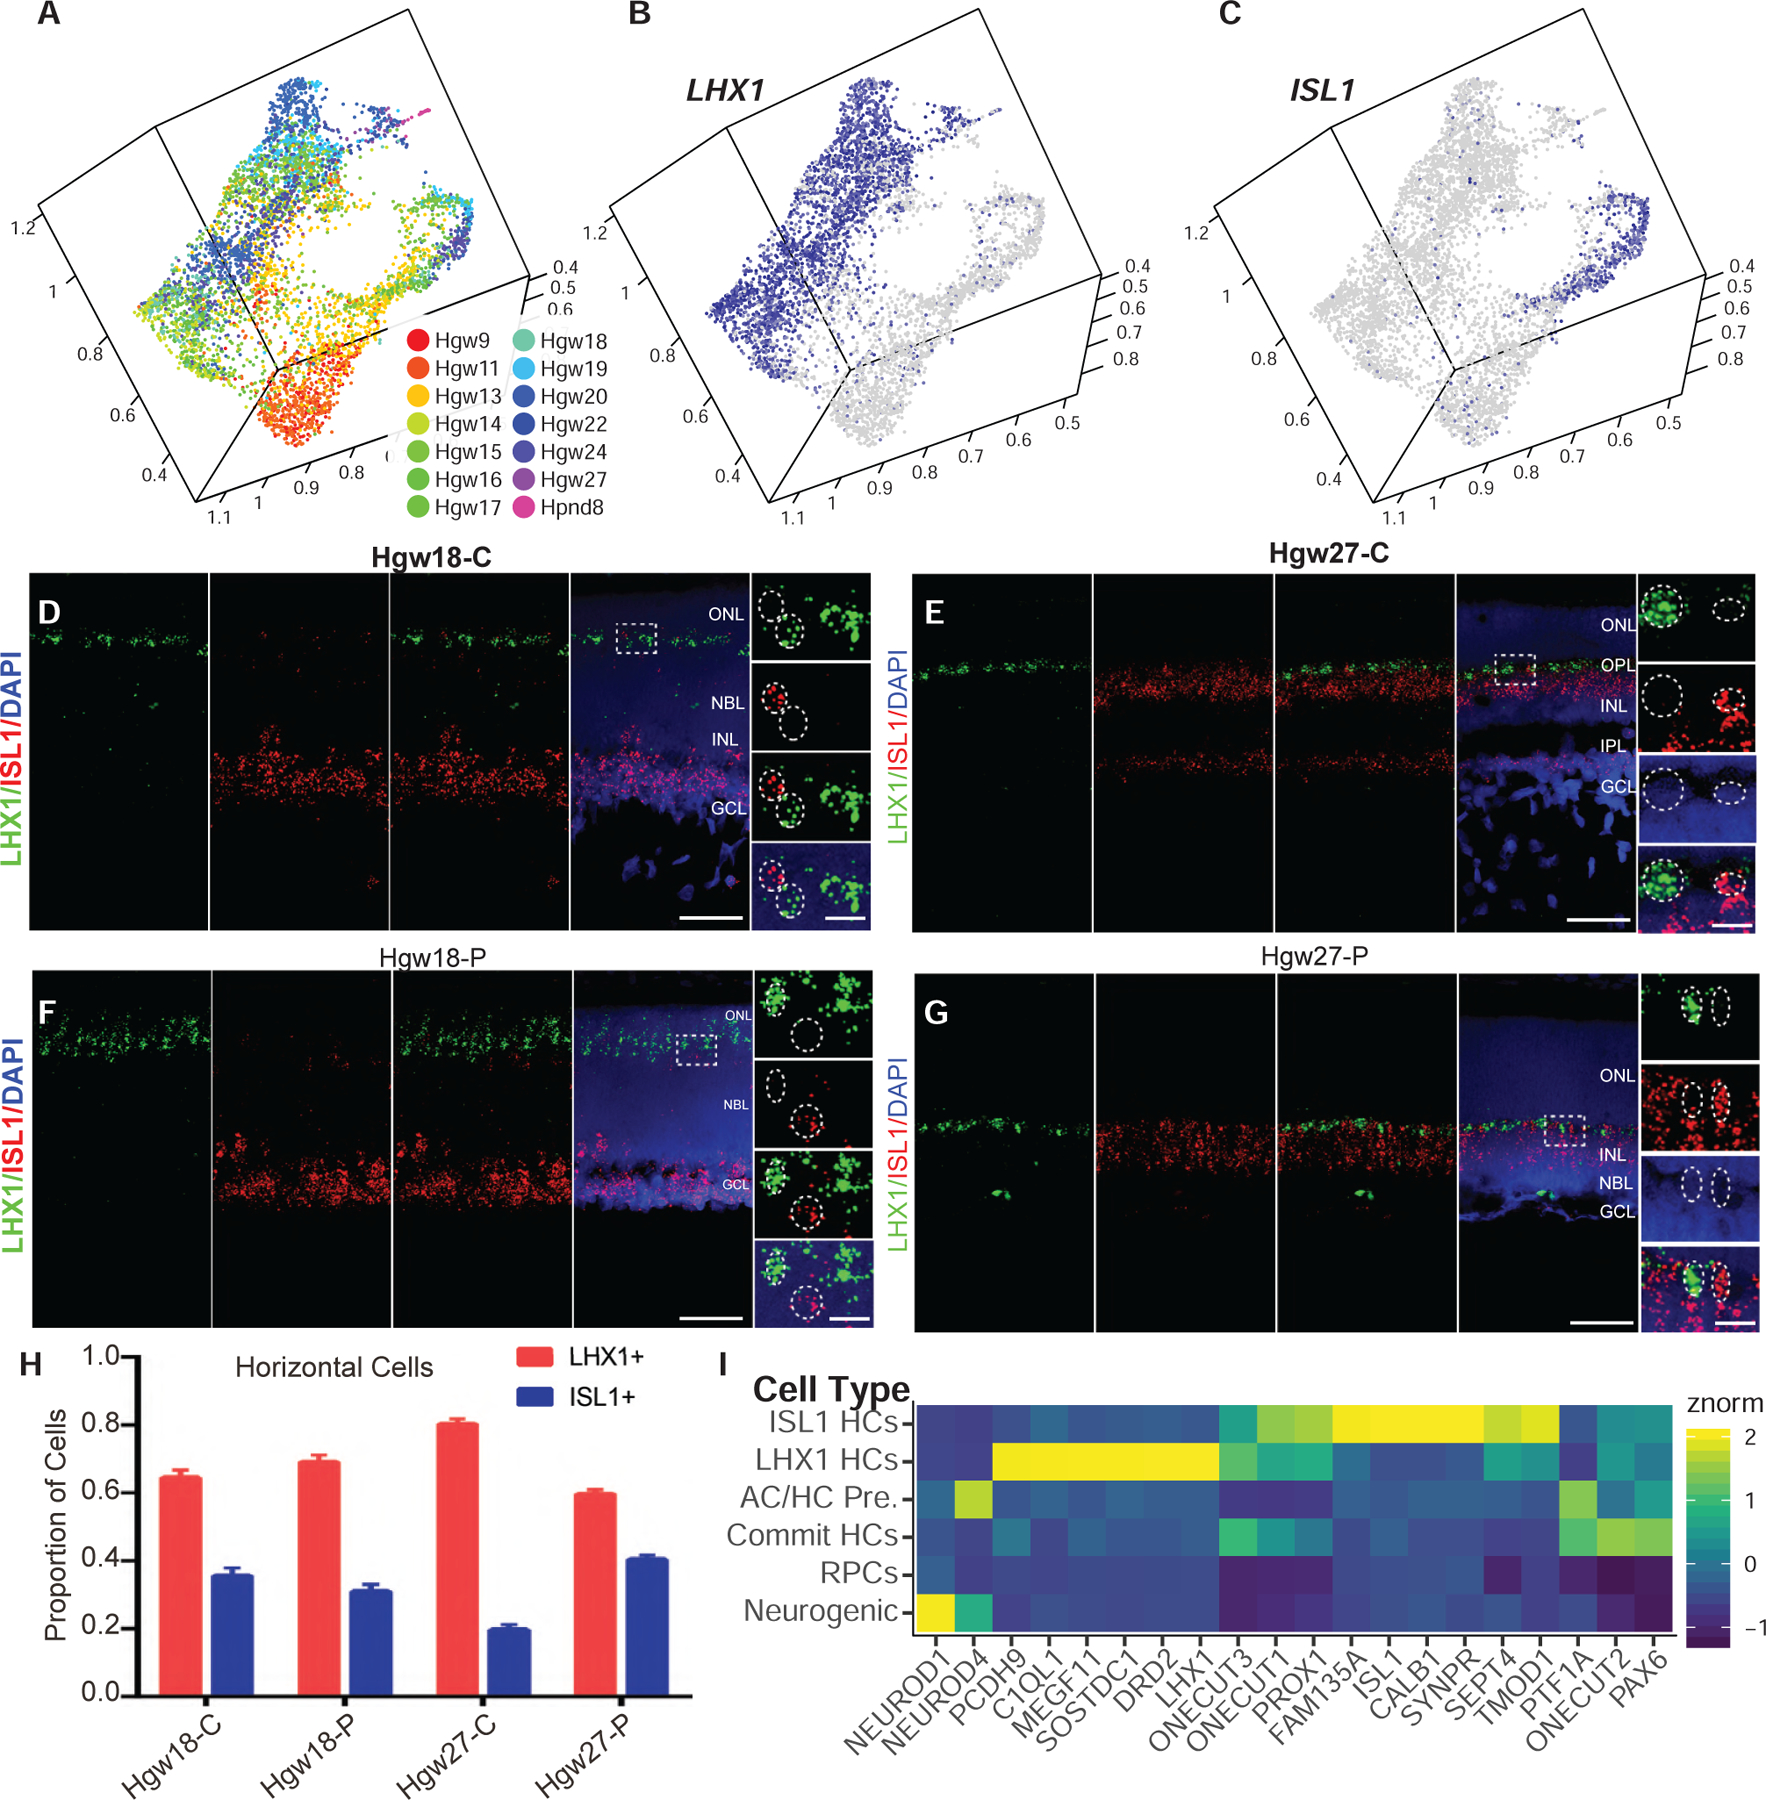
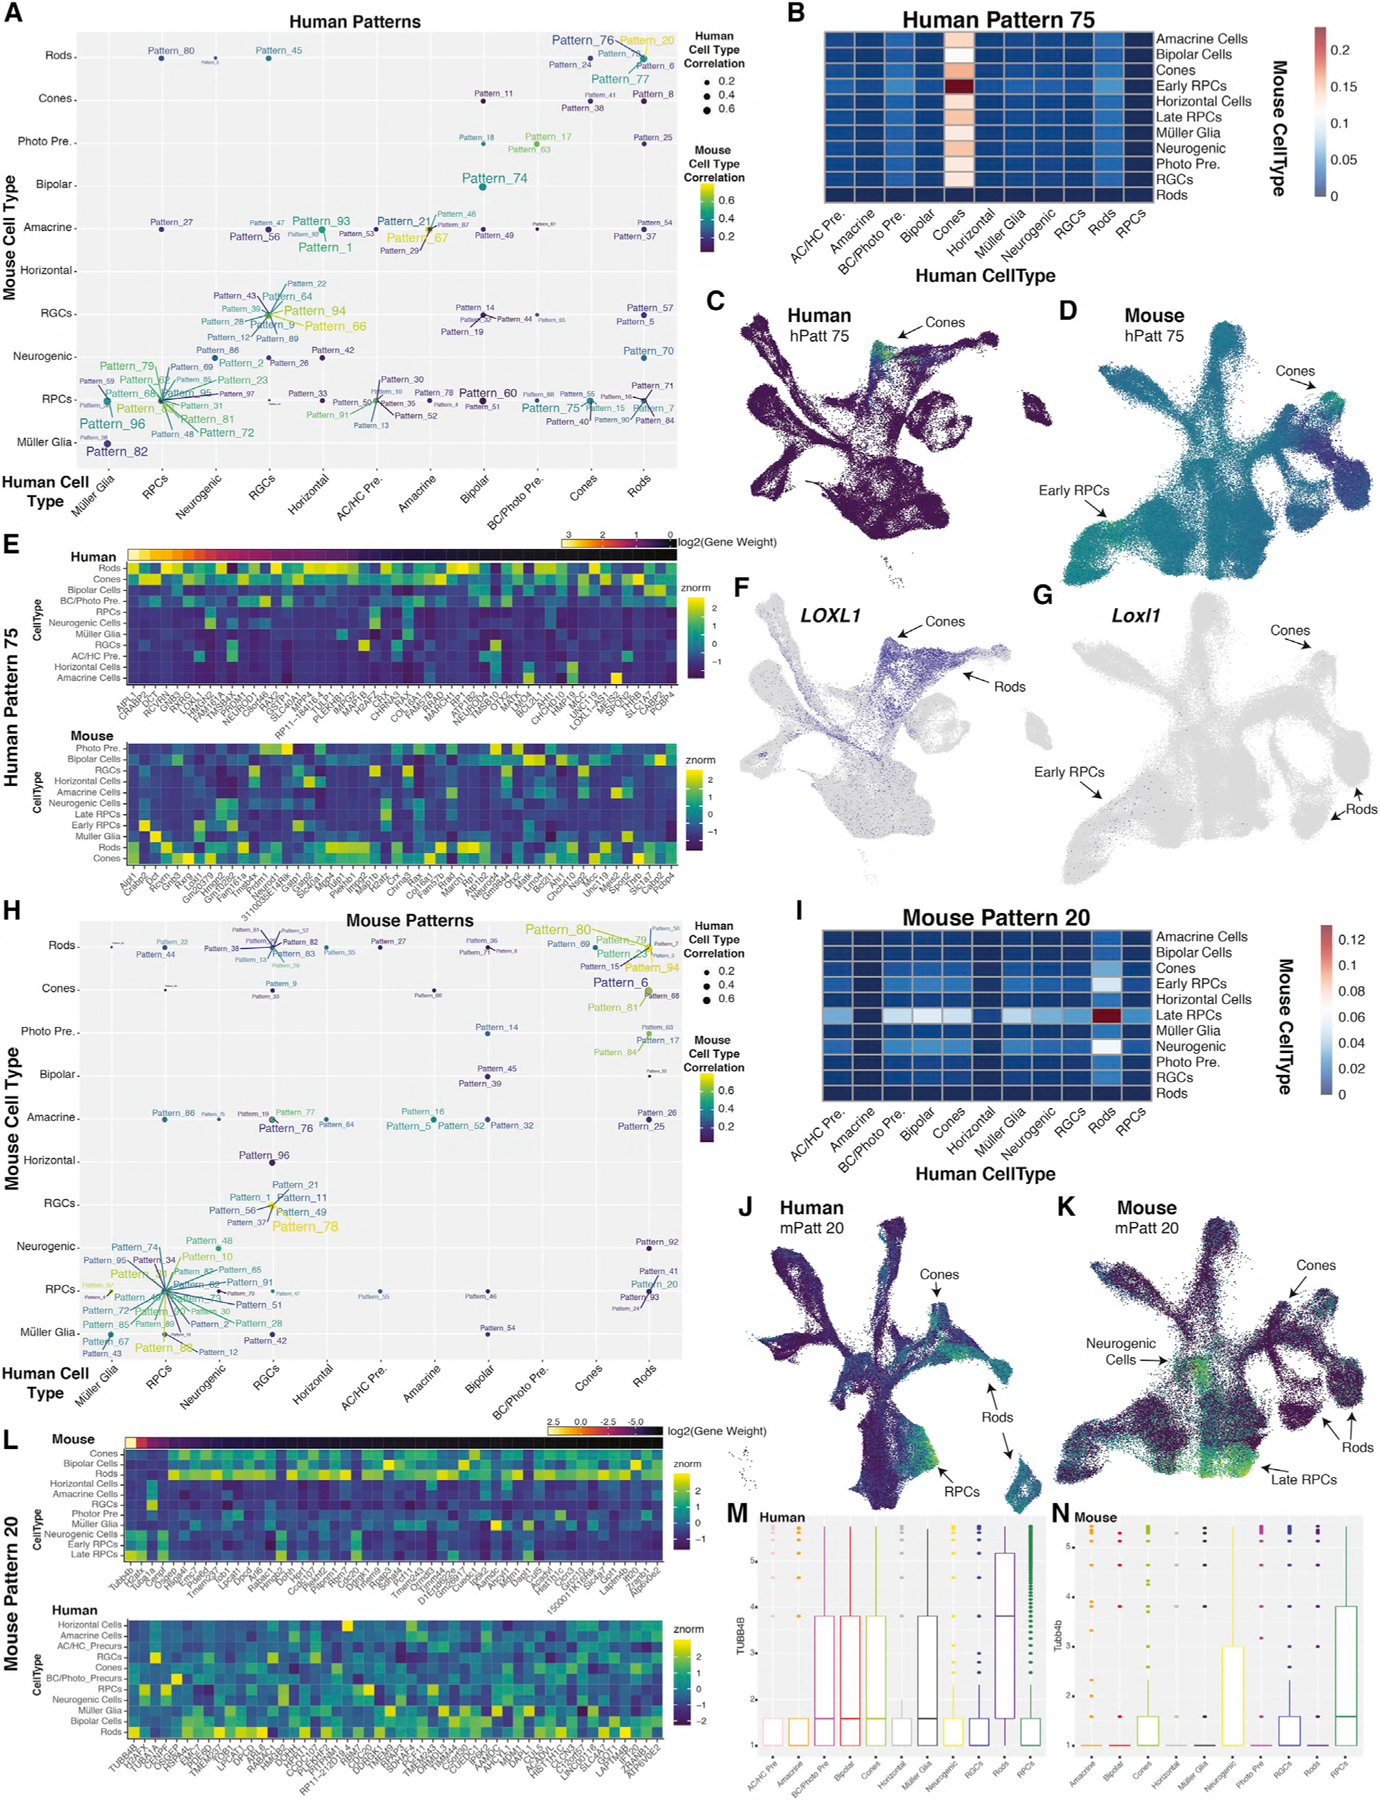
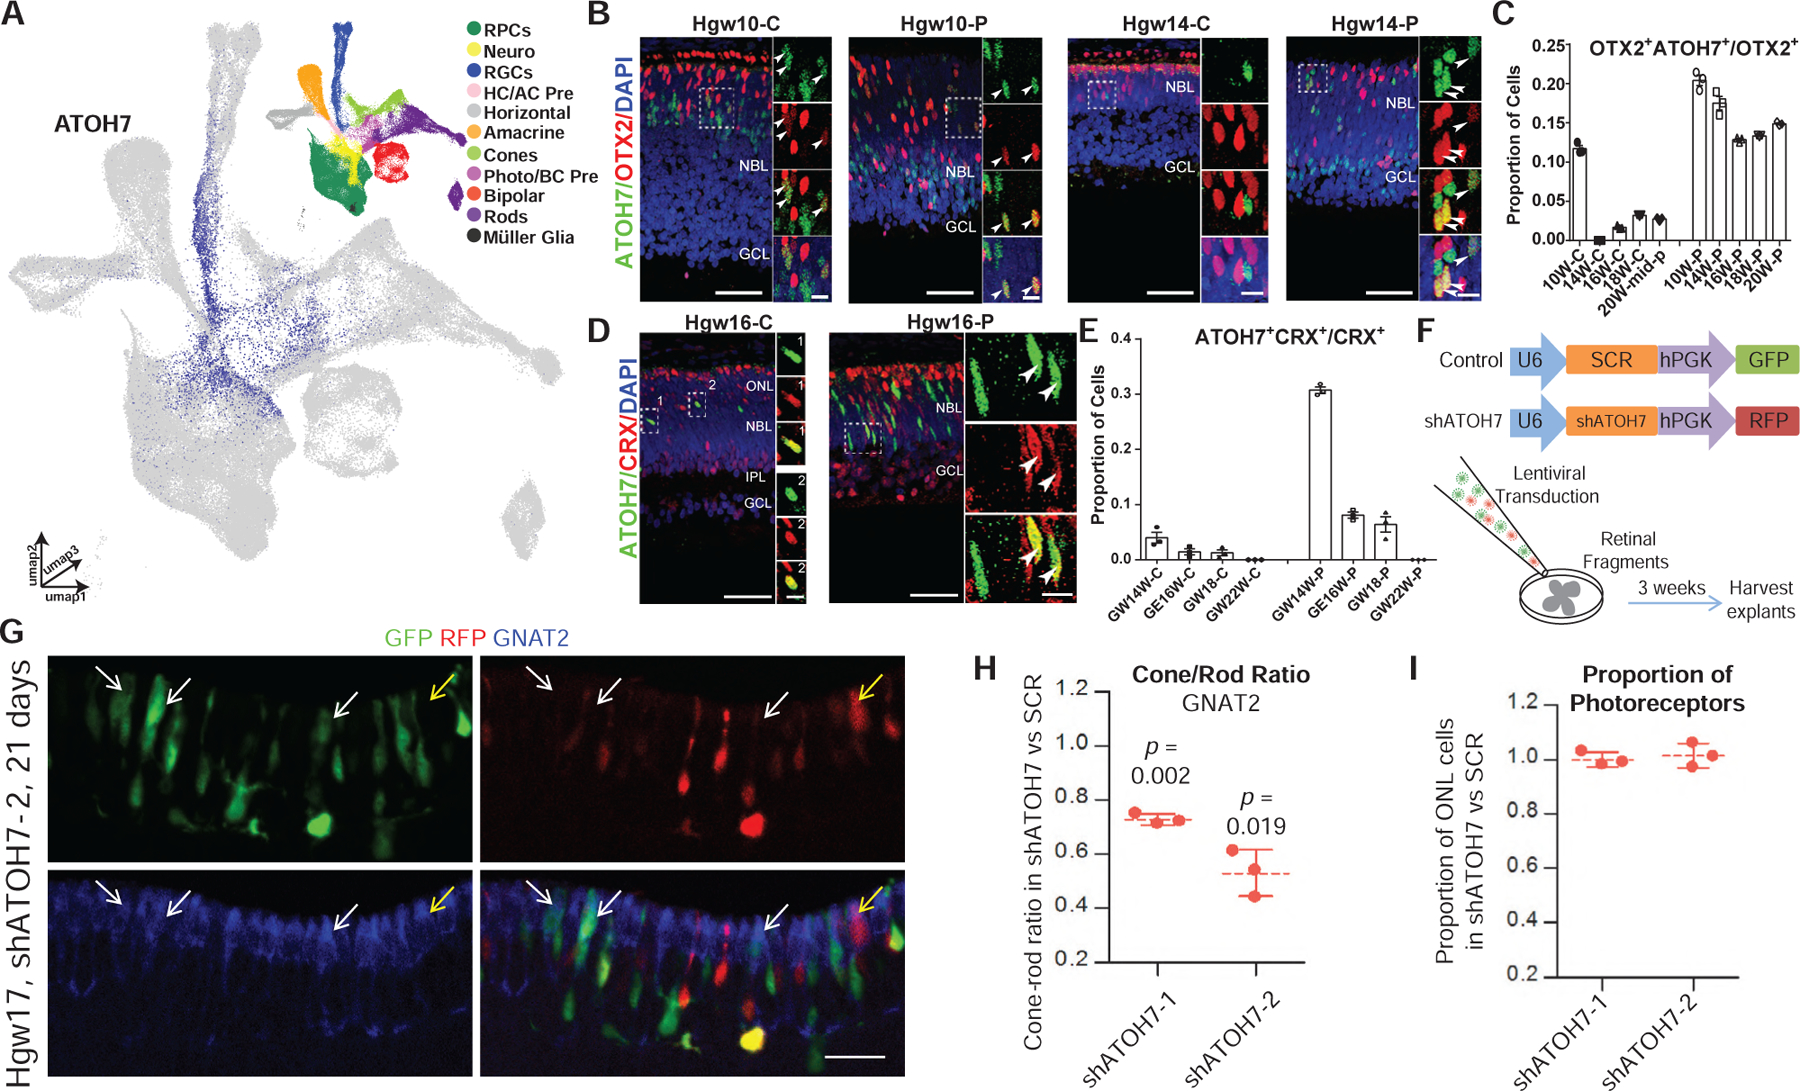
The development of single-cell RNA sequencing (scRNA-seq) has allowed high-resolution analysis of cell-type diversity and transcriptional networks controlling cell-fate specification. To identify the transcriptional networks governing human retinal development, we performed scRNA-seq analysis on 16 time points from developing retina as well as four early stages of retinal organoid differentiation. We identified evolutionarily conserved patterns of gene expression during retinal progenitor maturation and specification of all seven major retinal cell types. Furthermore, we identified gene-expression differences between developing macula and periphery and between distinct populations of horizontal cells. We also identified species-specific patterns of gene expression during human and mouse retinal development. Finally, we identified an unexpected role for ATOH7 expression in regulation of photoreceptor specification during late retinogenesis. These results provide a roadmap to future studies of human retinal development and may help guide the design of cell-based therapies for treating retinal dystrophies.

Keywords: cell fate; fovea; gene regulatory networks; neurogenesis; neurogenic bHLH factor; organoid; patterning; retina; single cell RNA-seq; transcription factors.


Conflict of interest statement

Declaration of Interests The authors declare no competing interests.

Figures

Figure 1.
Figure 1.. Single-Cell RNA-Seq Profiling of the Developing Human Retina
(A) Schematic of experimental design. (B and C) 3D UMAP embedding of the retina dataset, with individual cells colored by (B) age and (C) annotated cell types. (D and E) Spearman correlation between the transcriptomes of (D) human samples, or (E) across human and mouse retinal samples. (F) Normalized specification windows of retinal cell types. (G) Heatmap showing relative expression of transcripts with high specificity to individual cell types, ordered by cell type and developmental age (top annotation bars). (H–M) Immunohistochemistry on primary human retinal tissue validating the dynamic expression of cell-type markers, including (H) S-OPSIN (short wavelength cones); (I) L/M-OPSIN (long/medium wavelength cones); (J) Rho (rods); (K) PRKCA and VSX2 (bipolar cells); (L) BRN3A (RGCs) and calretinin (horizontal, amacrine, and RGC cells.); and (M) calbindin (Horizontal cells). Nuclei are counterstained with DAPI. Scale bar, 50 mm. Abbreviations: Hgw, human gestational weeks; Hpnd, human postnatal day; RPCs, retinal progenitor cells; RGCs, retinal ganglion cells; AC/HC Pre, amacrine cell-horizontal cell precursors; BC/Photo Pre, bipolar cell-photoreceptor cell precursors; NBL, neuroblast layer; GCL, ganglion cell layer; ONL, outer nuclear layer; OPL, outer plexiform layer; INL, inner nuclear layer; IPL, inner plexiform layer.
Figure 2.
Figure 2.. Pseudotime Analysis Reveals Genes Differentially Expressed across Primary and Neurogenic RPCs
(A–C) UMAP embedding of the developmental trajectories of primary RPCs and Müller glia with cells colored by (A) pseudotime, (B) cell type, and (C) developmental age. (D) Heatmap of differentially expressed transcripts along pseudotime from primary RPC to Müller glia. Cells are ordered by cell type and pseudotime with transcription factors listed in bold. (E) Immunohistochemistry detection for RLBP1 and MKI67 in GW12 (top panels), GW18-Central (bottom left), and GW27-Central retina (bottom right) with magnified views of GW12 central (top center) and peripheral (top right) regions. Nuclei are counterstained with DAPI. GW12 scale bar: 300 μm(left), 50 μm(center and middle), 10 μm (center side panels); GW18-C and GW27-C scale bar, 50 μm. (F) Bar chart showing the proportion of actively proliferating (MKI67+) cells among the RLBP1+ population, as detected by immunohistochemistry, in the central and peripheral regions across the developing human retina (GW12, GW14, GW16, GW18, GW22, GW24, and GW27). Data are mean ± SEM. (G) Immunohistochemistry of SOX2 and RLBP1 in central regions of developing human retinas at GW12, 18, and 27. High-magnification images are of the boxed region in the GW12 image. Open arrowheads indicate co-localization, with closed arrowheads indicating failure to detect RLBP1 expression. Nuclei are counterstained with DAPI. GW12 scale bar, 50 μm (left), 10 μm (right); GW18-C and GW27-C scale bar, 50 μm. (H–J) UMAP embedding of primary and neurogenic RPCs with cells colored by (H) pseudotime, (I) cell type, and (J) developmental age. (K) Heatmap of differential transcript expression along pseudotime from primary RPC to neurogenic RPC. Cells are ordered by cell type and pseudotime with transcription factors listed in bold. (L) Graph showing the normalized and smoothed expression of early and late neurogenic genes across the neurogenic trajectory relative to expression at the earliest point of neurogenic cell pseudotime. Abbreviations: Hgw, human gestational weeks; GW, gestational weeks; Hpnd, human postnatal day; NBL, neuroblast layer; GCL, ganglion cell layer; ONL, outer nuclear layer; OPL, outer plexiform layer; INL, inner nuclear layer; IPL, inner plexiform layer; C, central retina; P, peripheral retina.
Figure 3.
Figure 3.. Pseudotime Analyses Identify Transcription Factor Networks Controlling Human Retinal Cell Fate Specification
(A–T) UMAP embeddings of cellular inputs for pseudotime analyses of (A–D) retinal ganglion cells, (E–H) horizontal cells, (I–L) amacrine cells, (M–P) rods-cones, and (Q–T) photoreceptor-bipolar cells. UMAP plots are colored by (A, E, I, M, and Q) cellular pseudotime values, (B, F, J, N, and R) age, and (C, G, K, O, and S) cell type. UMAP embeddings shown are subsets of initial dimension reductions. (A–C) contain only RPCs that contribute to the RGC trajectory while (E–T) include all RPCs. (D, H, L, P, and T) heatmap showing relative expression of differentially expressed transcription factors across pseudotime, highlighting transcription factors with enriched expression in endpoint cell types. Abbreviations: Hgw, human gestational weeks; Hpnd, human postnatal day; RPC, retinal progenitor cells; RGC, retinal ganglion cells; Photo, photoreceptors; BC/Photo Pre, bipolar cell/photoreceptor precursors.
Figure 4.
Figure 4.. Identification of Macular RPC Transcripts for Regional Specification of the Developing Human Retina
(A–C) (A) Dot plot of differentially expressed genes between macular and peripheral retina RPCs and their relative expression and percentage of expressing cells in RPCs in each sample. The bolded Hgw20_rep1 sample highlights a macular sample containing significant numbers of RPCs. (B and C) RNAscope detecting (B) CYP26A1 and SFRP1 and (C) CYP26A1, RLBP1, and DIO2 transcripts in macular, central, and peripheral Hgw18 retina samples with high-magnification images of boxed regions. Nuclei are counterstained with DAPI. Scale bar, 50 μm and 10 μm (magnified views). (D) Proportion of macular and peripheral RPCs as classified by CYP26A1, CDKN1A, DIO2, ANXA2, or FRZB expression at each age. (E) Heatmap showing cell-type expression enrichment of differentially expressed transcripts between the inferred macular and peripheral RPCs. (F) Bar plots showing proportion of cells expressing macular RPC enriched genes within each sample type. Abbreviations: Hgw, human gestational weeks; M, macular retina; C, central retina; P, peripheral retina; NBL, neuroblast layer; GCL, ganglion cell layer; ONL, outer nuclear layer; OPL, outer plexiform layer; INL, inner nuclear layer; IPL, inner plexiform layer; RPCs, retinal progenitor cells; AC/HC Pre, amacrine cell/horizontal cell precursors; BC/Photo Pre, bipolar cell/photoreceptor precursors; RGCs, retinal ganglion cells.
Figure 5.
Figure 5.. Identification and Differentiation of Two Horizontal Cell Subtypes within the Developing Human Retina
(A–C) UMAP embedding of horizontal cells, colored by (A) age or (B–C) relative expression of (B) LHX1 and (C) ISL1. (D–G) RNAScope detecting expression of LHX1 and ISL1 transcripts in central (D and E) and peripheral (F and G) Hgw18 and Hgw27 human retina, with higher-magnification views of the boxed regions. Nuclei are counterstained with DAPI. Scale bar, 50 μm and 10 μm (magnified views). (H) Quantification of the proportions of each horizontal cell subtype in central and peripheral retina at ages Hgw18 and 27 from fluorescent in situ hybridization experiments. Data are mean ± SEM. (I) Heatmap showing relative cell type expression of horizontal cell commitment, differentiation, and subtype specification genes. Abbreviations: Hgw, human gestational weeks; Hpnd, human postnatal day; C, central retina; P, peripheral retina; NBL, neuroblast layer; GCL, ganglion cell layer; ONL, outer nuclear layer; OPL, outer plexiform layer; INL, inner nuclear layer; IPL, inner plexiform layer; AC/HC Pre., amacrine cell/horizontal cell precursors; Commit HCs, committed horizontal cells; ISL1 HCs, ISL1-positive horizontal cells; LHX1 HCs, LHX1-positive horizontal cells.
Figure 6.
Figure 6.. Cross-Species Comparisons of Gene Usage Using scCoGAPS and ProjectR Reveals Conserved and Divergent Pattern Usage across Human and Mouse Retinal Cell Types
(A) Plot indicating maximally correlated retinal cell types in mouse (y axis) and human (x axis) of human patterns. Correlation values are indicated through size of the point for human cell types, and color of the dot and label for mouse cell types. (B) Heatmap indicating the intersection of correlations of Human Pattern 75 for human (x axis) and mouse (y axis) cell types. (C and D) UMAP embeddings of (C) human and (D) mouse scRNA-seq datasets, with cells colored by Human Pattern 75 pattern weights. (E) Heatmap of relative gene expression within (top) human or (bottom) mouse cell types for the top 50 weighted genes of Human Pattern 75. Genes are ordered by relative gene weights. (F and G) UMAP embeddings displaying LOXL1/Loxl1 expression within (F) human and (G) mouse retinal scRNA-seq datasets. (H) Plot of maximally correlated retinal cell types in mouse (y axis) and human (x axis) of mouse patterns. Correlation values are indicated through size of the point for human cell types, and color of the dot and label for mouse cell types. (I) Heatmap indicating the intersection of correlations of Mouse Pattern 20 for human (x axis) and mouse (y axis) cell types. (J and K) UMAP embeddings of (J) human and (K) mouse scRNA-seq datasets, with cells colored by Mouse Pattern 20 pattern weights. (L) Heatmap of relative gene expression within (top) mouse or (bottom) human cell types for the top 50 weighted genes of Mouse Pattern 20 and their orthologs in human (bottom). Genes are ordered by relative gene weights. (M and N) Boxplots displaying the log2(expression + 1) of TUBB4B in each (M) human and (N) mouse retinal cell type. Abbreviations: AC/HC Pre., amacrine cell/horizontal cell precursors; RGCs, retinal ganglion cells; RPCs, retinal progenitor cells; BC/Photo Pre, bipolar cell/photoreceptor precursors; Photo Pre, photoreceptor precursors; hPatt, human pattern; mPatt, mouse pattern.
Figure 7.
Figure 7.. Knockdown of ATOH7 Promotes Differentiation of Rod Photoreceptor at the Expense of Late-Born Cones
(A) UMAP embedding of the retinal scRNA-seq dataset, colored by relative expression of ATOH7 and cell type annotation (top right). (B) Immunostaining for ATOH7 and OTX2 in central and peripheral Hgw10 and Hgw14 retinas, with magnified views of boxed regions. Scale bar, 50 μm and 10 μm (magnified views) (C) Quantification of OTX2+ cells that are also ATOH7+ in central and peripheral retina at various ages. Data are presented as means ± SEM. (D) Immunostaining for ATOH7 and CRX in the central and peripheral Hgw16 retina, with zoomed in views of boxed regions. Hgw16-C scale bar, 50 (left), 5 μm (right); Hgw16-P scale bar: 50 (left), 10 μm (right). Arrowheads indicate co-localization of markers and nuclei are counterstained with DAPI in panels B+D. (E) Quantification of CRX+ cells that are also ATOH7+ in central and peripheral retina at various ages. Data are presented as means ± SEM. (F) Schematic diagram of ATOH7 knockdown experiment. (G) Representative image from human retinal explants co-transduced with shSCR (GFP) and shATOH7–2 (RFP) lentiviruses and stained with cone marker GNAT2 (blue). White arrows, GNAT2+ cells expressing shSCR; yellow arrow, GNAT2+ cells expressing shATOH7. Scale bars, 20 μm. (H) Ratio of cones/rods in shATOH7 versus shSCR cells. Data are presented as means ± SD with p-values indicating results of a paired t-test. (I) Ratio of the ONL proportions in shATOH versus shSCR cells. Data are presented as means ± SD. Abbreviations: RPCs, retinal progenitor cells; Neuro, neurogenic cells; RGCs, retinal ganglion cells; HC/AC Pre, horizontal cell-amacrine cell precursors; Photo/BC Pre, photoreceptor-bipolar cell precursors; Hgw, human gestational weeks; GW, gestational weeks; C, central retina; P, peripheral retina; NBL, neuroblast layer; GCL, ganglion cell layer; ONL, outer nuclear layer; INL, inner nuclear layer; IPL, inner plexiform layer; C, central retina; P, peripheral retina.

References

    1. Ajioka I, Martins RAP, Bayazitov IT, Donovan S, Johnson DA, Frase S, Cicero SA, Boyd K, Zakharenko SS, and Dyer MA (2007). Differentiated horizontal interneurons clonally expand to form metastatic retinoblastoma in mice. Cell 131, 378–390. - PMC - PubMed
    1. Ayyaz A, Kumar S, Sangiorgi B, Ghoshal B, Gosio J, Ouladan S, Fink M, Barutcu S, Trcka D, Shen J, et al. (2019). Single-cell transcriptomes of the regenerating intestine reveal a revival stem cell. Nature 569, 121–125. - PubMed
    1. Balasubramanian R, and Gan L (2014). Development of retinal amacrine cells and their dendritic stratification. Curr. Ophthalmol. Rep 2, 100–106. - PMC - PubMed
    1. Becht E, McInnes L, Healy J, Dutertre CA, Kwok IWH, Ng LG, Ginhoux F, and Newell EW (2018). Dimensionality reduction for visualizing single-cell data using UMAP. Nat. Biotechnol 10.1038/nbt.4314. - DOI - PubMed
    1. Blackshaw S, Harpavat S, Trimarchi J, Cai L, Huang H, Kuo WP, Weber G, Lee K, Fraioli RE, Cho SH, et al. (2004). Genomic analysis of mouse retinal development. PLoS Biol 2, E247. - PMC - PubMed

Publication types

Substances