. 2020 Jul:325:108370.
doi: 10.1016/j.mbs.2020.108370. Epub 2020 May 6.

Modeling behavioral change and COVID-19 containment in Mexico: A trade-off between lockdown and compliance

Affiliations

Modeling behavioral change and COVID-19 containment in Mexico: A trade-off between lockdown and compliance

Manuel Adrian Acuña-Zegarra et al. Math Biosci. 2020 Jul.

Abstract

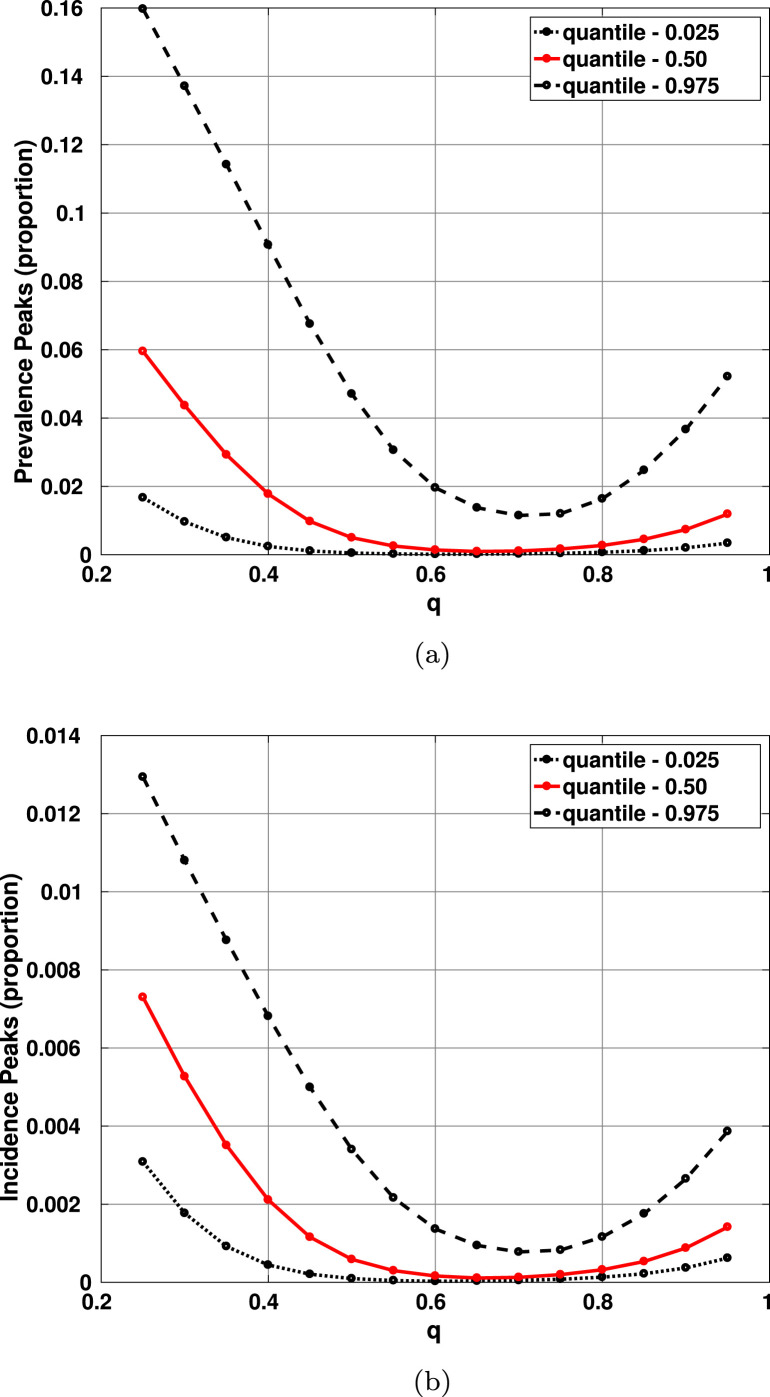
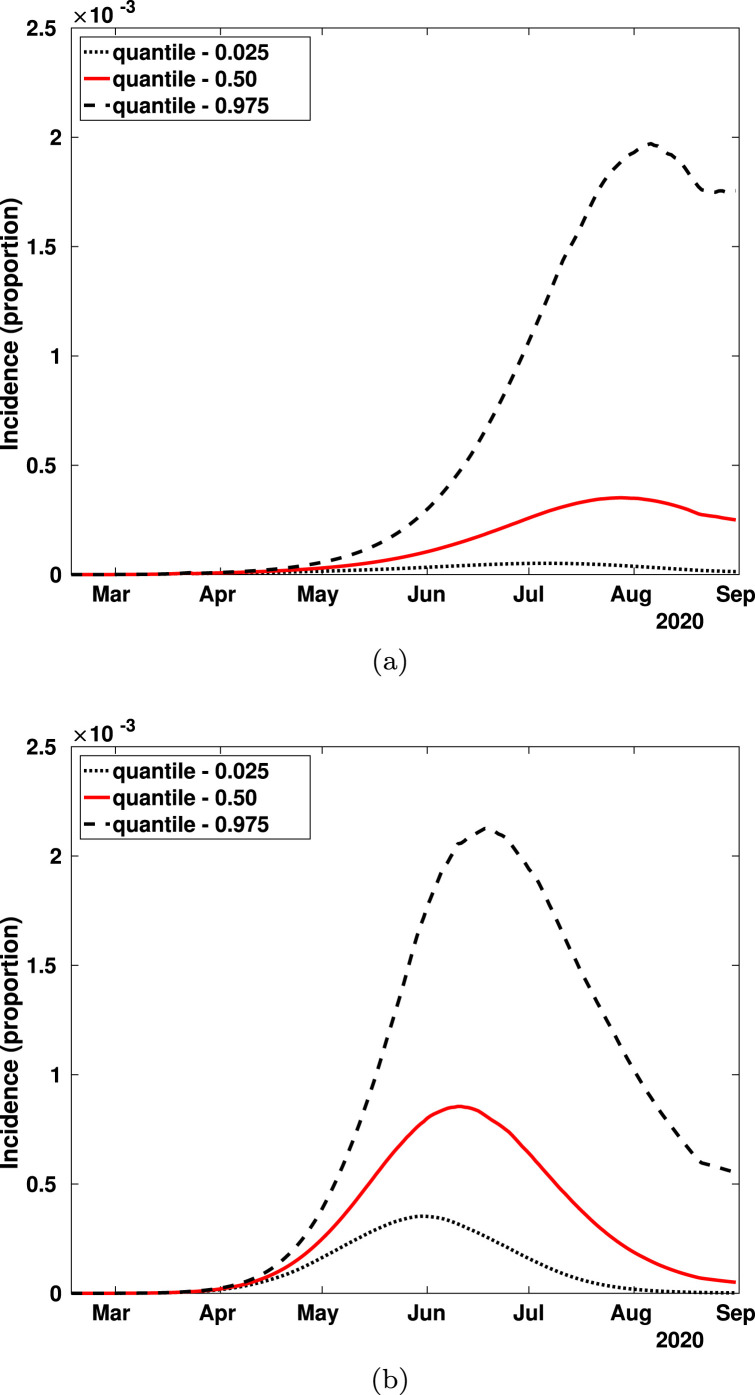
Sanitary Emergency Measures (SEM) were implemented in Mexico on March 30th, 2020 requiring the suspension of non-essential activities. This action followed a Healthy Distance Sanitary action on March 23rd, 2020. The aim of both measures was to reduce community transmission of COVID-19 in Mexico by lowering the effective contact rate. Using a modification of the Kermack-McKendrick SEIR model we explore the effect of behavioral changes required to lower community transmission by introducing a time-varying contact rate, and the consequences of disease spread in a population subject to suspension of non-essential activities. Our study shows that there exists a trade-off between the proportion of the population under SEM and the average time an individual is committed to all the behavioral changes needed to achieve an effective social distancing. This trade-off generates an optimum value for the proportion of the population under strict mitigation measures, significantly below 1 in some cases, that minimizes maximum COVID-19 incidence. We study the population-level impact of three key factors: the implementation of behavior change control measures, the time horizon necessary to reduce the effective contact rate and the proportion of people under SEM in combating COVID-19. Our model is fitted to the available data. The initial phase of the epidemic, from February 17th to March 23rd, 2020, is used to estimate the contact rates, infectious periods and mortality rate using both confirmed cases (by date of symptoms initiation), and daily mortality. Data on deaths after March 23rd, 2020 is used to estimate the mortality rate after the mitigation measures are implemented. Our simulations indicate that the most likely dates for maximum incidence are between late May and early June, 2020 under a scenario of high SEM compliance and low SEM abandonment rate.

Keywords: Bayesian inference; Behavioral change; COVID-19; Contact rate reduction; Disease dispersal; Isolation.


Conflict of interest statement

Declaration of Competing Interest The authors declare that they have no known competing financial interests or personal relationships that could have appeared to influence the work reported in this paper.

Figures

Fig. 1
Fig. 1
Flow diagram of the mathematical model. The state variables S, E, Ia, Is, R, D represent the populations of susceptible, exposed, asymptomatically infected, symptomatically infected, recovered and dead individuals, respectively. Before time Tθ, the dynamics of the pandemic is represented in diagram (A). Once SEM are implemented at time Tθ, the population splits into two: one with a proportion q that follows the mitigation actions (B), and the other, with proportion 1q that does not (C). These two populations do not mix. We have variable effective contact rates for asymptomatically (βa(t)) and symptomatically (βs(t)) infected populations. The parameter ρ is the proportion of asymptomatically infectious individuals, 1γ is the incubation period, 1ηa and 1ηs are the infectious periods. Finally, 1ω is the average time an individual strictly adheres to all the behavioral requirements of effective SEM or social distancing measures (e.g., not leaving home, washing hands, frequently cleaning common surfaces, using masks, etc.).
Fig. 2
Fig. 2
Schematic diagram of the general effective contact rate function for the model in Fig. 1. Orange line represents the starting contact rate bk until sanitary actions are enforced at time Tθ. Blue line shows the time dependent contact rate βk(t), and α1bk is the target contact rate. θ1 is the time to achieve the desired reduction in contact rate. The parameter βˆk(t) follows the same behavior.
Fig. 3
Fig. 3
Model fit and observed data. Daily confirmed COVID-19 cases in Mexico City from February 17th, 2020 to March 22nd, 2020 are represented by gray bars. The red line is the median estimate for the model and black lines are 95% point-wise probability intervals..
Fig. 4
Fig. 4
95% credible intervals and median estimates for the dates when the peaks in prevalence and incidence are projected to occur. Notice that the earliest date occurs q0.7. (a) Date of maximum prevalence as a function of q; (b) date of maximum incidence as a function of q. All other parameters are set at their baseline values. The upper black lines are broken because the simulations are stopped in middle August.
Fig. 5
Fig. 5
95% credible intervals and median estimates for the maximum prevalence and incidence as functions of q. Notice that the smaller magnitudes occur for q0.7. (a) Maximum prevalence as a function of q; (b) maximum incidence as a function of q. All other parameters are set at their baseline values. The upper black lines are broken because the simulations are stopped in middle August.
Fig. 6
Fig. 6
95% credible intervals and median estimates for the cumulative incidence as a function of q before and after the maximum peak. (a) Cumulative incidence for April 30th; (b) cumulative incidence for August 31st. All other parameters are set at their baseline values.
Fig. 7
Fig. 7
Symptomatic maximum incidence as a function of q, the proportion of the population under SEM, and 1ω, the average time an individual is committed to all the behavioral requirements of effective social distancing. The trade-off between SEM and adequate behavioral traits associated with effective social distancing is apparent. All other parameters at their baseline values.
Fig. 8
Fig. 8
95% credible intervals and median estimates for incidence as a function of q. (a) 50% of individuals obey SEM (q=0.5); (b) 95% of individuals obey SEM (q=0.95).
Fig. 9
Fig. 9
Histogram for the maximum incidence dates. (a) 50% of individuals obey SEM (q=0.5); (b) 95% of individuals SEM (q=0.95). We run the simulations for ba, bs and η varying within their corresponding 95% credible intervals as reported in Table 1.
Fig. 10
Fig. 10
Histogram for the maximum incidence dates for q=0.7. We run the simulations for ba, bs, ηa and ηs varying within their corresponding 95% credible intervals reported in Table 1. (a) Estimated infectious periods for asymptomatically (1ηa=5.97) and symptomatically (1ηs=10.81) infectious individuals. (b) Infectious periods for asymptomatically and symptomatically infected individuals are equal (1ηa=1ηs=5.97). Note that the mode of the empirical distribution is located around the middle of May and that the distribution allows for later peak dates.
Fig. 11
Fig. 11
Instantaneous reproduction number for Mexico City using a median serial interval of 4.9 days . The Figure shows the estimates from the start of the pandemic up to March 23rd, 2020 (start of SEM); from March 24th, 2020 to March, 30th, 2020 (suspension of non-essential activities) and from March 31st, to April 10th, 2020. SEM measures where implemented on March 23rd, and March 30th, 2020.

References

    1. de Epidemiologia D.G. March 2020. Comunicado tecnico 238449. [Online]. Available: https://www.gob.mx/salud/documentos/
    1. Review W.P. May 2020. Mexico Population 2020. [Online]. Available: https://worldpopulationreview.com/countries/mexico-population/
    1. Miranda P. March 2020. Sector salud con 4291 camas y 2053 ventiladores para combatir coronavirus. El Universal. [Online]. Available: www.eluniversal.com.mx/nacion/sector-salud-con-4291-camas-y-2053-ventila....
    1. Nishiura P., Kobayashi, Yang, Hayashi, Miyama, Kinoshita, Linton, Jung, Yuan, Suzuki, Akhmetzhanov The rate of underascertainment of Novel Coronavirus (2019-nCoV) infection: Estimation using Japanese passengers data on evacuation flights. J. Clin. Med. 2020;9(2):419. - PMC - PubMed
    1. Flaxman S., Mishra S., Gandy A., Unwin H.J.T., Coupland H., Mellan T.A., Berah T., Eaton J.W., Guzman P.N.P., Schmit N., Cilloni L., Ainslie K.E.C., Blake I., Boonyasiri A., Boyd O., Cattarino L., Ciavarella C., Cooper L., Cucunubá Z., Cuomo-dannenburg G., Dighe A., Djaafara B., Dorigatti I., Elsland S.V. Imperial College COVID-19 Response Team; March 2020. Estimating the Number of Infections and the Impact of Non- Pharmaceutical Interventions on COVID-19 in 11 European Countries: Tech. Rep. pp. 1–35.

Publication types

LinkOut - more resources