. 2020 Aug 15:217:116907.
doi: 10.1016/j.neuroimage.2020.116907. Epub 2020 May 6.

Vascular physiology drives functional brain networks

Affiliations

Vascular physiology drives functional brain networks

Molly G Bright et al. Neuroimage. .

Abstract

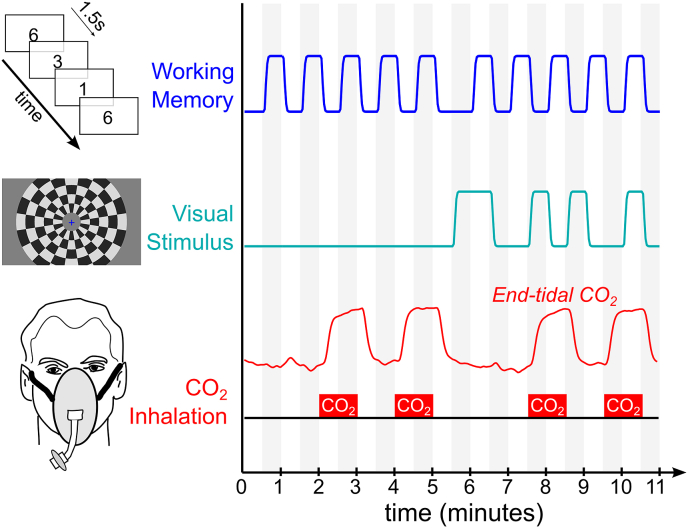
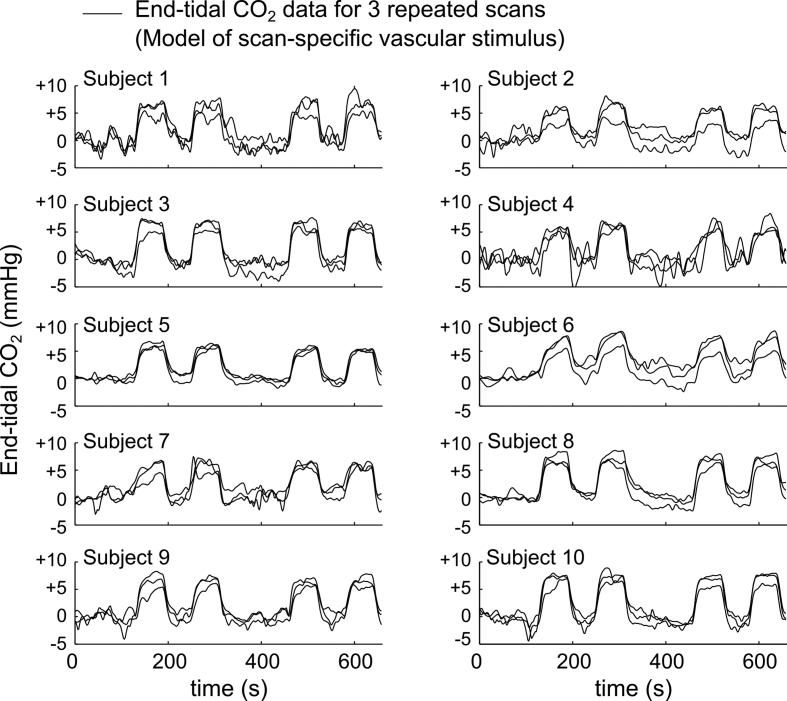
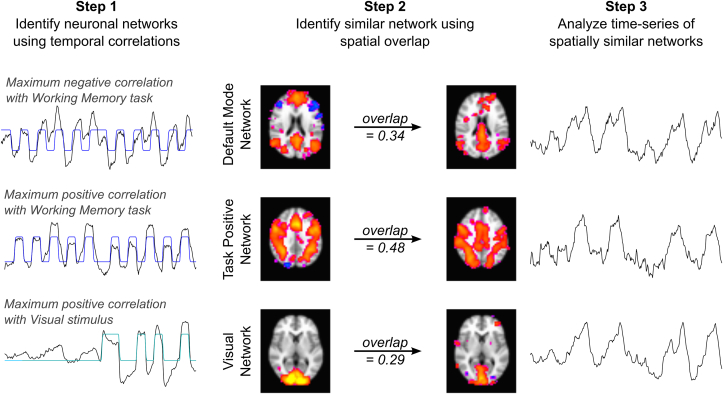
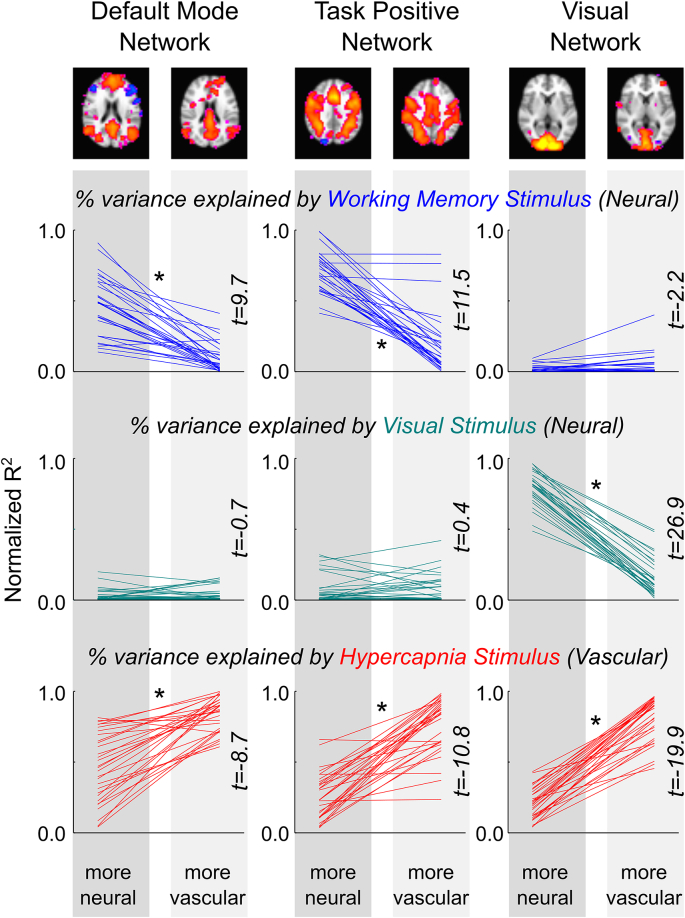
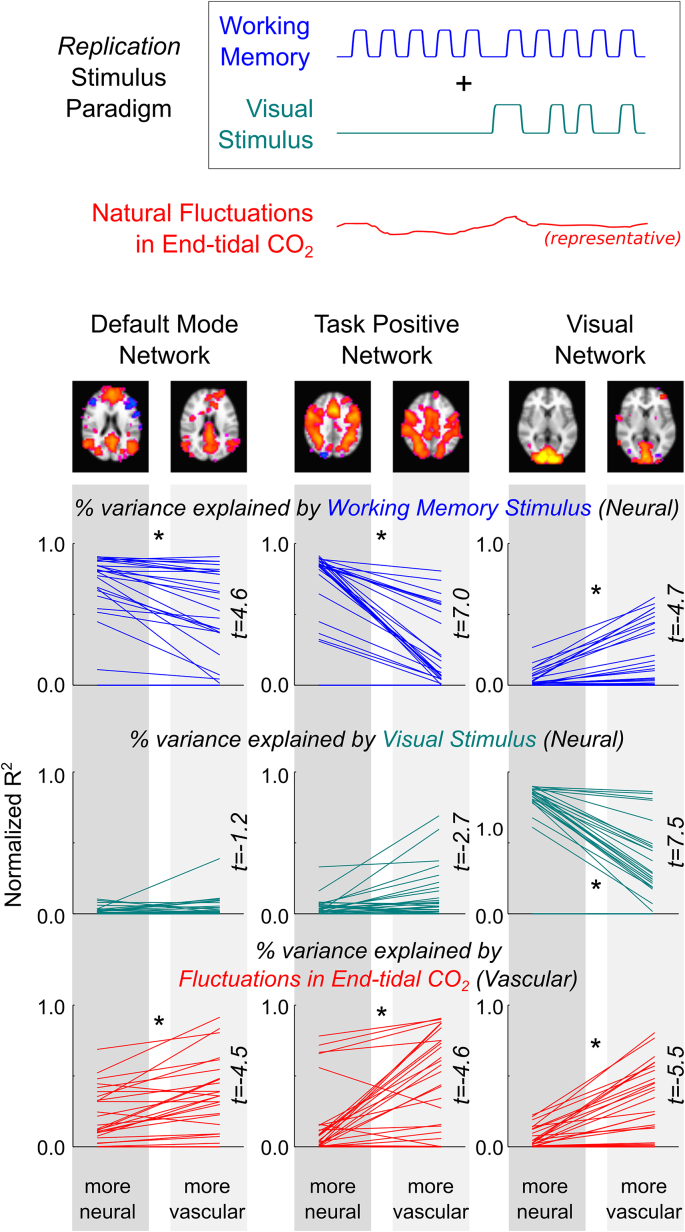
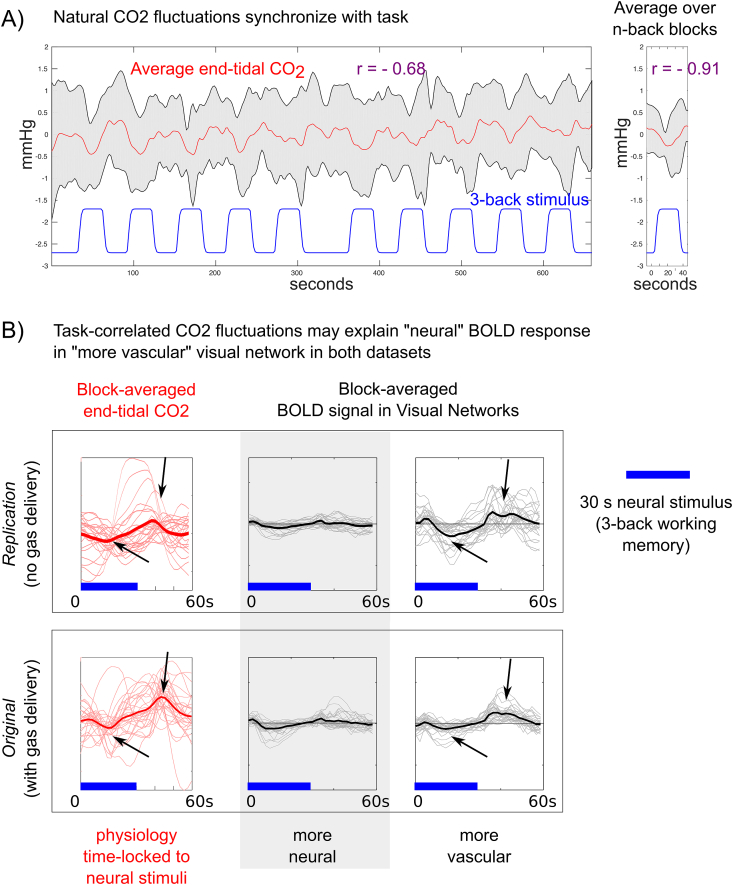
We present the first evidence for vascular regulation driving fMRI signals in specific functional brain networks. Using concurrent neuronal and vascular stimuli, we collected 30 BOLD fMRI datasets in 10 healthy individuals: a working memory task, flashing checkerboard stimulus, and CO2 inhalation challenge were delivered in concurrent but orthogonal paradigms. The resulting imaging data were averaged together and decomposed using independent component analysis, and three "neuronal networks" were identified as demonstrating maximum temporal correlation with the neuronal stimulus paradigms: Default Mode Network, Task Positive Network, and Visual Network. For each of these, we observed a second network component with high spatial overlap. Using dual regression in the original 30 datasets, we extracted the time-series associated with these network pairs and calculated the percent of variance explained by the neuronal or vascular stimuli using a normalized R2 parameter. In each pairing, one network was dominated by the appropriate neuronal stimulus, and the other was dominated by the vascular stimulus as represented by the end-tidal CO2 time-series recorded in each scan. We acquired a second dataset in 8 of the original participants, where no CO2 challenge was delivered and CO2 levels fluctuated naturally with breathing variations. Although splitting of functional networks was not robust in these data, performing dual regression with the network maps from the original analysis in this new dataset successfully replicated our observations. Thus, in addition to responding to localized metabolic changes, the brain's vasculature may be regulated in a coordinated manner that mimics (and potentially supports) specific functional brain networks. Multi-modal imaging and advances in fMRI acquisition and analysis could facilitate further study of the dual nature of functional brain networks. It will be critical to understand network-specific vascular function, and the behavior of a coupled vascular-neural network, in future studies of brain pathology.

Keywords: Brain; Networks; Neurovascular; Vascular; fMRI.


Conflict of interest statement

Declaration of competing interest The authors declare no competing financial interests.

Figures

Fig. 1
Fig. 1
Schematic of neuro-vascular stimulus paradigm. The neuronal stimuli (working memory task and flashing checkerboard pattern) were presented in a block design, which was convolved with a hemodynamic response function to model the resulting BOLD signal. Four 1-min blocks of hypercapnia were induced via gas inhalation, and modeled in a subject-specific manner by extracting the end-tidal CO2 data and convolving with a hemodynamic response function.
Fig. 2
Fig. 2
End-tidal CO2 data for all scans. Data for 30 scans (3 repeated scans per participant) were convolved with a hemodynamic response function, and represented the scan-specific vascular stimulus. For illustration purposes, data were normalized to the baseline end-tidal CO2 level (mean value in the first 100 ​s of the scan).
Fig. 3
Fig. 3
Identification of spatially similar component pairs for three functional brain networks. 1) The three components with maximum temporal correlation with the neuronal stimuli were identified as ‘neuronal’ networks. 2) For each neuronal network, an additional component with the maximal spatial overlap was identified. 3) The temporal characteristics of these spatially similar components were used to assess the underlying neuronal or vascular mechanisms.
Fig. 4
Fig. 4
Neuronal and vascular contributions to spatially similar network components. Using dual-regression, the component time-series for the three network pairs (Default Mode Network, Task Positive Network, Visual Network) were obtained in the original 30 datasets. The normalized R2 values (percentage of explained variance) were calculated for each stimulus. For each functional brain network pair, one was found to be significantly more associated with the appropriate neuronal stimulus and the other significantly more associated with the vascular CO2 stimulus (∗p ​< ​0.05, paired t-tests, corrected for multiple comparisons).
Fig. 5
Fig. 5
The spatial maps extracted in the original dataset were applied to a second dataset to test the replicability and generalizability of our primary observations. In these new data, no hypercapnia stimulus was administered and end-tidal CO2 was allowed to fluctuate naturally. Eight of the original 10 participants were re-scanned, 3 times each, using only the working memory and visual stimuli. The networks identified in the original data were regressed onto the new data, and the associated time-series were extracted and analyzed as before. Significant differences in the normalized R2 values, in good agreement with the original observations in the first study, are indicated by asterisks (∗p ​< ​0.05, paired two-tailed Student t-tests, Bonferroni corrected for multiple comparisons). Note an unexpected, significant relationship between the “more vascular” Visual Network data and the working memory stimulus, not observed in the original dataset (Fig. 4).
Fig. 6
Fig. 6
Evidence for task-correlated changes in vascular physiology and its effect on the “more vascular” networks in the Replication dataset. A) In the absence of a hypercapnia gas inhalation stimulus, end-tidal CO2 fluctuated with each individual’s natural variations in breathing. The group average end-tidal CO2 trace across all scans in the Replication dataset (red, standard deviation shown in gray) is plotted, with the 3-back working memory stimulus paradigm (blue) provided as a reference. The block average across the 10 blocks of the 3-back task is also shown. Pearson correlation coefficients between the CO2 data and the stimulus are given (r ​= ​−0.68 across the entire time-series, r ​= ​−0.91 in the block-average data). B) The average end-tidal CO2 data and the block-average BOLD response evoked by the 3-back working memory task (blue bars) in the “more neural” and “more vascular” visual networks (thin lines represent the data from each individual scan, thick lines represent the average of 30 scans). These results demonstrate that the task-correlated changes in end-tidal CO2 appear to drive the signal fluctuations in the “more vascular” visual network. Because these effects manifest as negative BOLD signal changes time-locked to the working memory task, and visual activation during the working memory task would evoke positive BOLD signal changes, this is further evidence for a vascular driver of this functional network system.

References

    1. Achakri H., Stergiopulos N., Hoogerwerf N., Hayoz D., Brunner H.R., Meister J.J. Intraluminal pressure modulates the magnitude and the frequency of induced vasomotion in rat arteries. J. Vasc. Res. 1995;32(4):237–246. doi: 10.1159/000159098. - DOI - PubMed
    1. Beckmann C.F., Smith S.M. Probabilistic independent component analysis for functional magnetic resonance imaging. IEEE Trans. Med. Imag. 2004;23(2):137–152. doi: 10.1109/TMI.2003.822821. - DOI - PubMed
    1. Birn R.M., Murphy K., Handwerker D.A., Bandettini P.A. fMRI in the presence of task-correlated breathing variations. Neuroimage. 2009;47(3):1092–1104. doi: 10.1016/j.neuroimage.2009.05.030. - DOI - PMC - PubMed
    1. Black J.E., Isaacs K.R., Anderson B.J., Alcantara A.A., Greenough W.T. Learning causes synaptogenesis, whereas motor activity causes angiogenesis, in cerebellar cortex of adult rats. Proc. Natl. Acad. Sci. Unit. States Am. 1990;87(14):5568–5572. - PMC - PubMed
    1. Braga R.M., Buckner R.L. Parallel interdigitated distributed networks within the individual estimated by intrinsic functional connectivity. Neuron. 2017;95(2):457–471. doi: 10.1016/j.neuron.2017.06.038. e5. - DOI - PMC - PubMed

Publication types

MeSH terms