

Evidence that high temperatures and intermediate relative humidity might favor the spread of COVID-19 in tropical climate: A case study for the most affected Brazilian cities
- PMID: 32388137
- PMCID: PMC7194794
- DOI: 10.1016/j.scitotenv.2020.139090
Evidence that high temperatures and intermediate relative humidity might favor the spread of COVID-19 in tropical climate: A case study for the most affected Brazilian cities
Abstract
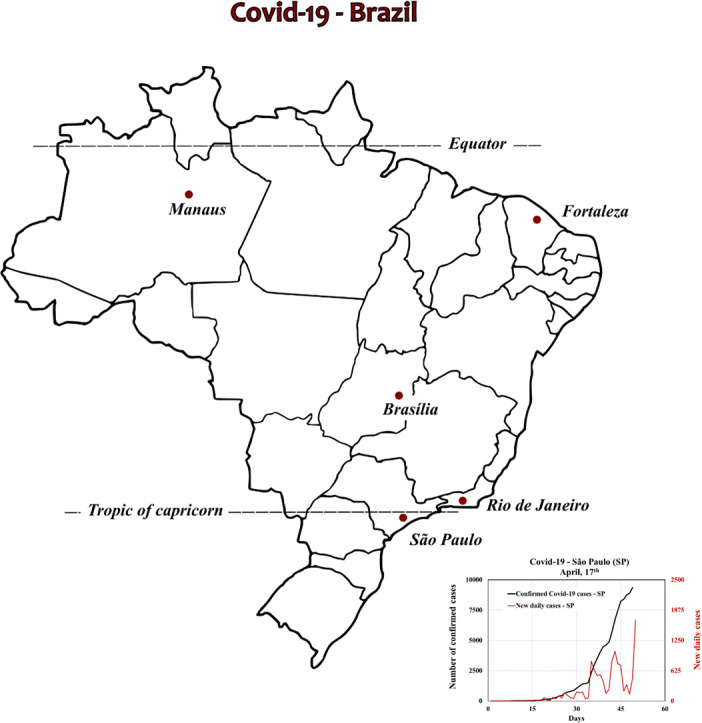
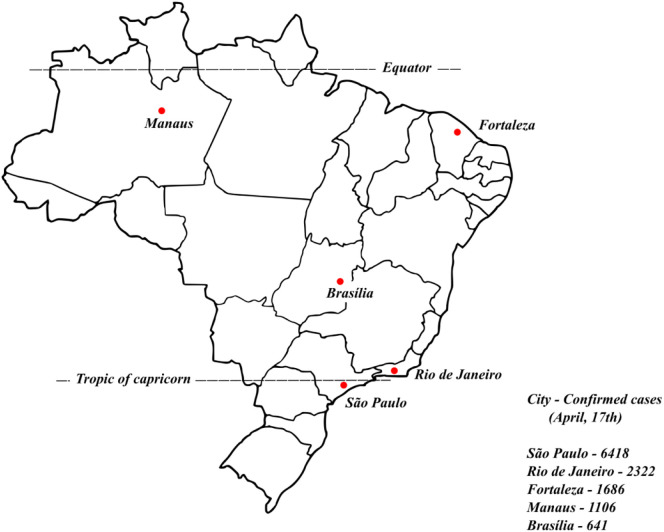
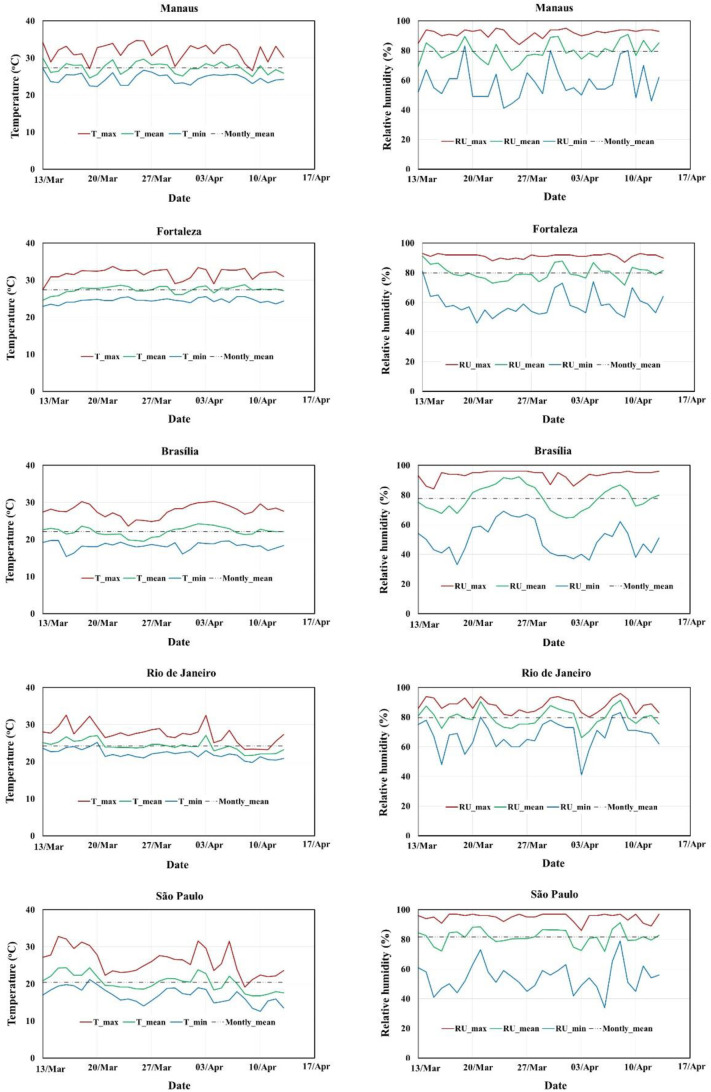
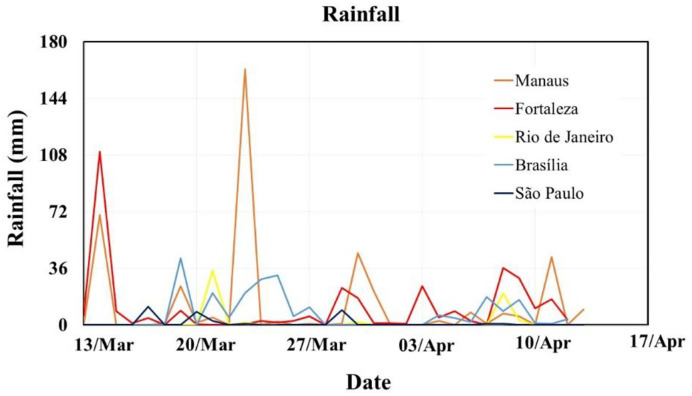
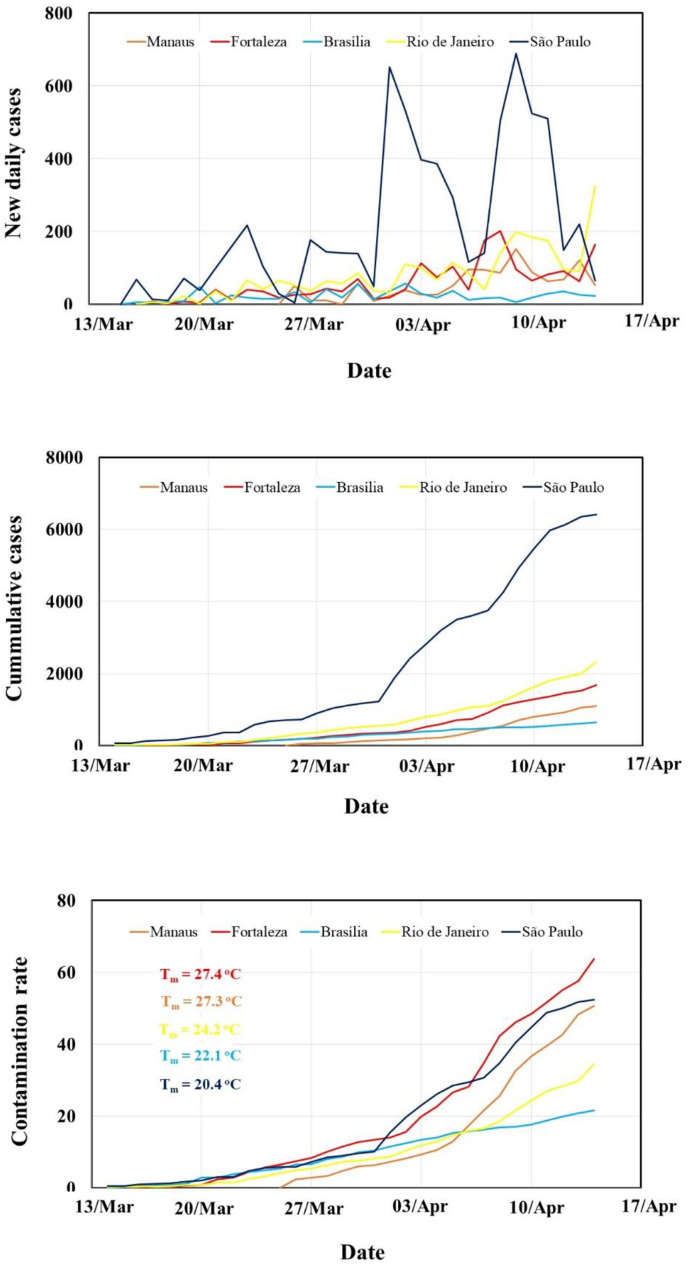
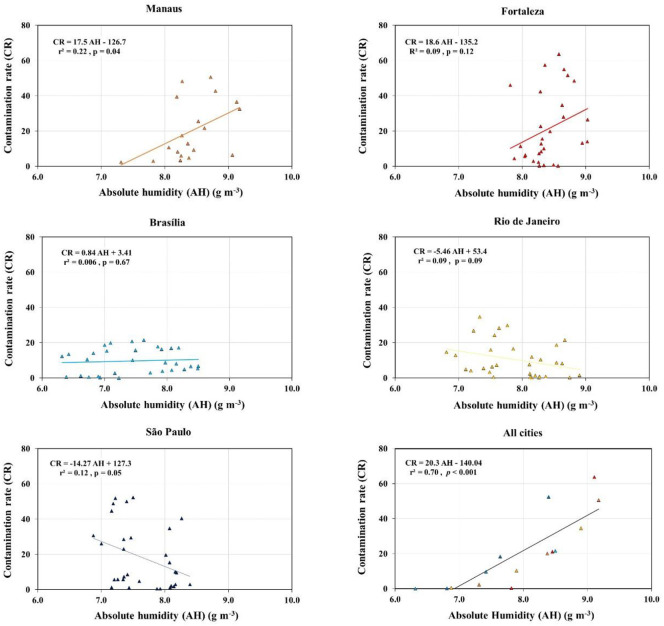
This study aimed to analyze how meteorological conditions such as temperature, humidity and rainfall can affect the spread of COVID-19 in five Brazilian (São Paulo, Rio de Janeiro, Brasília, Manaus and Fortaleza) cities. The cities selected were those with the largest number of confirmed cases considering data of April 13. Variables such as number of cumulative cases, new daily cases and contamination rate were employed for this study. Our results showed that higher mean temperatures and average relative humidity favored the COVID-19 transmission, differently from reports from coldest countries or periods of time under cool temperatures. Thus, considering the results obtained, intersectoral policies and actions are necessary, mainly in cities where the contamination rate is increasing rapidly. Thus, prevention and protection measures should be adopted in these cities aiming to reduce transmission and the possible collapse of the health system.
Keywords: Air temperature; Coronavirus; Humidity; Meteorology; Principal component analysis; SARS-CoV2.
Copyright © 2020 Elsevier B.V. All rights reserved.
Conflict of interest statement
Declaration of competing interest The authors declare that they have no known competing financial interests or personal relationships that could have appeared to influence the work reported in this paper.
Figures
Comment in
-
Besides the climate model, other variables driving the COVID-19 spread in Brazil.Sci Total Environ. 2020 Oct 1;737:140211. doi: 10.1016/j.scitotenv.2020.140211. Epub 2020 Jun 15. Sci Total Environ. 2020. PMID: 32600776 Free PMC article. No abstract available.
References
-
- Alvares C.A., Stape J.L., Sentelhas P.C., Gonçalves J.L.M., Spavorek G. Köppen’s climate classification map for Brazil. Meteorol. Z. 2013;22:711–728. doi: 10.1127/0941-2948/2013/0507. - DOI
-
- Araújo M.B., Naimi B. 2020. Spread of SARS-CoV-2 Coronavirus Likely Constrained by Climate. medRxiv preprint. - DOI
-
- Bu J., Peng D.D., Xiao H., Yue Q., Han Y., Lin Y., Hu G., Chen J. 2020. Analysis of Meteorological Conditions and Prediction of Epidemic Trend of 2019-nCoV Infection in 2020. medRxiv preprint. - DOI
-
- Bukhari Q., Jameel Y. 2020. Will Coronavirus Pandemic Diminish by Summer? Available at SSRN 3556998. - DOI
MeSH terms
LinkOut - more resources
Full Text Sources
Miscellaneous
