. 2020 Jul:128:104382.
doi: 10.1016/j.jcv.2020.104382. Epub 2020 Apr 23.

Multi-Stage Group Testing Improves Efficiency of Large-Scale COVID-19 Screening

Affiliations

Multi-Stage Group Testing Improves Efficiency of Large-Scale COVID-19 Screening

J N Eberhardt et al. J Clin Virol. 2020 Jul.

Abstract

Background: SARS-CoV-2 test kits are in critical shortage in many countries. This limits large-scale population testing and hinders the effort to identify and isolate infected individuals.

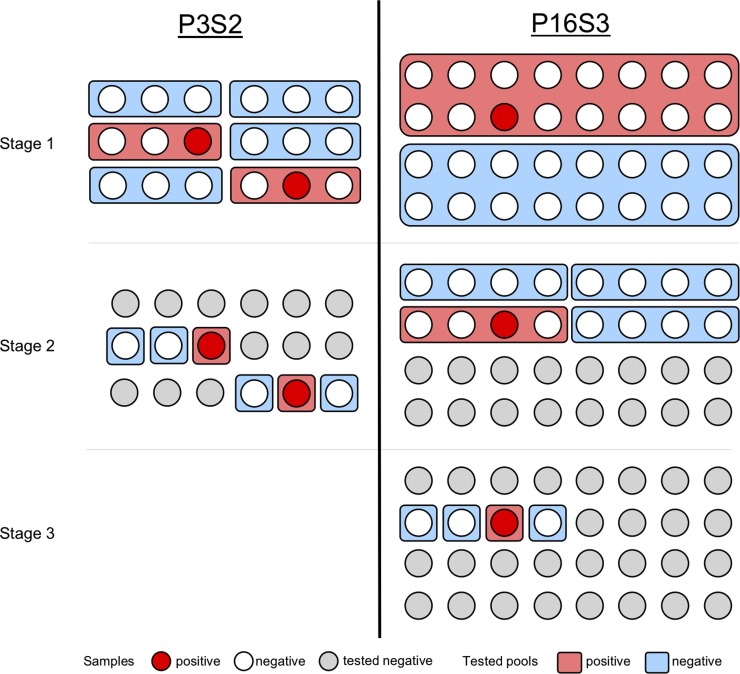
Objective: Herein, we developed and evaluated multi-stage group testing schemes that test samples in groups of various pool sizes in multiple stages. Through this approach, groups of negative samples can be eliminated with a single test, avoiding the need for individual testing and achieving considerable savings of resources.

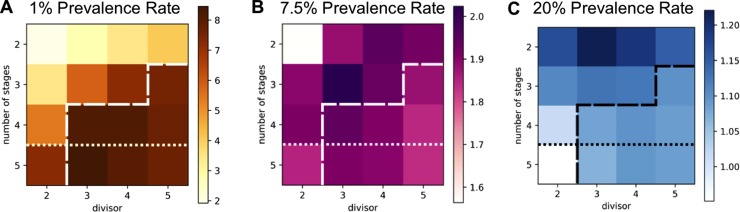
Study design: We designed and parameterized various multi-stage testing schemes and compared their efficiency at different prevalence rates using computer simulations.

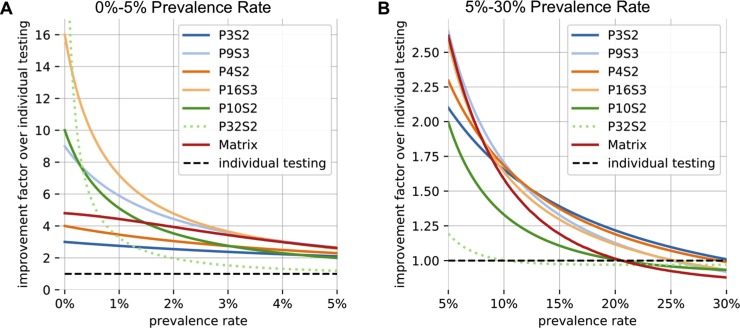
Results: We found that three-stage testing schemes with pool sizes of maximum 16 samples can test up to three and seven times as many individuals with the same number of test kits for prevalence rates of around 5% and 1%, respectively. We propose an adaptive approach, where the optimal testing scheme is selected based on the expected prevalence rate.

Conclusion: These group testing schemes could lead to a major reduction in the number of testing kits required and help improve large-scale population testing in general and in the context of the current COVID-19 pandemic.

Keywords: Group testing; Mass population tests; Testing.


Figures

Fig. 1
Fig. 1
Schematic visualization of different group testing approaches. Scheme P3S2 (left) is applied to 18 samples (circles) with 16 negative (white) and 2 positive (red) samples. The spatial arrangement of the tests is irrelevant. Stage 1: 6 groups of 3 samples each are combined into pools (rectangles) and tested (blue for negative, red for positive). Stage 2: all samples belonging to a negative pool are considered negative and not further tested (grey). All samples from positive pools are tested individually. In total, 18 samples were tested with 12 tests (1.5 samples per test). With lower prevalence rates, P3S2 can, on average, test up to 3 samples with 1 test. Scheme P16S3 (right) is applied to 32 samples, one of which is positive. Stage 1: 2 groups of 16 samples are pooled and tested. Stage 2: All samples in the negative group must be negative and are hence not tested further. Samples in the positive group are pooled into 4 subgroups of 4 samples and each pool is tested. Stage 3: The remaining 4 samples in the one positive pool are tested individually. In total, 32 samples were tested with 10 tests (3.2 samples per test). With lower prevalence rates, P16S3 can, on average, test up to 16 samples with 1 test.
Fig. 2
Fig. 2
Performance of various multi-stage schemes under prevalence rates of 1%, 7.5% and 20%. Each square represents a multi-stage scheme PNSk with pool size N=xk-1, divisor x (x-axis) and k stages (y-axis). Color intensity represents the improvement factor, i.e. the average number of subjects tested with a single test (darker is higher). Dashed lines indicate the cut-off with respect to the maximal initial pool size of 16. Dotted lines indicate the cut-off with respect to the maximal number of stages of 4. A: For 1% prevalence rate, among all schemes, P81S5 performs best (improvement factor 8.4). Among schemes with a pool size limited by 16, P16S5 performs best (improvement factor 7.3). Finally, among schemes which are additionally limited to less than 5 stages, P16S3 performs best (improvement factor 7.1) testing 7.1 subjects with just one test, while still being practical. B: For 7.5 % prevalence rate, P9S3 performs best (improvement factor 2). C: For a 20 % prevalence rate, it is preferable to use a low number of stages. P3S3 performs best (improvement factor 1.22).
Fig. 3
Fig. 3
Improvement factors of different schemes for prevalence rates below 30%. A: Improvement factors of the different schemes for prevalence rates below 5%. For prevalence rates below 3.5%, scheme P16S3 is favorable, leading to an improvement factor of between 3 to 16-fold. Above 3.5% prevalence, scheme P9S3 becomes favorable, giving improvement factors of around 3-fold. Note that for very low prevalence rates the improvement factors of multi-level schemes converge towards the maximum pool size, making schemes such as P10S1, P16S3 and P32S2 highly efficient. P32S2 is shown with a dashed line since its large maximum pool size may affect the reliability of the tests. For prevalence rates < 0.5% it rapidly converges towards an improvement factor of 32-fold. B: Improvement factors of the different schemes for prevalence rates between 5-30%. The data shows that for prevalence rates below 12% scheme P9S3 gives the largest improvement rate, whereas above 12% scheme P3S2 becomes favorable. For prevalence rates of 30% and above all schemes considered here do not offer an advantage over individual testing. Schemes with a large maximum pool size (P10S2, P32S2, Matrix) offer lower improvement rates and are hence unfavorable in this regime.

References

    1. https://www.worldometers.info/coronavirus/ (Last access: 10-14-2020).
    1. Dorfman R. The detection of defective members of large populations. Ann. Math. Stat. 1943;14(436–411)
    1. Sherlock M., Zetola N.M., Klausner J.D. Routine detection of acute HIV infection through RNA pooling: survey of current practice in the United States. Sex. Transm. Dis. 2007;34(May (5)):314–316. doi: 10.1097/01.olq.0000263262.00273.9c. PMID: 17483725. - DOI - PubMed
    1. Black M.S., Bilder C.R., Tebbs J.M. Optimal retesting configurations for hierarchical group testing. J. R. Stat. Soc. Ser. C Appl. Stat. 2015;64(August (4)):693–710. - PMC - PubMed
    1. Yelin I., Aharony N., Shaer-Tamar E., Argoetti A., Messer E., Berenbaum D., Shafran E., Kuzli A., Gandali N., Hashimshony T., Mandel-Gutfreund Y., Halberthal M., Geffen Y., Szwarcwort-Cohen M., Kishony R. Evaluation of COVID-19 RT-qPCR test in multi-sample pools. medRxiv. 2020 doi: 10.1101/2020.03.26.20039438. 03.26.20039438. - DOI - PMC - PubMed

Publication types