

doi: 10.1093/neuros/nyaa212.
Letter: The Impact of the Coronavirus (COVID-19) Pandemic on Neurosurgeons Worldwide
Affiliations
- PMID: 32388551
- PMCID: PMC7239143
- DOI: 10.1093/neuros/nyaa212
Item in Clipboard
Letter: The Impact of the Coronavirus (COVID-19) Pandemic on Neurosurgeons Worldwide
Neurosurgery.
.
No abstract available
Figures

Demographics. A, A bar chart graph showing the participants’ distribution according to the region. B, A bar chart graph showing the participants’ distribution according to the COVID-19 country's case load. C, A bar chart graph showing the participants’ distribution according to the practice setting.

A bar chart graph showing the distribution according to the hospital preparedness.
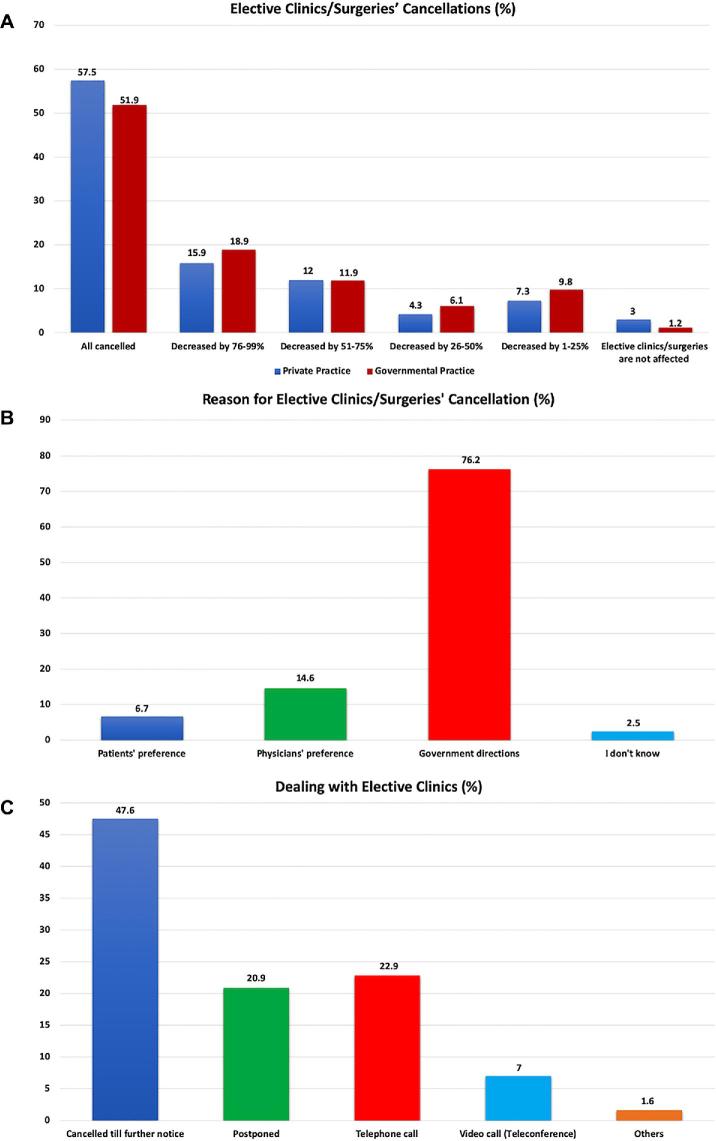
Elective clinic/surgery cancellations. A, A bar chart graph comparing the distribution according to the percentage of elective clinic/surgery cancellations in the private and governmental sectors. B, A bar chart graph showing the distribution according to the main reason of elective clinic/surgery cancellations. C, A bar chart graph showing the distribution according to how they managed the elective clinics.

A bar chart graph showing the distribution of utilization of PPE.

A bar chart graph showing the distribution according to the change in the workload.

A bar chart graph showing the distribution according to presence of financial burden.

A bar chart graph comparing the distribution according to the changes in the scientific/educational activities and research activities.
Comment in
- doi: 10.1093/neuros/nyaa178
- doi: 10.1093/neuros/nyaa210
- doi: 10.1093/neuros/nyaa213
- doi: 10.1093/neuros/nyaa214
- doi: 10.1093/neuros/nyaa215
References
-
- GHS Index Report and Model GHS Index. https://www.ghsindex.org/report-model/. Accessed April 16, 2020.
-
- COVID-19 Situation Reports. https://www.who.int/emergencies/diseases/novel-coronavirus-2019/situatio.... Accessed April 17, 2020.
-
- Rapid Risk Assessment: Coronavirus Disease 2019 (COVID-19) Pandemic: Increased Transmission in the EU/EEA and the UK – Eighth Update, April 8, 2020. European Centre for Disease Prevention and Control. https://www.ecdc.europa.eu/en/publications-data/rapid-risk-assessment-co.... Accessed April 12, 2020.
-
- Community-Based Measures to Mitigate the Spread of Coronavirus Disease (COVID-19) in Canada, April 3, 2020. AEM. https://www.canada.ca/en/public-health/services/diseases/2019-novel-coro.... Accessed April 12, 2020.
LinkOut - more resources
Full Text Sources
