. 2020 May 10;82(5):58.
doi: 10.1007/s11538-020-00736-9.

Coupling the Macroscale to the Microscale in a Spatiotemporal Context to Examine Effects of Spatial Diffusion on Disease Transmission

Affiliations

Coupling the Macroscale to the Microscale in a Spatiotemporal Context to Examine Effects of Spatial Diffusion on Disease Transmission

Yanni Xiao et al. Bull Math Biol. .

Abstract

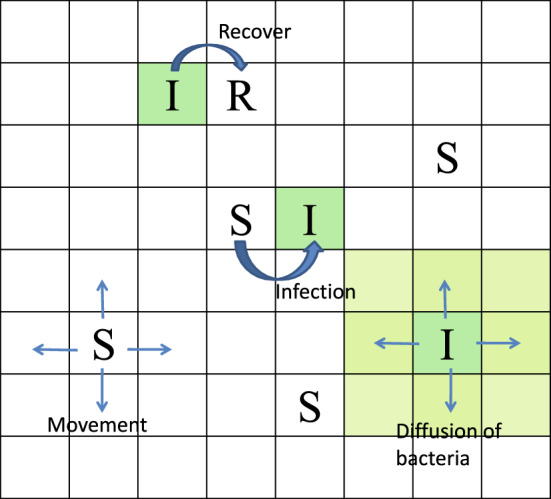
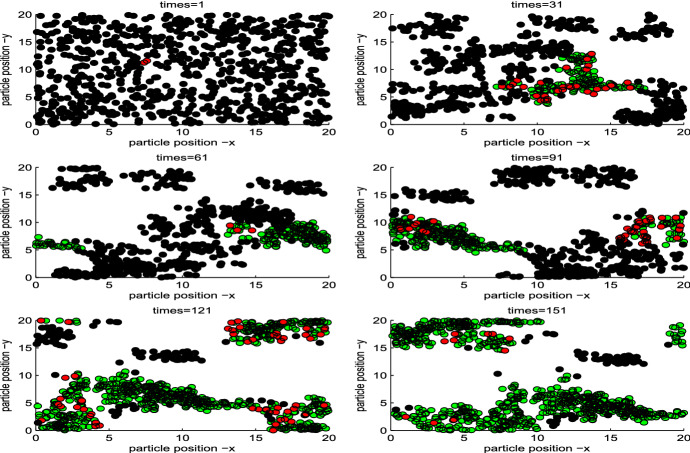
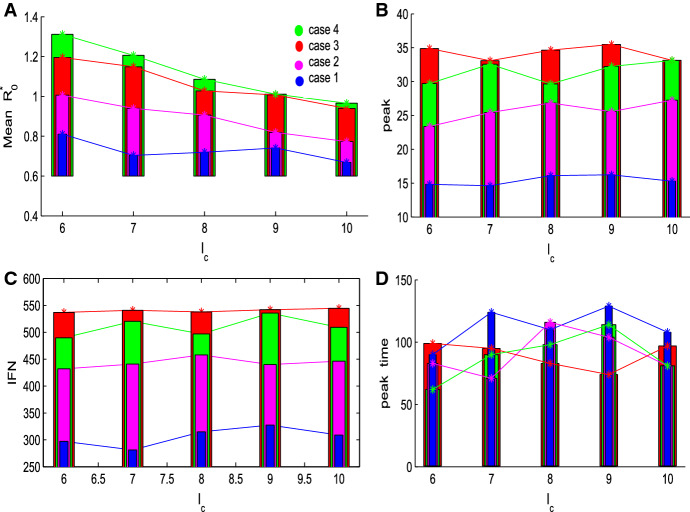
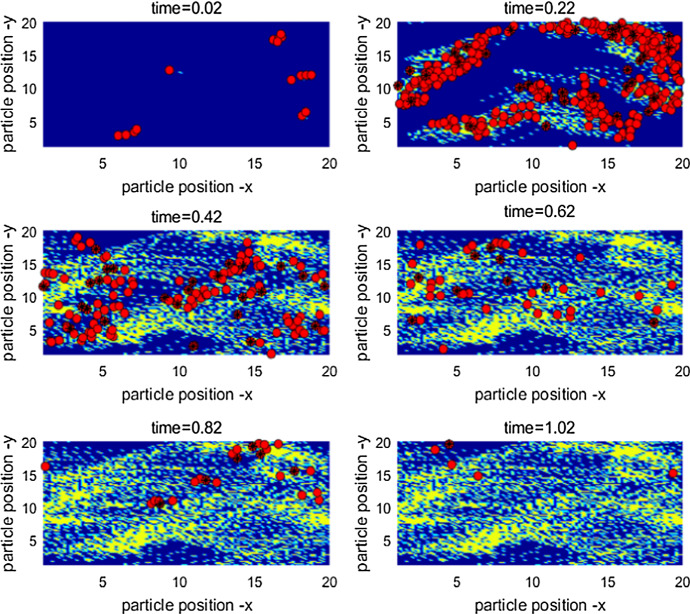
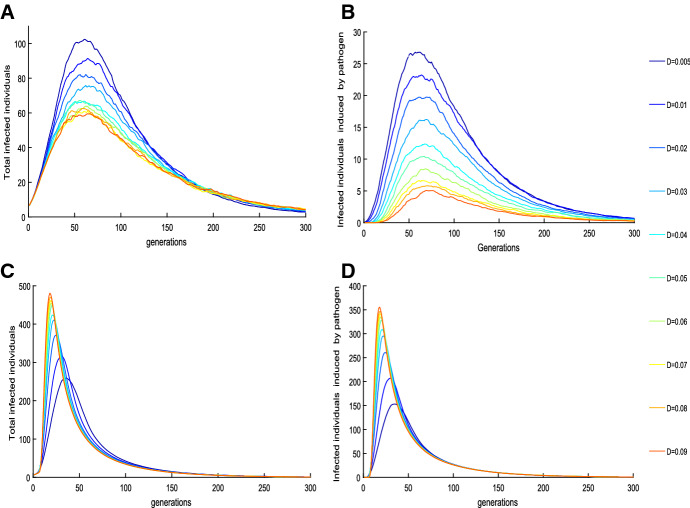
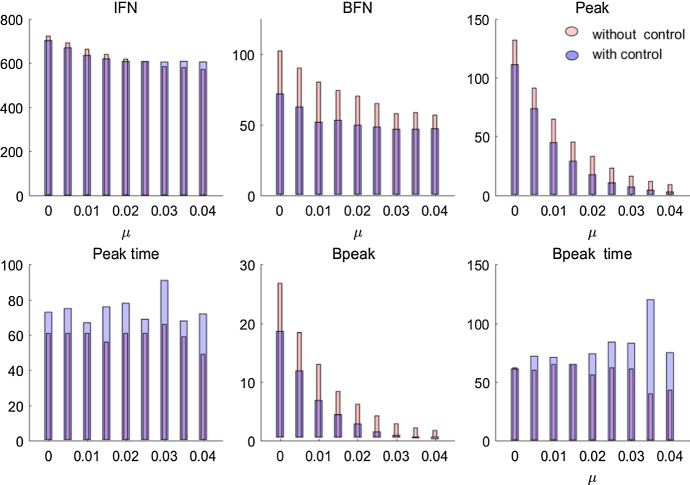
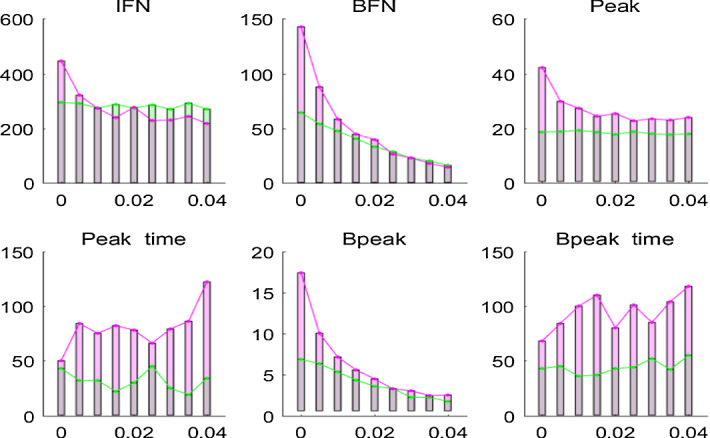
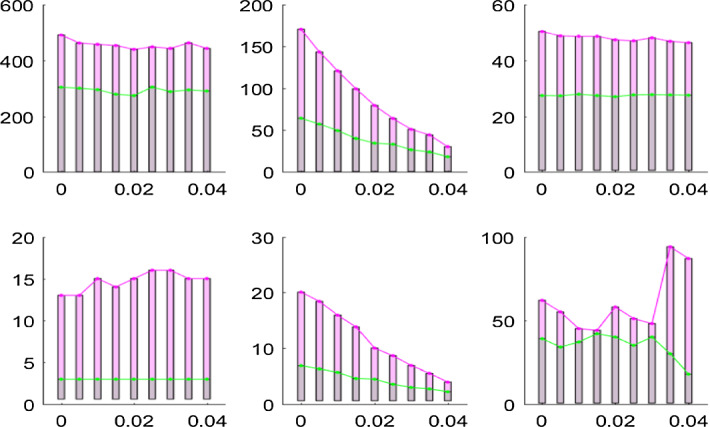
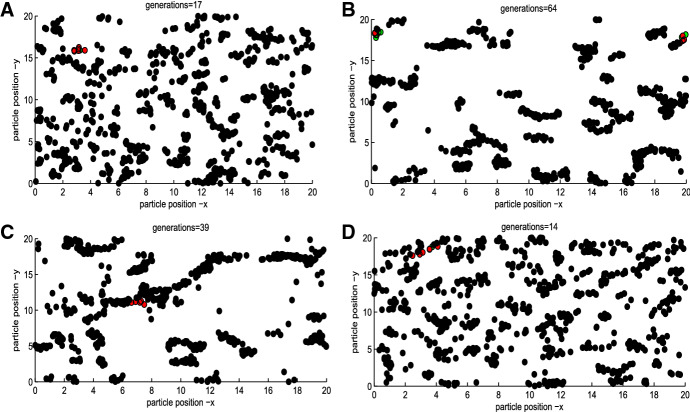
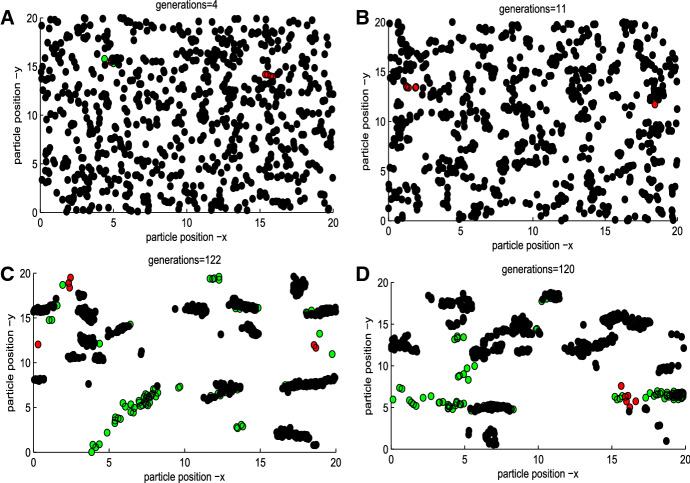
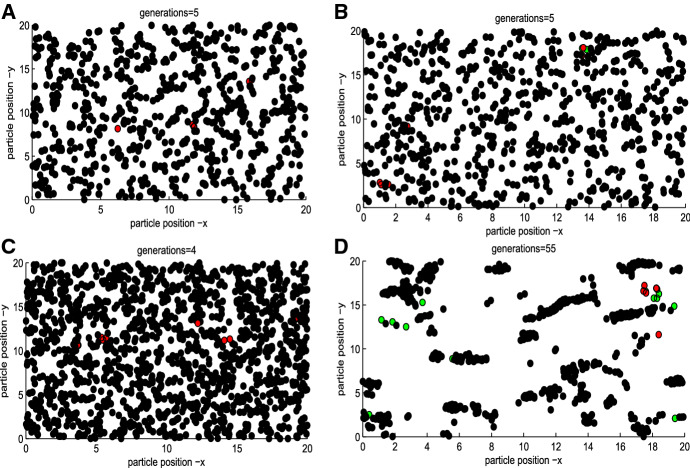
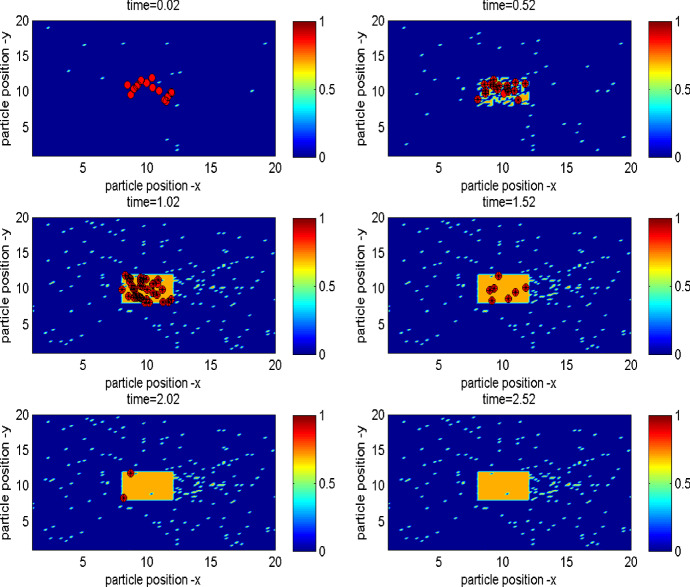
There are many challenges to coupling the macroscale to the microscale in temporal or spatial contexts. In order to examine effects of an individual movement and spatial control measures on a disease outbreak, we developed a multiscale model and extended the semi-stochastic simulation method by linking individual movements to pathogen's diffusion, linking the slow dynamics for disease transmission at the population level to the fast dynamics for pathogen shedding/excretion at the individual level. Numerical simulations indicate that during a disease outbreak individuals with the same infection status show the property of clustering and, in particular, individuals' rapid movements lead to an increase in the average reproduction number [Formula: see text], the final size and the peak value of the outbreak. It is interesting that a high level of aggregation the individuals' movement results in low new infections and a small final size of the infected population. Further, we obtained that either high diffusion rate of the pathogen or frequent environmental clearance lead to a decline in the total number of infected individuals, indicating the need for control measures such as improving air circulation or environmental hygiene. We found that the level of spatial heterogeneity when implementing control greatly affects the control efficacy, and in particular, an uniform isolation strategy leads to low a final size and small peak, compared with local measures, indicating that a large-scale isolation strategy with frequent clearance of the environment is beneficial for disease control.

Keywords: Multiscale model; Outbreaks; Semi-stochastic simulation; Threshold policy.


Figures

Fig. 1
Fig. 1
Structure of SIDW model for illustration of epidemic events, individuals movements and diffusion of bacteria (Color figure online)
Fig. 2
Fig. 2
Spatial distribution of susceptible (black), infected (red) and recovered (green) individuals. Based on Keeling’s idea and considering the individual movement within a certain plane, i.e., the position of any individual could be dynamic as time varies . The parameter values are as follows: the total number of N=763 with spatial grid [0,20]×[0,20], β=0.025,α=3.5,γ=0.17 and I0=1 . The initial velocity v0=0.2, the radius of nearest neighbor is r=1, the intensity of direction perturbation Δθ=0.06 with σ=0.66 (Color figure online)
Fig. 3
Fig. 3
Variation in mean R0 and disease specifics with the threshold level Ic for four different cases. The baseline parameter values in this subsection are fixed as follows: N=763 with spatial grid [0,20]×[0,20], β=0.025,α=3.5,γ=0.17, and I0=1. Δ=0.06,σ=0.66 with V0=0.005, cluster radius r=0.5 (Color figure online)
Fig. 4
Fig. 4
Illustration of the infection dynamics, spatial movement of infected persons and cumulative growth of bacteria. Red circles represent the infected individuals and red circles with denote the individuals infected by bacteria, yellow dots represent the pathogens. The six subplots reveal the spatial distribution of pathogen growing and diffusion over time (Color figure online)
Fig. 5
Fig. 5
The effect of parameter D on the number of the infected (a, b) without pathogen growing in reservoir (c, d) with pathogen growing in reservoir given in (6) with g=1,C=1. The baseline parameter values are as follows: β=0.025,γ=0.17,α=3.5, and the parameters for individual initial velocity v0=0.005,r=0.5, the shading rate of i-th infected individual is ηi=0.6 with bacteria threshold (w0=0.4). We choose the dispersal rate and cleaning rate for investigating the effects of bacteria on disease spread, where I0=5 (Color figure online)
Fig. 6
Fig. 6
Variation in disease specifics with the rate of clearance for the simulation model with and without local isolation measures over 200 simulations. IFN (BFN)—the total number of infected individuals (who are infected by bacteria), peak (Bpeak)—the maximal number of infected individuals (who are infected by bacteria), peak time (Bpeak time)—the time that the maximal number of infected individuals (who are infected by bacteria) is reached (Color figure online)
Fig. 7
Fig. 7
Variation in disease specifics with the rate of clearance for Case u1 (green) and Case u2 (red) under uniform isolation strategy. Diffusion rate of bacteria is D=0.005 (Color figure online)
Fig. 8
Fig. 8
Variation in disease specifics with the rate of clearance for Case u3 (green) and Case u4 (red) under a uniform isolation strategy. Diffusion rate of bacteria is D=0.005 (Color figure online)
Fig. 9
Fig. 9
Variation in disease specifics with the rate of clearance for the local isolation strategy (blue), uniform isolation strategy (Case u1 (green), Case u3) (red). Diffusion rate of bacteria is D=0.005 (Color figure online)
Fig. 10
Fig. 10
Spatial distribution of infected individuals with I0=1,Ic=6 (Color figure online)
Fig. 11
Fig. 11
Spatial distribution of infected individuals with I0=2,Ic=6 (Color figure online)
Fig. 12
Fig. 12
Spatial distribution of infected individuals with I0=3,Ic=6 (Color figure online)
Fig. 13
Fig. 13
Illustration of the infection dynamics, movement and uniform isolation strategy. Black and green dots represent susceptible and recovered individuals, respectively, red dots represent individuals infected either by infected individuals or by the pathogen, purple dots denote individuals infected by bacteria, light-blue dots indicate individuals recovering from pathogen infection (Color figure online)

Similar articles

Cited by

References

    1. Allen LJS, Bolker BM, Lou Y, Nevai AL. Asymptotic profiles of the steady states for an SIS epidemic reaction–diffusion model. Discrete Contin Dyn Syst Ser A. 2008;21(1):1–20.
    1. Anderson RM, May RM. Infectious diseases of humans: dynamics and control. Oxford: Oxford University Press; 1991.
    1. Bauer AL, Beauchemin CA, Perelson AS. Agent-based modeling of host-pathogen systems: the successes and challenges. Inf Sci. 2009;179:1379–1389. - PMC - PubMed
    1. Codeco CT. Endemic and epidemic dynamics of cholera: the role of the aquatic reservoir. BMC Infect Dis. 2001;1(1):1. - PMC - PubMed
    1. Dorratoltaj N, Nikin-Beers R, Ciupe SM, et al. Multi-scale immunoepidemiological modeling of within-host and between-host HIV dynamics: systematic review of mathematical models. Peer J. 2017 doi: 10.7717/peerj.3877. - DOI - PMC - PubMed

Publication types

MeSH terms

LinkOut - more resources