. 2020 Jun 1;318(6):G1070-G1087.
doi: 10.1152/ajpgi.00079.2020. Epub 2020 May 11.

Lipopolysaccharides transport during fat absorption in rodent small intestine

Affiliations

Lipopolysaccharides transport during fat absorption in rodent small intestine

Yasutada Akiba et al. Am J Physiol Gastrointest Liver Physiol. .

Abstract

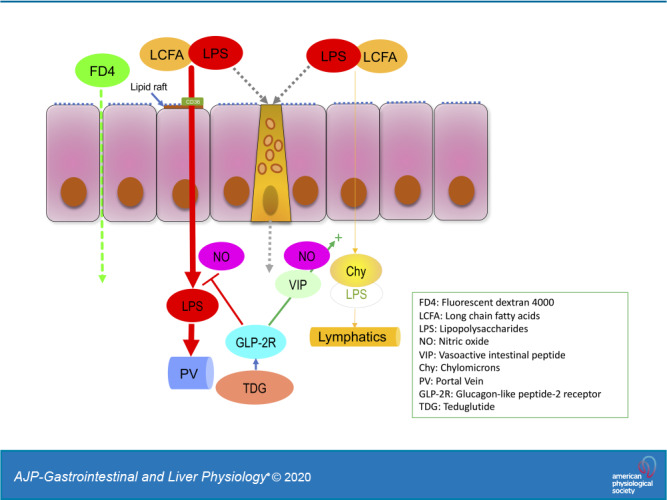
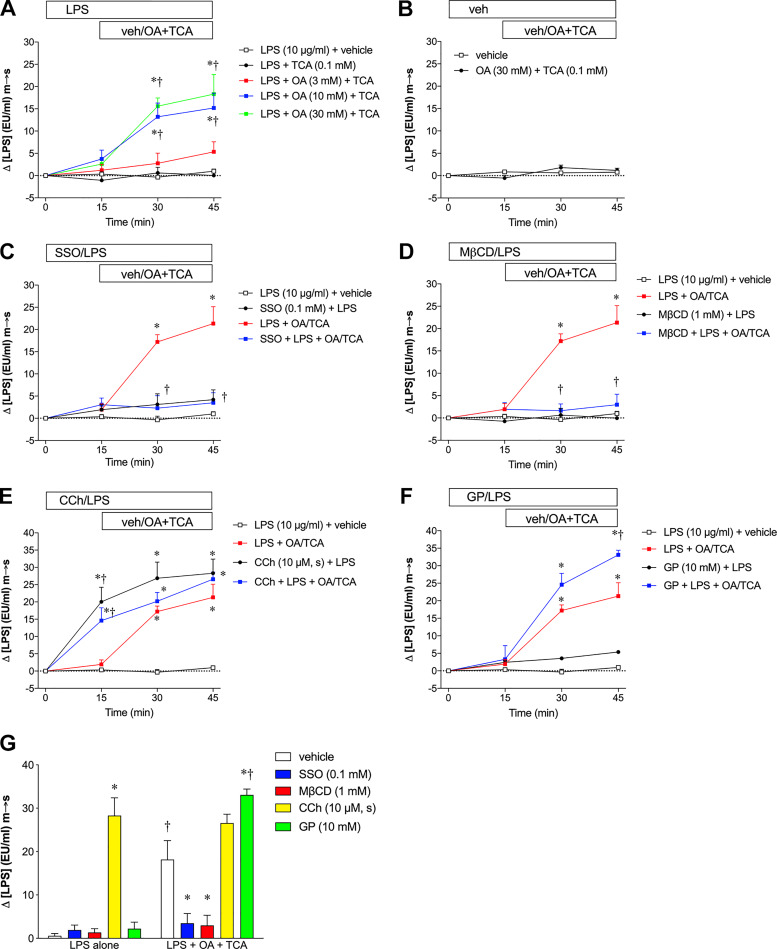
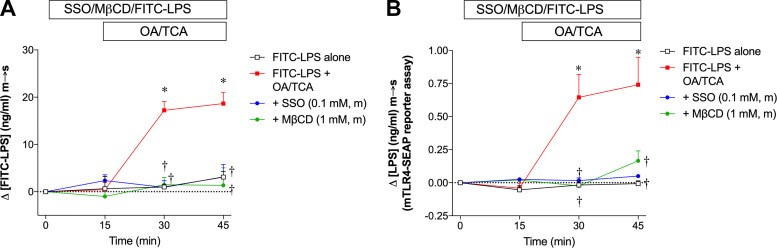
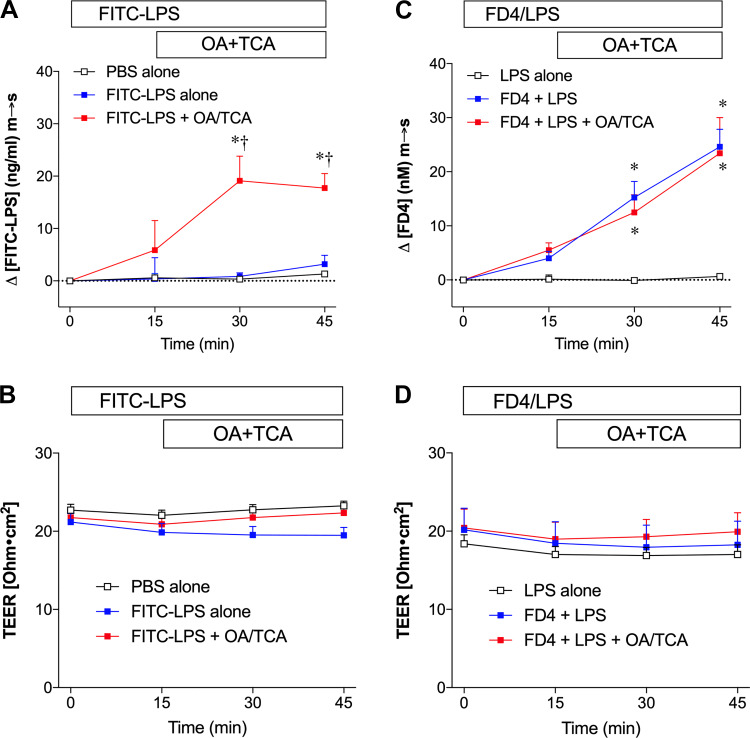
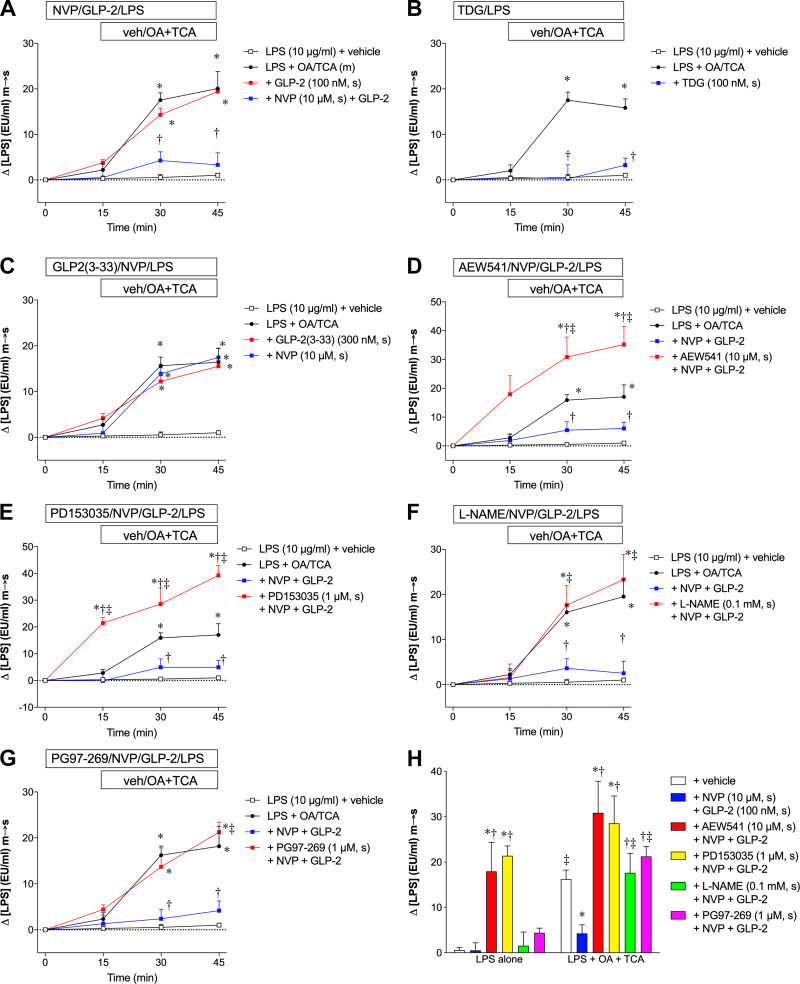
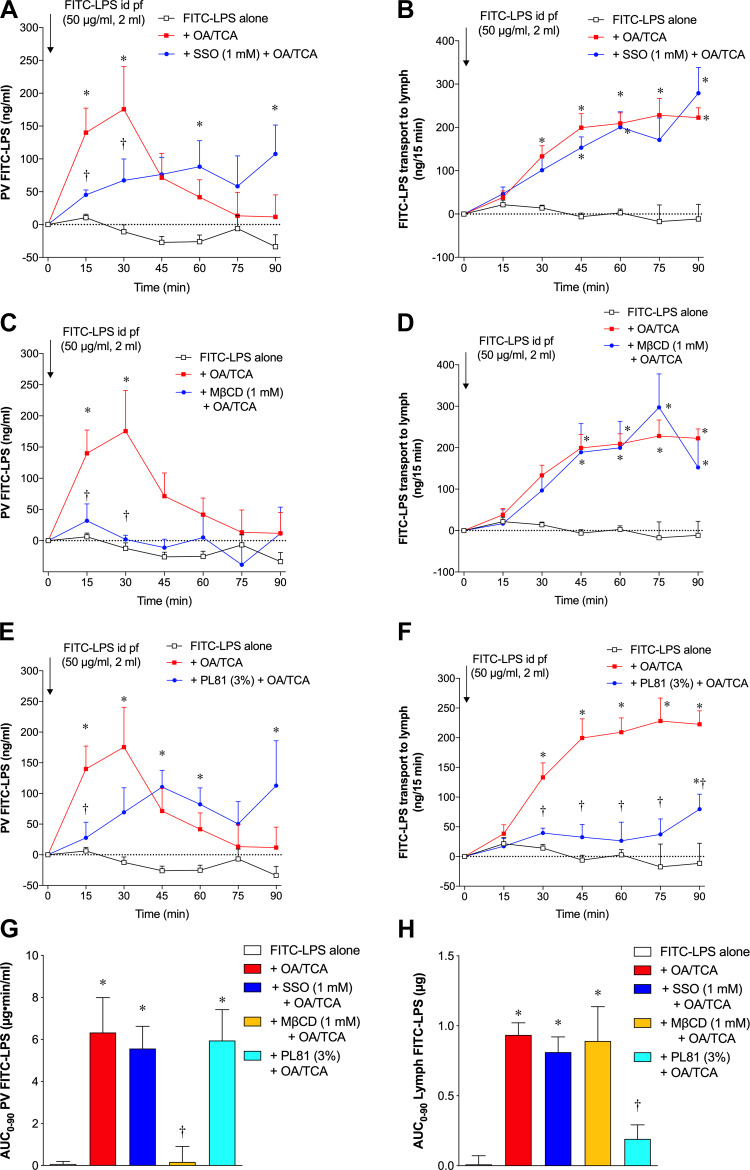
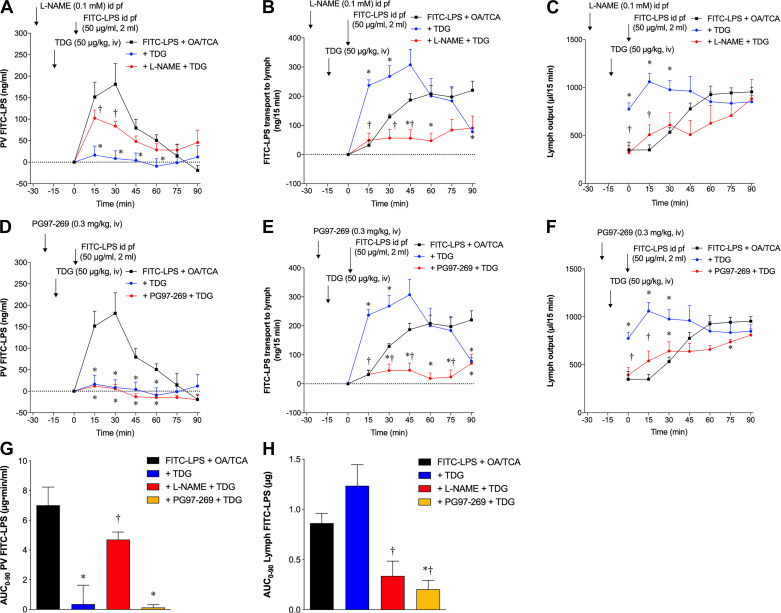
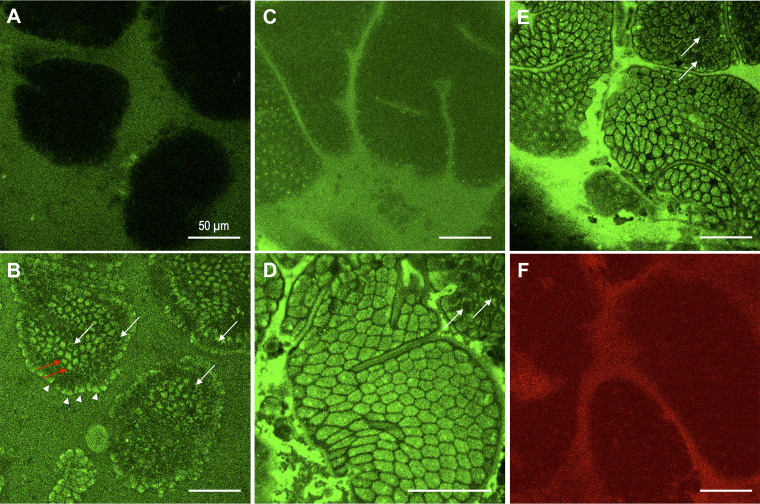
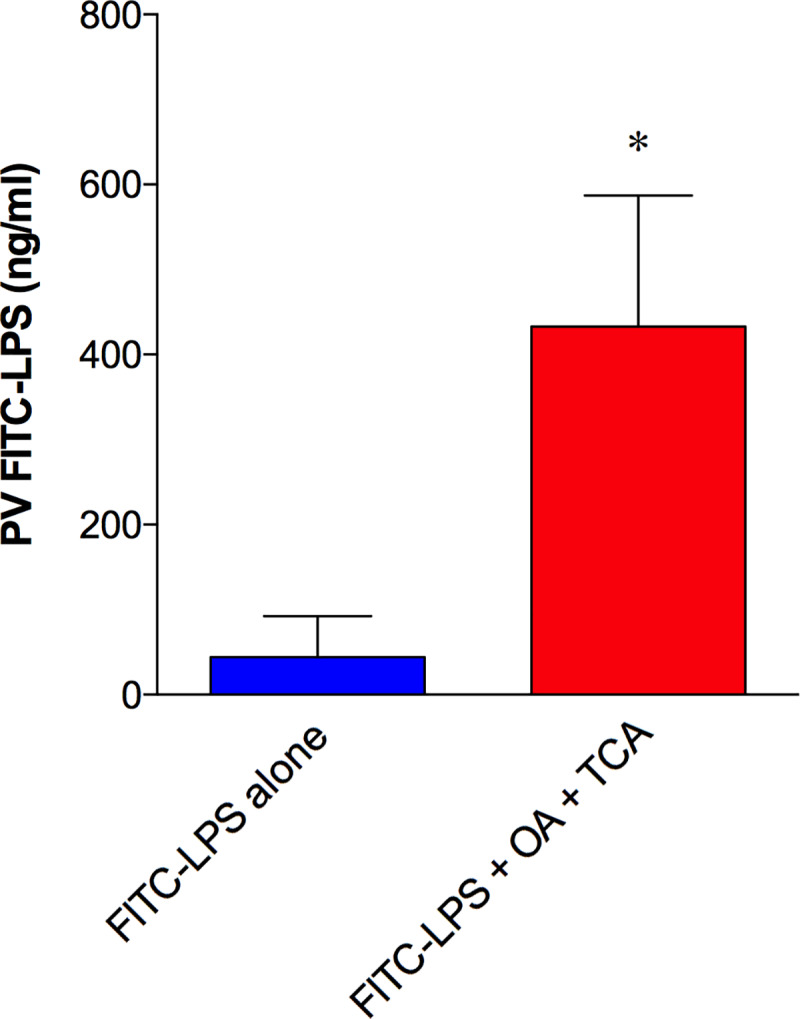
Lipopolysaccharides (LPS) are potent pro-inflammatory molecules that enter the systemic circulation from the intestinal lumen by uncertain mechanisms. We investigated these mechanisms and the effect of exogenous glucagon-like peptide-2 (GLP-2) on LPS transport in the rodent small intestine. Transmucosal LPS transport was measured in Ussing-chambered rat jejunal mucosa. In anesthetized rats, the appearance of fluorescein isothiocyanate (FITC)-LPS into the portal vein (PV) and the mesenteric lymph was simultaneously monitored after intraduodenal perfusion of FITC-LPS with oleic acid and taurocholate (OA/TCA). In vitro, luminally applied LPS rapidly appeared in the serosal solution only with luminal OA/TCA present, inhibited by the lipid raft inhibitor methyl-β-cyclodextrin (MβCD) and the CD36 inhibitor sulfosuccinimidyl oleate (SSO), or by serosal GLP-2. In vivo, perfusion of FITC-LPS with OA/TCA rapidly increased FITC-LPS appearance into the PV, followed by a gradual increase of FITC-LPS into the lymph. Rapid PV transport was inhibited by the addition of MβCD or by SSO, whereas transport into the lymph was inhibited by chylomicron synthesis inhibition. Intraveous injection of the stable GLP-2 analog teduglutide acutely inhibited FITC-LPS transport into the PV, yet accelerated FITC-LPS transport into the lymph via Nω-nitro-l-arginine methyl ester (l-NAME)- and PG97-269-sensitive mechanisms. In vivo confocal microscopy in mouse jejunum confirmed intracellular FITC-LPS uptake with no evidence of paracellular localization. This is the first direct demonstration in vivo that luminal LPS may cross the small intestinal barrier physiologically during fat absorption via lipid raft- and CD36-mediated mechanisms, followed by predominant transport into the PV, and that teduglutide inhibits LPS uptake into the PV in vivo.NEW & NOTEWORTHY We report direct in vivo confirmation of transcellular lipopolysaccharides (LPS) uptake from the intestine into the portal vein (PV) involving CD36 and lipid rafts, with minor uptake via the canonical chylomicron pathway. The gut hormone glucagon-like peptide-2 (GLP-2) inhibited uptake into the PV. These data suggest that the bulk of LPS absorption is via the PV to the liver, helping clarify the mechanism of LPS transport into the PV as part of the "gut-liver" axis. These data do not support the paracellular transport of LPS, which has been implicated in the pathogenesis of the "leaky gut" syndrome.

Keywords: CD36; GLP-2; LCFA absorption; LPS transport; lipid raft.


Conflict of interest statement

No conflicts of interest, financial or otherwise, are declared by the authors.

Figures

None
Graphical abstract
Fig. 1.
Fig. 1.
Lipopolysaccharides (LPS) transport in rat jejunal mucosa in the Ussing chamber. Muscle-stripped mucosa-submucosa preparation of rat jejunal mucosa was exposed to mucosal (m) LPS (10 µg/ml) at time (t) = 0 min, followed by the mucosal addition of vehicle (phosphate-buffered saline pH 7.4) or oleic acid (OA) and taurocholic acid (TCA) at t = 15 min. Serosal (s) LPS concentrations ([LPS]) were measured using the limulus amebocyte lysate test with colorimetric detection. Background [LPS] at t = 0 was subtracted from the value at each time point, which is expressed as Δ[LPS] (EU/ml) mucosal-to-serosal (m-to-s) (means ± SE, n = 6 rats). All data were analyzed by two-way ANOVA, followed by Tukey’s multiple comparisons test. A: mucosa was exposed to mucosal LPS alone for 15 min, followed by mucosal addition of vehicle (veh), TCA (0.1 mM) alone, or OA (3–30 mM) with TCA. OA in the mucosal bath dose-dependently increased serosal [LPS] at t = 30 and 45 min, whereas LPS alone or LPS + TCA had no effect on serosal [LPS]. *P < 0.05 vs. LPS + vehicle group, †P < 0.05 vs. LPS + TCA group. B: vehicle was added into the mucosal bath without LPS, followed by addition of vehicle or OA/TCA. C: sulfosuccinimidyl oleate (SSO, 0.1 mM) was added into the mucosal bath 10 min before LPS application, followed by addition of vehicle or OA (30 mM)/TCA (0.1 mM). SSO inhibited OA/TCA-induced [LPS] increase, whereas SSO with LPS alone had no effect on serosal [LPS]. *P < 0.05 vs. LPS + vehicle group, †P < 0.05 vs. LPS + OA/TCA group. D: methyl-β-cyclodextrin (MβCD, 1 mM) was added into the mucosal bath 10 min before LPS application. MβCD abolished OA/TCA-induced [LPS] increase, whereas MβCD with LPS alone had no effect on serosal [LPS]. *P < 0.05 vs. LPS + vehicle group, †P < 0.05 vs. LPS + OA/TCA group. E: carbachol (CCh, 10 µM) was added into the serosal (s) bath 10 min before LPS application. CCh increased serosal [LPS], regardless the presence of mucosal OA/TCA. *P < 0.05 vs. LPS + vehicle group, †P < 0.05 vs. LPS + OA/TCA group. F: glycerol phosphate (GP, 10 mM) was added into the mucosal bath 10 min before LPS application. GP enhanced OA/TCA-induced [LPS] increase at t = 45 min, whereas GP with LPS alone had no effect on serosal [LPS]. *P < 0.05 vs. LPS + vehicle group, †P < 0.05 vs. LPS + OA/TCA group. G: effects of SSO, MβCD, CCh and GP on serosal [LPS] at t = 15 min (LPS alone exposure) and at t = 45 min (LPS+OA+TCA exposure). *P < 0.05 vs. vehicle group, †P < 0.05 vs. the corresponding LPS alone group.
Fig. 2.
Fig. 2.
Comparison of lipopolysaccharide (LPS) measurements using fluorescein isothiocyanate (FITC)-LPS and Toll-like receptor 4 (TLR4) reporter cell assay. Rat jejunal mucosae were exposed to mucosal FITC-LPS (10 µg/ml) with or without mucosal (m) sulfosuccinimidyl oleate (SSO, 0.1 mM) or methyl-β-cyclodextrin (MβCD, 1 mM) 10 min before FITC-LPS application, followed by mucosal addition of vehicle or oleic acid (OA, 30 mM)/taurocholic acid (TCA, 0.1 mM) at time (t) = 15 min. Serosal [LPS] at each time point was detected by FITC fluorescence intensity, followed by subtraction of background [LPS] at t = 0 (A) or mTLR4-SEAP reporter cell assay (see materials and methods for detail) (B), expressed as Δ[FITC-LPS] (ng/ml) mucosal-to-serosal (m-to-s), or Δ[LPS] (ng/ml) m-to-s, respectively (means ± SE, n = 6 rats). All data were analyzed by two-way ANOVA, followed by Tukey’s multiple comparisons test. *P < 0.05 vs. FITC-LPS alone group, †P < 0.05 vs. FITC-LPS + OA/TCA group.
Fig. 3.
Fig. 3.
Epithelial permeability during lipid exposure in rat jejunal mucosa in vitro. Rat jejunal mucosa were exposed to mucosal fluorescein isothiocyanate (FITC)-lipopolysaccharide (LPS) (10 µg/ml) or FITC-dextran 4000 (FD4, 0.1 mM) with lipopolysaccharide (LPS, 10 µg/ml) at time (t) = 0 min, followed by the mucosal (m) addition of vehicle (phosphate-buffered saline pH 7.4; PBS), or oleic acid (OA, 30 mM) and taurocholate (TCA, 0.1 mM) at t = 15 min. FITC-LPS transport [mucosal-to-serosal (m-to-s)] (A) or FD4 transport (m-to-s) (C) is expressed as Δ[FITC-LPS] (ng/ml) m-to-s, or Δ[FD4] (nM) m-to-s, respectively (means ± SE, n = 4 rats). Transepithelial electrical resistance (TEER) (Ω·cm2), recorded throughout the experiments is plotted every 15 min (B and D) for the corresponding experiments (A and C). All data were analyzed by two-way ANOVA, followed by Tukey’s multiple comparisons test. A and B: luminal PBS alone or FITC-LPS alone had no effect on serosal [FITC-LPS], whereas addition of OA/TCA in the mucosal bath increased serosal [FITC-LPS] (A) with no change in TEER (B). *P < 0.05 vs. PBS alone group, †P < 0.05 vs. FITC-LPS alone group. C and D: luminal LPS alone had no effect on serosal fluorescence change. Luminal addition of FD4, with or without further addition of OA/TCA in the mucosal bath, all increased serosal [FD4] (C) with any change in TEER (D). *P < 0.05 vs. LPS alone group.
Fig. 4.
Fig. 4.
Effect of glucagon-like peptide-2 (GLP-2) on lipopolysaccharide (LPS) transport during lipid exposure in rat jejunal mucosa in vitro. Rat jejunal mucosae were exposed to mucosal LPS (10 µg/ml) at time (t) = 0 min, followed by the mucosal addition of vehicle (veh) or oleic acid (OA) and taurocholate (TCA) at t = 15 min. LPS transport [mucosal-to-serosal (m-to-s)] is expressed as Δ[LPS] (EU/ml) m-to-s (means ± SE, n = 6 rats). Each inhibitor (DG) was added in the serosal solution 5 min before addition of GLP-2 and NVP. All data were analyzed by two-way ANOVA, followed by Tukey’s multiple comparisons test. A: rat GLP-2 (100 nM) with or without NVP-728 (NVP, 10 µM) was added into the serosal (s) bath 10 min before LPS application, followed by addition of vehicle or OA (30 mM)/TCA (0.1 mM) into the mucosal (m) bath. GLP-2 with or without NVP had no effect on serosal [LPS] at t = 15 min. GLP-2 with NVP inhibited OA/TCA-induced [LPS] increase, whereas GLP-2 alone had no effect on OA/TCA-induced [LPS] increase. *P < 0.05 vs. LPS + vehicle group, †P < 0.05 vs. LPS + OA/TCA group. B: teduglutide (TDG, 100 nM) was added into the serosal (s) bath 10 min before LPS application, followed by addition of vehicle or OA/TCA. TDG inhibited OA/TCA-induced [LPS] increase. *P < 0.05 vs. LPS + vehicle group, †P < 0.05 vs. LPS + OA/TCA group. C: GLP-2(3–33) (300 nM) or NVP (10 µM) was added into the serosal (s) bath 10 min before LPS application, followed by addition of vehicle or OA/TCA. GLP-2(3–33) or NVP had no effect on OA/TCA-induced [LPS] increase. *P < 0.05 vs. LPS + vehicle group. D: pretreatment with NVP-AEW-541 (AEW541, 10 µM, s) enhanced the OA/TCA-induced [LPS] increase. *P < 0.05 vs. LPS + vehicle group, †P < 0.05 vs. LPS + OA/TCA group, ‡P < 0.05 vs. LPS + OA/TCA + NVP + GLP-2 group. E: pretreatment with PD153035 (1 µM, s) increased serosal [LPS] at t = 15 min and further augmented OA/TCA-induced [LPS] increase. *P < 0.05 vs. LPS + vehicle group, †P < 0.05 vs. LPS + OA/TCA group, ‡P < 0.05 vs. LPS + OA/TCA + NVP + GLP-2 group. F: pretreatment with Nω-nitro-l-arginine methyl ester (l-NAME, 0.1 mM, s) reversed the inhibitory effect of GLP-2/NVP on OA/TCA-induced [LPS] increase. *P < 0.05 vs. LPS + vehicle group, †P < 0.05 vs. LPS + OA/TCA group, ‡P < 0.05 vs. LPS + OA/TCA + NVP + GLP-2 group. G: pretreatment with PG97-269 (1 µM, s) reversed the inhibitory effect of GLP-2/NVP on OA/TCA-induced [LPS] increase. *P < 0.05 vs. LPS + vehicle group, †P < 0.05 vs. LPS + OA/TCA group, ‡P < 0.05 vs. LPS + OA/TCA + NVP + GLP-2 group. H: effects of NVP + GLP-2 with or without AEW541, PD153035, l-NAME, and PG97-269 on serosal [LPS] at t = 15 min (LPS alone exposure) and at t = 45 min (LPS+OA+TC exposure). *P < 0.05 vs. vehicle group, †P < 0.05 vs. NVP + GLP-2 group, ‡P < 0.05 vs. the corresponding LPS alone group.
Fig. 5.
Fig. 5.
Fluorescein isothiocyanate (FITC)-lipopolysaccharide (LPS) transport during lipid exposure in rat small intestine in vivo. FITC-LPS (50 µg/ml) in 2 ml phosphate-buffered saline (PBS) with or without oleic acid (OA, 30 mM) plus taurocholate (TCA, 10 mM) was administered by intraduodenal (id) bolus perfusion (pf) at t = 0 min, followed by 2 ml PBS perfusion every 30 min. Portal venous (PV) blood and mesenteric lymph were collected every 15 min. Fluorescence intensity was measured in PV plasma and lymph with measurement of lymph output to calculate FITC-LPS content in the samples after subtraction of background fluorescence intensity in the samples at time (t) = 0, which is expressed as PV FITC-LPS (ng/ml) and FITC-LPS transport into lymph (ng/15 min) (means ± SE, n = 6 rats). Each inhibitor was perfused in 2-ml PBS 30 min before FITC-LPS perfusion, followed by coperfusion with FITC-LPS + OA/TCA at t = 0 min. Data were analyzed by two-way ANOVA (AF) or one-way ANOVA (G and H), followed by Tukey’s multiple comparisons test. A and B: intraduodenal perfusion of FITC-LPS alone had no effect on FITC-LPS appearance into the PV (A) and into the lymph (B). Addition of OA + TCA with FITC-LPS rapidly increased PV FITC-LPS content at t = 15 and 30 min, followed by a decline to the basal value (A), whereas FITC-LPS transport to lymph gradually increased, reaching a plateau at t = 60 min. Pretreatment and co-perfusion of SSO (1 mM) reduced OA/TCA-induced FITC-LPS transport into the PV (A), but had no effect on FITC-LPS transport into the lymph (B). *P < 0.05 vs. FITC-LPS alone group, †P < 0.05 vs. FITC-LPS + OA/TCA group. C and D: pretreatment and coperfusion of MβCD (1 mM) abolished OA/TCA-induced FITC-LPS transport into the PV (C), but had no effect on FITC-LPS transport into the lymph (D). *P < 0.05 vs. FITC-LPS alone group, †P < 0.05 vs. FITC-LPS + OA/TCA group. E and F: pretreatment and coperfusion of Pluronic-81 (PL81, 3%) delayed OA/TCA-induced FITC-LPS transport increase into the PV (E), and inhibited FITC-LPS transport into the lymph (F). *P < 0.05 vs. FITC-LPS alone group, †P < 0.05 vs. FITC-LPS + OA/TCA group. G and H: area under the curve for FITC-LPS uptake for 0–90 min (AUC0–90) into the PV (G) and lymph (H) was calculated from A, C, and E and from B, D, and F, respectively, by the trapezoidal rule. Compared with FITC-LPS alone group, OA/TCA increased AUC0–90 of PV and lymph. MβCD treatment abolished AUC0–90 of PV with no effect on AUC0–90 of lymph, whereas PL81 treatment reduced AUC0–90 of lymph with no effect on AUC0–90 of PV. SSO treatment had no effect on AUC0–90 of PV and lymph. *P < 0.05 vs. FITC-LPS alone group, †P < 0.05 vs. FITC-LPS + OA/TCA group.
Fig. 6.
Fig. 6.
Effect of teduglutide (TDG on fluorescein isothiocyanate (FITC)-lipopolysaccharide (LPS) transport during lipid exposure in rat small intestine in vivo. TDG (50 µg/kg) was injected intravenously15 min before intraduodenal (id) bolus perfusion (pf) of FITC-LPS (50 µg/ml) in 2-ml PBS with oleic acid (OA, 30 mM) plus taurocholate (TCA, 10 mM). FITC-LPS appearance in the portal venous (PV) and the lymph, and lymph output are expressed as PV FITC-LPS (ng/ml), FITC-LPS transport into lymph (ng/15 min) and lymph output (µl/15 min) (means ± SE, n = 6 rats), respectively. Data were analyzed by two-way ANOVA (AF) or one-way ANOVA (G, H), followed by Tukey’s multiple comparisons test. AC: TDG intravenous injection abolished OA/TCA-induced FITC-LPS transport into the PV (A), but rapidly increased FITC-LPS transport into the lymph (B), accompanied by rapidly enhanced lymph output (C). Nω-nitro-l-arginine methyl ester (l-NAME, 0.1 mM) was perfused in 2-ml phosphate-buffered saline (PBS) at time (t) = −30 min, followed by TDG intravenous injection at t = −15 min. Pretreatment with and coperfusion of l-NAME reduced the inhibitory effect of TDG on OA/TCA-induced FITC-LPS transport into the PV (A) and into the lymph (B), with reduction of TDG-induced lymph output increase (C). *P < 0.05 vs. FITC-LPS + OA/TCA group, †P < 0.05 vs. + TDG group. DF: PG97-269 (0.3 mg/kg) was intravenously injected 5 min before TDG intravenouos injection at t = −15 min. Pretreatment of PG97-269 had no effect on the inhibitory effect of TDG on OA/TCA-induced FITC-LPS transport into the PV (D), but inhibited FITC-LPS transport into the lymph (E), with reduction of TDG-induced lymph output increase (F). *P < 0.05 vs. FITC-LPS + OA/TCA group, †P < 0.05 vs. + TDG group. G, H: AUC0–90 of FITC-LPS transport into the PV (G) and lymph (H) was calculated from A and D and from B and E, respectively, by the trapezoidal rule. Compared with FITC-LPS + OA/TCA group, TDG reduced AUC0–90 of PV, which was reversed by l-NAME treatment (G). l-NAME and PG97-269 treatment reduced AUC0–90 of lymph, whereas TDG had no significant effect on AUC0–90 of lymph (H). *P < 0.05 vs. FITC-LPS + OA/TCA group, †P < 0.05 vs. + TDG group.
Fig. 7.
Fig. 7.
Intracellular uptake of fluorescein isothiocyanate (FITC)-lipopolysaccharide (LPS) in mouse jejunal epithelium in vivo. Mouse jejunal mucosa was exposed to luminal FITC-LPS solution (50 µg/ml) alone for 15 min (C), followed by to FITC-LPS with oleic acid (OA, 30 mM) plus taurocholate (TCA, 10 mM) (A, B, D, E) under isoflurane anesthesia. Localization of FITC-LPS was imaged using single-photon or two-photon confocal microscope. No FITC signal was observed in the villi with single-photon confocal imaging (A), whereas two-photon confocal imaging detected intracellular FITC signals in the presence of OA plus TCA (B) in the apical cytosol of villous cells by horizontal scanning (arrowheads) and in the bottom of villous cells by vertical scanning (red arrows) with unstained nucleus (white arrows). Luminal FITC-LPS alone showed no obvious intracellular staining of FITC-LPS with faint staining on the apical surface of villous cells (C). Addition of OA plus TCA to FITC-LPS solution rapidly stained intracellular space of villous cells with a negative paracellular space (D). Deeper scanning revealed cytosolic staining in the bottom of villous cells with negative nuclei (white arrows in D and E). Exposure to luminal a cell-impermeant red fluorescence dye SNARF-5F with OA plus TCA failed to stain the intracellular space. Internal bar = 50 µm.
Fig. 8.
Fig. 8.
Fluorescein isothiocyanate (FITC)-lipopolysaccharide (LPS) transport during lipid exposure into the portal vein in mice. Intraduodenal perfusion of FITC-LPS with or without oleic acid (OA, 30 mM) plus taurocholate (TCA, 10 mM) was performed in anesthetized mice, followed by portal venous (PV) blood collection 15 min after perfusion. Plasma FITC-LPS levels were measured and are expressed as PV FITC-LPS (ng/ml) (means ± SE, n = 6 mice). *P < 0.05 vs. FITC-LPS alone group. Data were analyzed by the Mann-Whitney test.

References

    1. Akiba Y, Inoue T, Kaji I, Higashiyama M, Narimatsu K, Iwamoto K, Watanabe M, Guth PH, Engel E, Kuwahara A, Kaunitz JD. Short-chain fatty acid sensing in rat duodenum. J Physiol 593: 585–599, 2015. doi:10.1113/jphysiol.2014.280792. - DOI - PMC - PubMed
    1. Akiba Y, Kaunitz JD. Duodenal luminal chemosensing; acid, ATP, and nutrients. Curr Pharm Des 20: 2760–2765, 2014. doi:10.2174/13816128113199990565. - DOI - PubMed
    1. Akiba Y, Kaunitz JD. Regulation of intracellular pH and blood flow in rat duodenal epithelium in vivo. Am J Physiol Gastrointest Liver Physiol 276: G293–G302, 1999. doi:10.1152/ajpgi.1999.276.1.G293. - DOI - PubMed
    1. Akiba Y, Mizumori M, Guth PH, Engel E, Kaunitz JD. Duodenal brush border intestinal alkaline phosphatase activity affects bicarbonate secretion in rats. Am J Physiol Gastrointest Liver Physiol 293: G1223–G1233, 2007. doi:10.1152/ajpgi.00313.2007. - DOI - PubMed
    1. Arhan P, Devroede G, Jehannin B, Lanza M, Faverdin C, Dornic C, Persoz B, Tétreault L, Perey B, Pellerin D. Segmental colonic transit time. Dis Colon Rectum 24: 625–629, 1981. doi:10.1007/BF02605761. - DOI - PubMed

Publication types

LinkOut - more resources