. 2020 May 18;9(10):e015929.
doi: 10.1161/JAHA.118.015929. Epub 2020 May 9.

Correlations of Calf Muscle Macrophage Content With Muscle Properties and Walking Performance in Peripheral Artery Disease

Affiliations

Correlations of Calf Muscle Macrophage Content With Muscle Properties and Walking Performance in Peripheral Artery Disease

Kate Kosmac et al. J Am Heart Assoc. .

Abstract

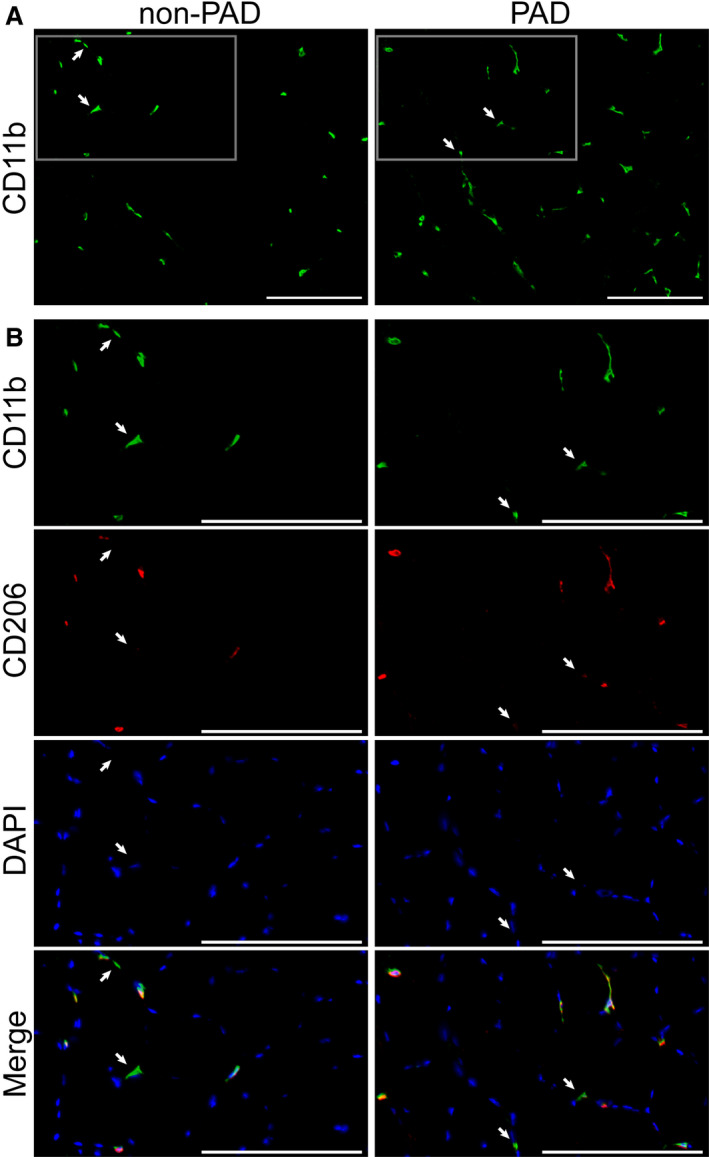
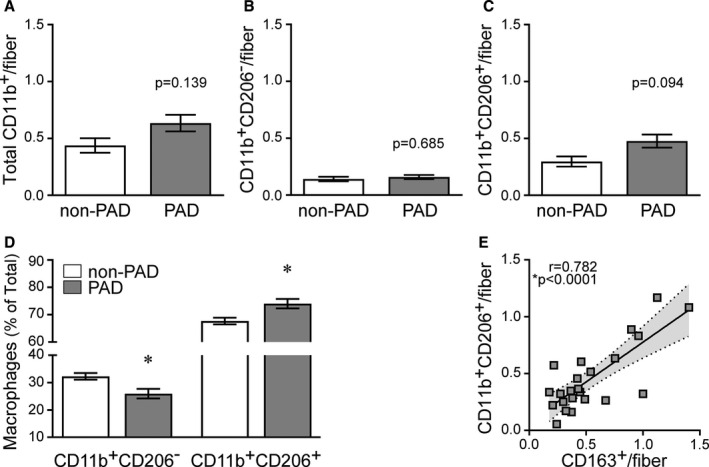
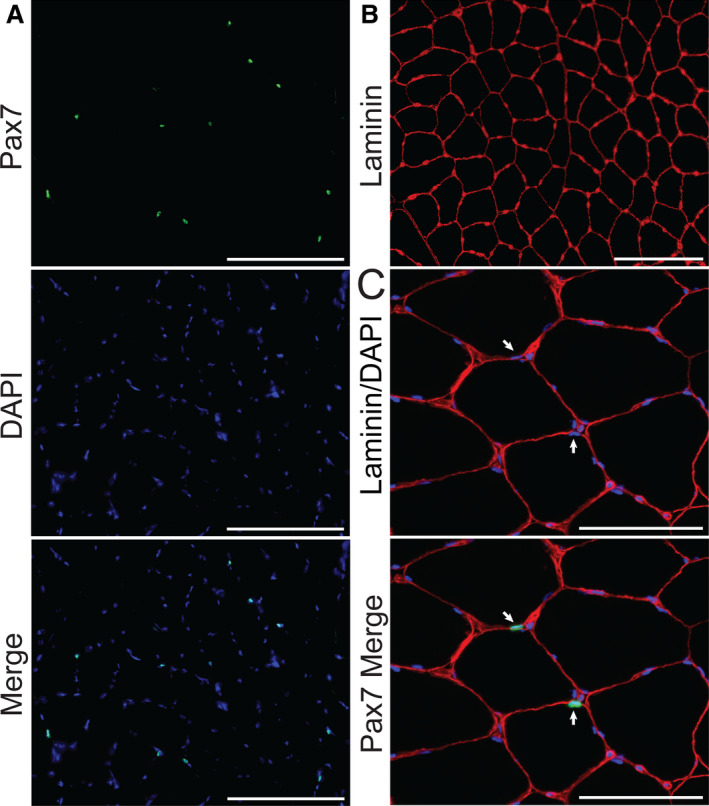
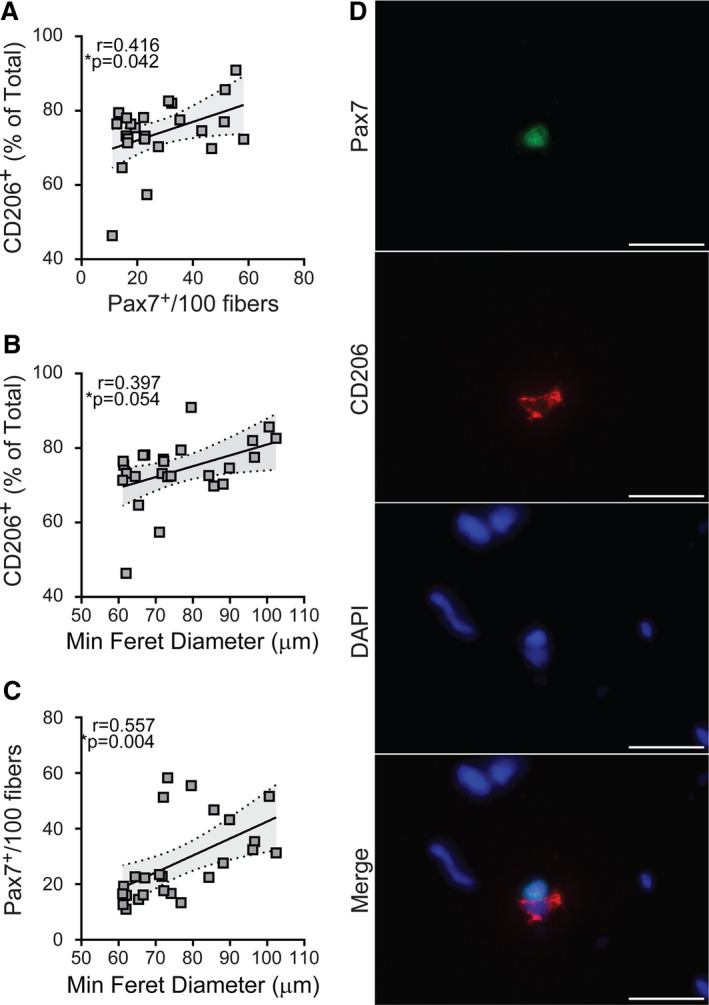
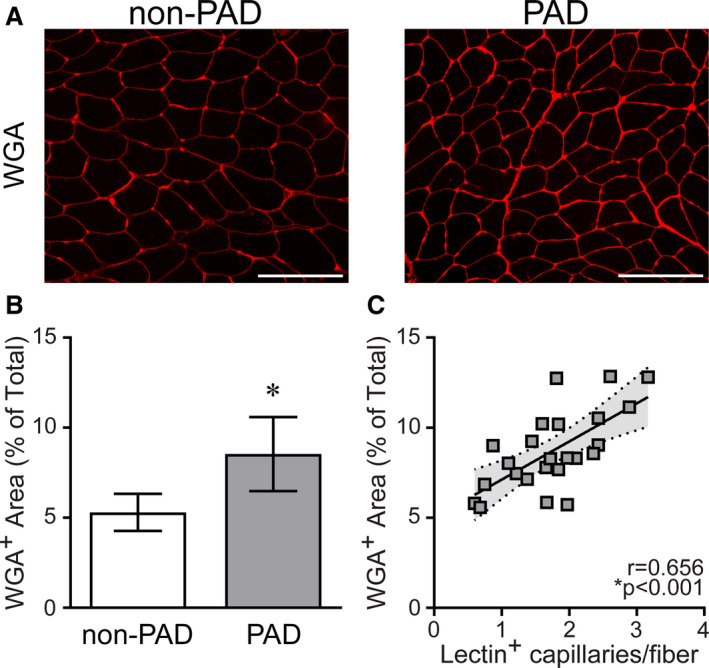
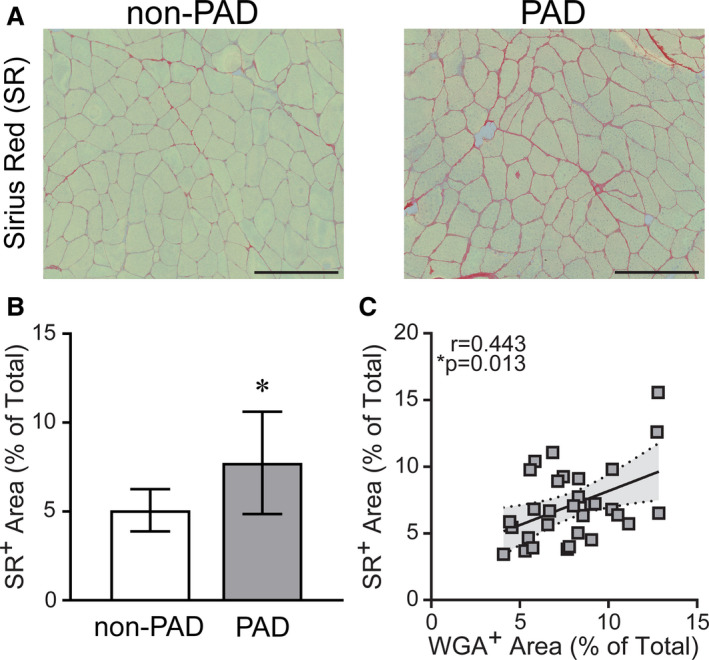
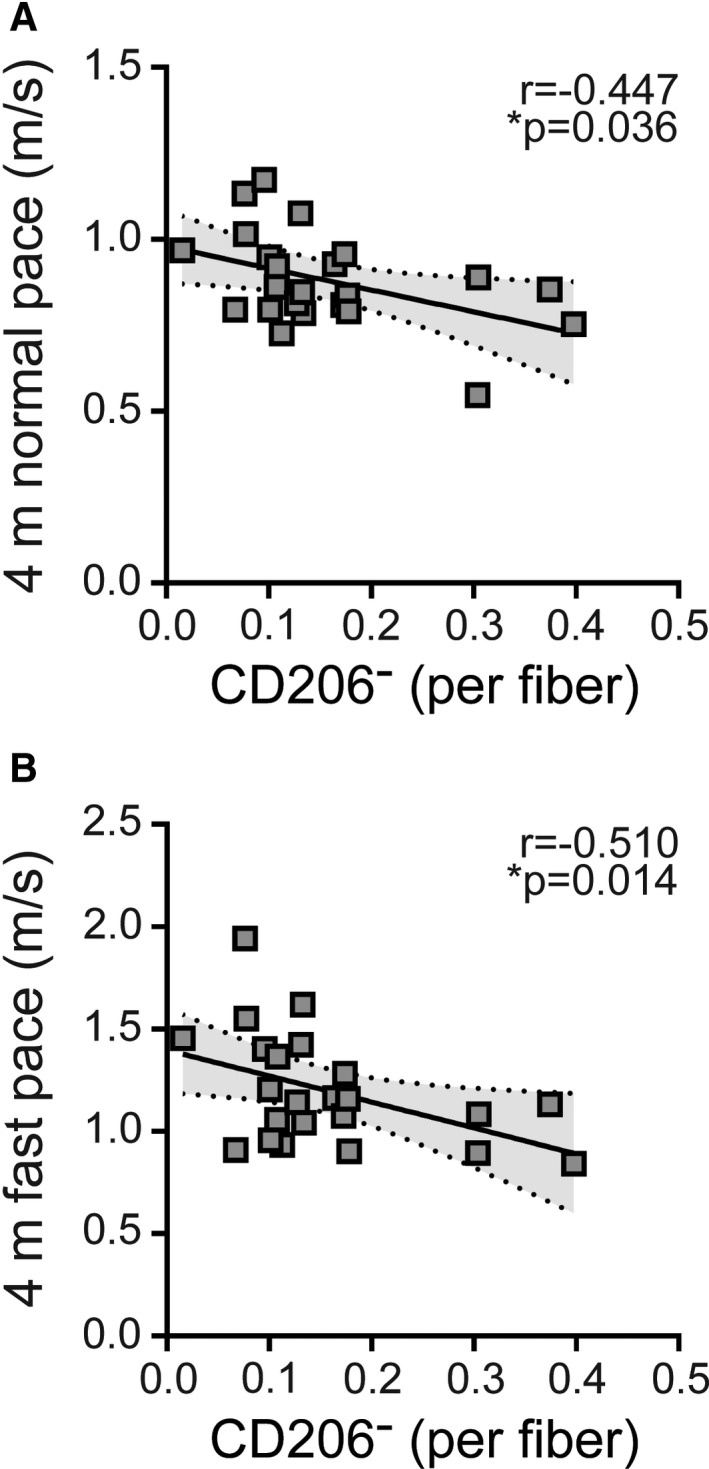
Background Peripheral artery disease (PAD) is a manifestation of atherosclerosis characterized by reduced blood flow to the lower extremities and mobility loss. Preliminary evidence suggests PAD damages skeletal muscle, resulting in muscle impairments that contribute to functional decline. We sought to determine whether PAD is associated with an altered macrophage profile in gastrocnemius muscles and whether muscle macrophage populations are associated with impaired muscle phenotype and walking performance in patients with PAD. Methods and Results Macrophages, satellite cells, and extracellular matrix in gastrocnemius muscles from 25 patients with PAD and 7 patients without PAD were quantified using immunohistochemistry. Among patients with PAD, both the absolute number and percentage of cluster of differentiation (CD) 11b+CD206+ M2-like macrophages positively correlated to satellite cell number (r=0.461 [P=0.023] and r=0.416 [P=0.042], respectively) but not capillary density or extracellular matrix. The number of CD11b+CD206- macrophages negatively correlated to 4-meter walk tests at normal (r=-0.447, P=0.036) and fast pace (r=-0.510, P=0.014). Extracellular matrix occupied more muscle area in PAD compared with non-PAD (8.72±2.19% versus 5.30±1.03%, P<0.001) and positively correlated with capillary density (r=0.656, P<0.001). Conclusions Among people with PAD, higher CD206+ M2-like macrophage abundance was associated with greater satellite cell numbers and muscle fiber size. Lower CD206- macrophage abundance was associated with better walking performance. Further study is needed to determine whether CD206+ macrophages are associated with ongoing reparative processes enabling skeletal muscle adaptation to damage with PAD. Registration URL: https://www.clini​caltr​ials.gov; Unique identifiers: NCT00693940, NCT01408901, NCT0224660.

Keywords: macrophage; peripheral artery disease; skeletal muscle; walking performance.


Figures

Figure 1
Figure 1. Representative images of total cluster of differentiation (CD) 11b+, CD206−, and CD206+ macrophage abundance in the gastrocnemius muscle of patients with peripheral artery disease (PAD) compared with patients without PAD.
A, Total muscle macrophages in patients without PAD (left) and patients with PAD (right) visualized by immunohistochemistry with an antibody against the pan‐macrophage marker CD11b (green). Scale bar=200 µm. B, Higher magnification images of macrophages from boxed regions in panel A, showing CD11b+ (green) macrophages, CD206+ (red) macrophages, and the merged images, also overlaid with DAPI staining of nuclei (blue). Whereas the majority of macrophages are CD11b+CD206+, white arrows indicate CD11b+CD206− macrophages. Scale bar=200 µm.
Figure 2
Figure 2. Quantification of macrophage content in gastrocnemius muscle cross‐sections. A through D, Non‐peripheral artery disease (non‐PAD, n=6), peripheral artery disease (PAD) (n=25).
Data are expressed as mean±SE; P values adjusted for race, *significance P≤0.05. A, Total cluster of differentiation (CD) 11b+ macrophages in patients with PAD compared with patients without PAD. B, CD11b+CD206− macrophages in patients without PAD and patients with PAD. C, CD11b+CD206+ macrophages in patients without PAD and patients with PAD. D, Relative abundance (% of total) of CD206− and CD206+ macrophages in patients with PAD and patients without PAD. E, Association of the M2c macrophage marker CD163 with the number of CD206+ macrophages, supporting CD206+ macrophages as M2‐like. Non‐PAD (n=5), PAD (n=18). Association determined by Pearson product moment correlation, r=partial correlation coefficient.
Figure 3
Figure 3. Representative images of muscle satellite cells with laminin‐demarcated muscle fibers in gastrocnemius from peripheral artery disease (PAD).
A, Paired box 7+ (Pax7+) (green) staining overlapping cell nuclei (DAPI, blue) identifies satellite cells. Scale bar=200 µm. B, Laminin demarcating muscle fiber borders (red). Scale bar=200 µm. C, Higher magnification showing satellite cells located beneath the laminin‐stained basal lamina. White arrows point to satellite cell nuclei; Pax7 (green), nuclei (DAPI, blue), laminin (red). Scale bar=100 µm.
Figure 4
Figure 4. Relative abundance of cluster of differentiation (CD) 206+ macrophages is positively associated with satellite cell number and fiber size in the gastrocnemius muscle from patients with peripheral artery disease (PAD).
Scatterplots showing correlations between the relative abundance of CD206+ macrophages and (A) satellite cell content and (B) fiber size, measured by minimum feret diameter. C, Correlation between satellite cells and fiber size. For all measures, relationships determined by Pearson product moment correlation adjusting for race, r=partial correlation coefficient, PAD (n=25). D, Representative images showing a satellite cell (paired box 7 [Pax7]+, green) and a CD206+ macrophage (red) in close proximity. DAPI (blue) stains nuclei. Scale bar=20 µm.
Figure 5
Figure 5. Peripheral artery disease (PAD) gastrocnemius muscles show higher extracellular matrix (ECM) content compared with non‐PAD.
A, Representative images of gastrocnemius muscle showing fluorescently labeled α‐wheat germ agglutinin (WGA) staining of glycosaminoglycans in the ECM between muscle fibers in patients without PAD and patients with PAD, quantified in (B). Scale bar=200 µm. Non‐PAD (n=7), PAD (n=24). Data are expressed as mean±SD; P values adjusted for race, *significance P≤0.05. C, Correlation of ECM content with capillary density (the number of lectin+ capillaries/fiber) in patients with PAD (n=24), determined by Pearson product moment correlation adjusting for race, r=partial correlation coefficient. No relationship between ECM content and capillary density was observed in non‐PAD samples (data not shown).
Figure 6
Figure 6. Peripheral artery disease (PAD) gastrocnemius muscles show higher collagen content compared with non‐PAD.
A, Representative images of gastrocnemius muscle showing Sirius Red (SR) staining of collagens between muscle fibers in patients without PAD and patients with PAD, quantified in (B). Scale bar=200 μm. Non‐PAD (n=7), PAD (n=24). Data are expressed as mean±SD; P values adjusted for race, *significance P≤0.05. C, Correlation of collagen content (SR+ area) with extracellular matrix (ECM) content (α‐wheat germ agglutinin [WGA]+ area) in all patients (n=31), determined by Pearson product moment correlation, r=partial correlation coefficient.
Figure 7
Figure 7. Cluster of differentiation (CD) 206− macrophages in gastrocnemius muscle are associated with poor walking performance in patients with peripheral artery disease (PAD).
Scatterplots showing correlations between the abundance of CD206− macrophages and functional performance measured with (A) 4‐meter normal pace test (95% CI of r=−0.726 to −0.021), (B) 4‐meter fast pace test (95% CI of r=−0.762 to −0.101) For all measures, relationships determined by Pearson product moment correlation adjusting for race, r=partial correlation coefficient, PAD (n=23).

References

    1. Fowkes FG, Aboyans V, Fowkes FJ, McDermott MM, Sampson UK, Criqui MH. Peripheral artery disease: epidemiology and global perspectives. Nat Rev Cardiol. 2017;14:156–170. - PubMed
    1. McDermott MM, Greenland P, Liu K, Guralnik JM, Criqui MH, Dolan NC, Chan C, Celic L, Pearce WH, Schneider JR, et al. Leg symptoms in peripheral arterial disease: associated clinical characteristics and functional impairment. JAMA. 2001;286:1599–1606. - PubMed
    1. McDermott MM, Liu K, Greenland P, Guralnik JM, Criqui MH, Chan C, Pearce WH, Schneider JR, Ferrucci L, Celic L, et al. Functional decline in peripheral arterial disease: associations with the ankle brachial index and leg symptoms. JAMA. 2004;292:453–461. - PubMed
    1. McDermott MM. Functional impairment in peripheral artery disease and how to improve it in 2013. Curr Cardiol Rep. 2013;15:347. - PMC - PubMed
    1. McDermott MM, Greenland P, Liu K, Guralnik JM, Celic L, Criqui MH, Chan C, Martin GJ, Schneider J, Pearce WH, et al. The ankle brachial index is associated with leg function and physical activity: the Walking and Leg Circulation Study. Ann Intern Med. 2002;136:​873–883. - PubMed

Publication types

MeSH terms

Associated data