. 2020 Apr 22:14:59.
doi: 10.3389/fnbeh.2020.00059. eCollection 2020.

Application of 9.4T MRI in Wilson Disease Model TX Mice With Quantitative Susceptibility Mapping to Assess Copper Distribution

Affiliations

Application of 9.4T MRI in Wilson Disease Model TX Mice With Quantitative Susceptibility Mapping to Assess Copper Distribution

Yongsheng Han et al. Front Behav Neurosci. .

Abstract

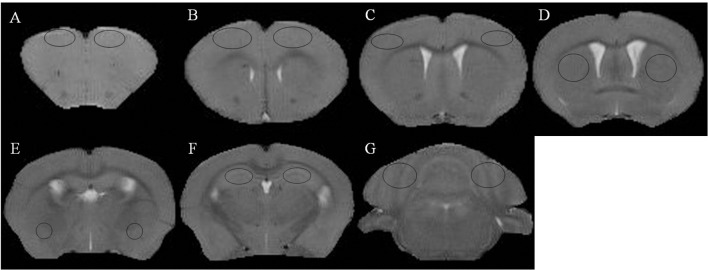
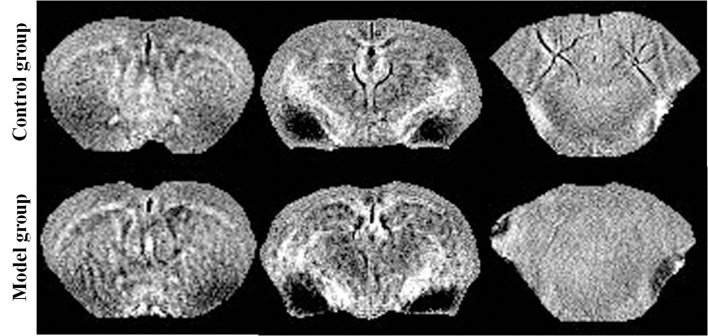
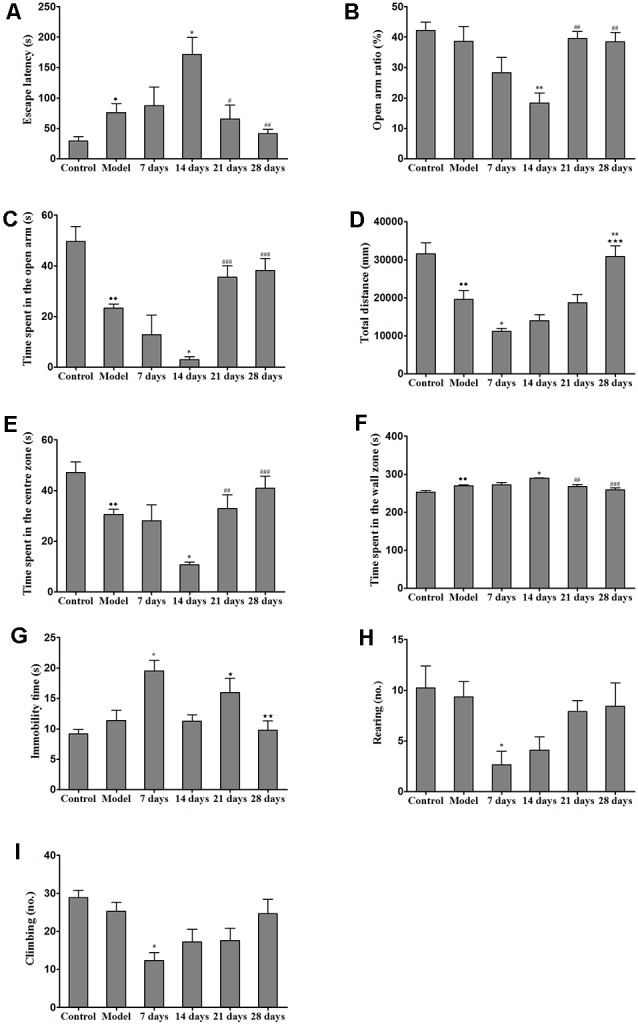
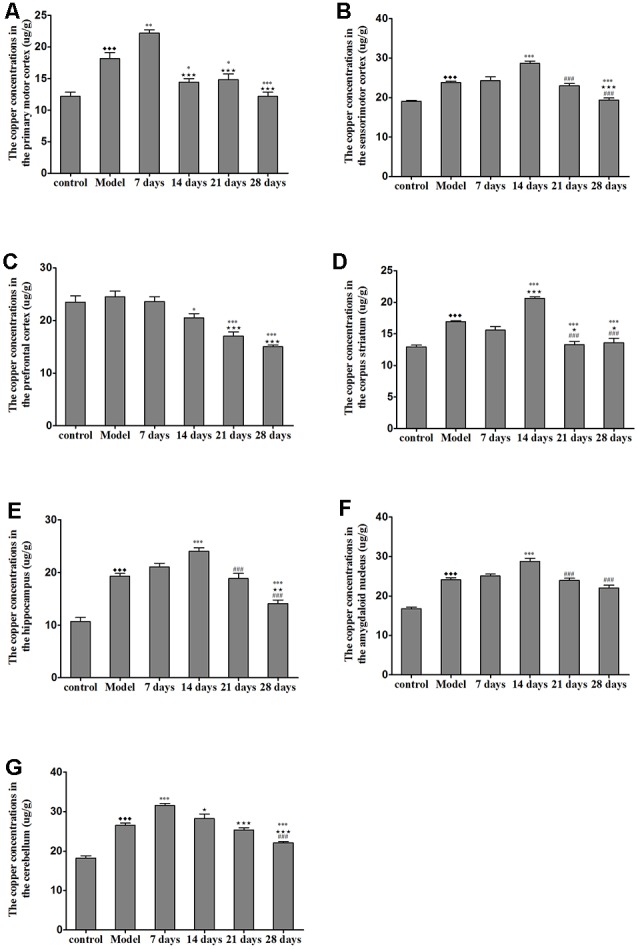
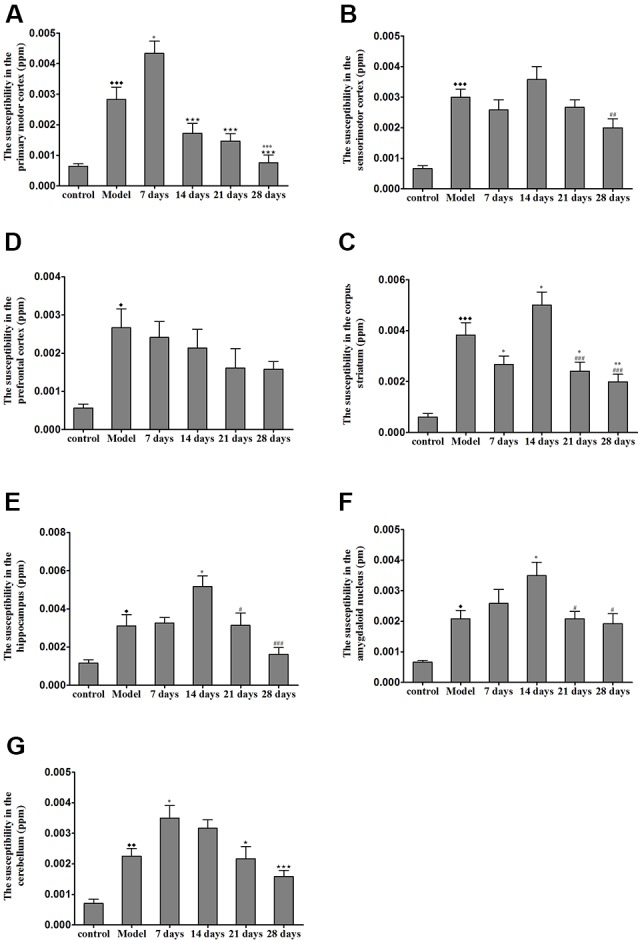
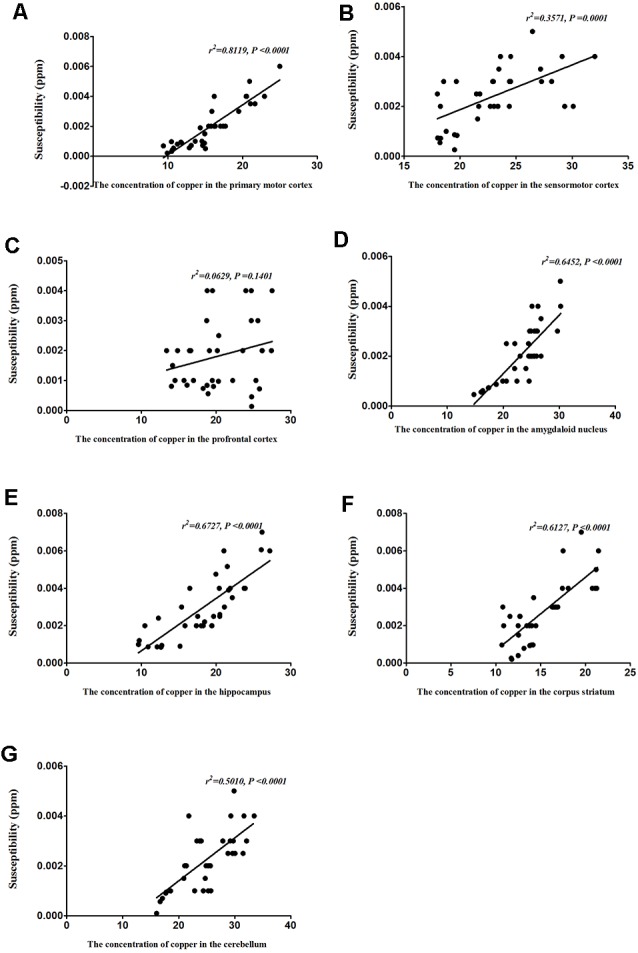
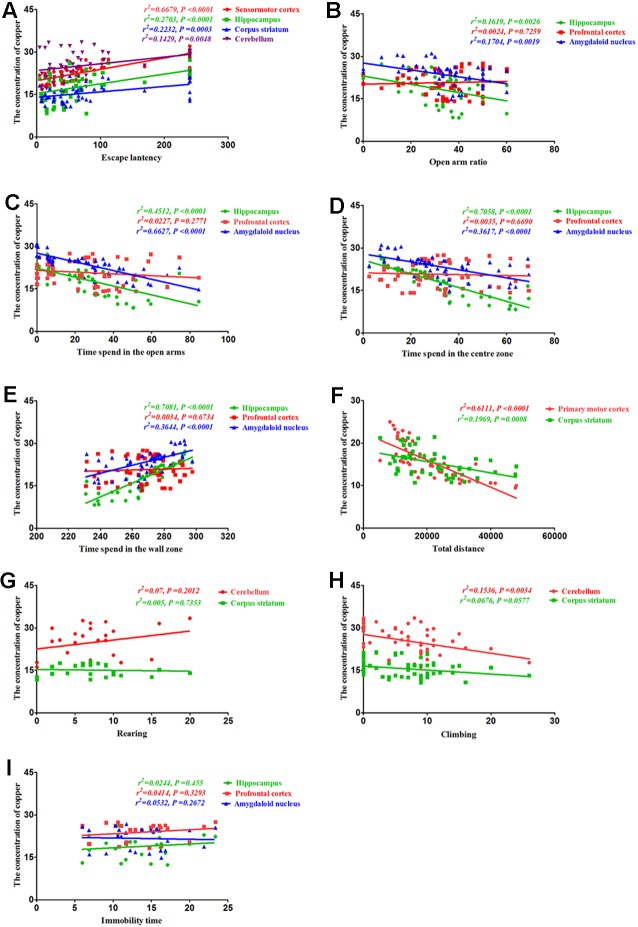
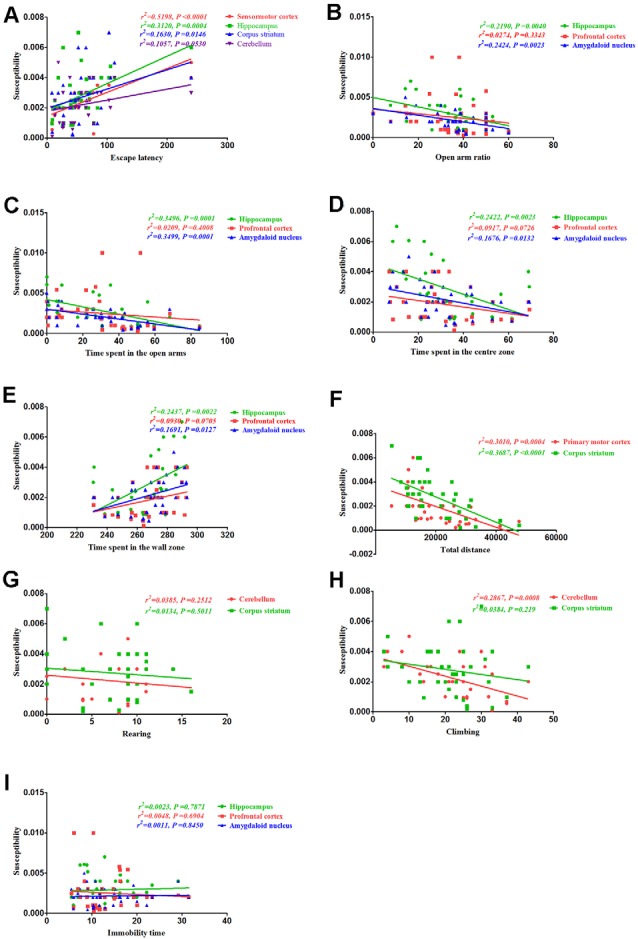
In the current study, we used 9.4-tesla magnetic resonance imaging (9.4T MRI) and inductively coupled plasma mass spectrometry (ICP-MS) to investigate the distribution of copper in the brain samples of a murine model of Wilson's disease (WD) following penicillamine (PCA) treatment. We also evaluated if the distribution of copper in the brain samples of mice was correlated with behavioral symptoms. Results from the behavioral experiments showed that 7 days of PCA treatment decreased the total distance traveled in the open field and the number of rearing and climbing instances among the toxic milk (TX) mice as compared with model group. We also observed that the open arm ratio in the elevated plus-maze (EPM) was reduced, escape latency in the Barnes maze test was increased, and avoidance in the open field was enhanced in TX mice following 14 days of PCA treatment as compared with those in untreated TX mice. We found that PCA treatment for 21-28 days improved the cognitive abilities, exploratory behavior, and movement behavior of TX mice. The PCA-treated mice also exhibited varying degrees of magnetic susceptibilities in the cortex, corpus striatum, hippocampus, and amygdaloid nucleus across the treatment period. Low copper concentrations were found in all of the analyzed brain regions of PCA-treated mice after 21-28 days as compared with the model group (P < 0.05). However, copper concentrations were increased in the primary motor cortex and cerebellum at 7 days post-PCA treatment as compared with those in the model group (P < 0.05). After 14 days of PCA treatment, the copper concentrations in the sensorimotor cortex, corpus striatum, hippocampus, and amygdaloid nucleus were higher than those detected without treatment. The results from a Pearson's correlation analysis revealed that there was a significant (P < 0.05) correlation between copper concentrations and magnetic susceptibility in all of the brain regions that were analyzed. Therefore, our results indicate that copper concentration and magnetic susceptibility are associated with alterations in mood-related behavior, recognition memory, and movement behaviors in TX mice that are treated with PCA. The redistribution of copper in the TX mouse brain during PCA treatment may aggravate changes in behavioral performance.

Keywords: 9.4-Tesla magnetic resonance; TX mouse; Wilson disease; penicillamine; quantitative susceptibility mapping.


Figures

Figure 1
Figure 1
T2 weighted images and regions of interest. (A) Prefrontal cortex. (B) Primary motor cortex. (C) Sensorimotor cortex. (D) Corpus striatum. (E) Amygdaloid nucleus. (F) Hippocampus. (G) Cerebellum.
Figure 2
Figure 2
Quantitative susceptibility mapping at the same slice of the control/model group.
Figure 3
Figure 3
Effects of penicillamine (PCA) on behavior in toxic milk (TX) mice. (A) The escape latency of the model group was increased as compared with that of the wild-type control group. The escape latency of the TX mice after 14 days of PCA treatment was prolonged. The escape latencies of TX mice were decreased on the 21st and 28th days of PCA treatment as compared with those of TX mice on the 14th day of PCA treatment. (B) The open arm ratio of the TX mice decreased after 14 days of PCA treatment. On the 21st and 28th days of PCA treatment, the open arm ratio was significantly increased as compared with that on the 14th day of PCA treatment. (C) The amount of time spent in the open arms in the model group was significantly decreased as compared with that in the control group. The amount of time spent in the open arms was significantly decreased on the 14th day of PCA administration and increased on the 21st and 28th days of PCA treatment in the TX mice as compared with that in the model group. (D) The total distance traveled by the TX mice was significantly decreased as compared with the total distance traveled by the control group. The total distance traveled by the TX mice decreased after 7 days of PCA treatment. The total distance traveled was significantly increased on the 28th day of PCA treatment as compared with that on the 7th day of PCA treatment. (E) The amount of time spent in the center zone by the model group was significantly decreased as compared with the amount of time spent in the center zone by the control group. The amount of time spent in the center zone decreased on the 14th day of PCA treatment, and significantly increased on the 21st and 28th days of PCA treatment. (F) Mice in the model group spent significantly more time in the wall zone than did mice in the control group. The amount of time spent in the wall zone increased on the 14th day of PCA treatment, and decreased on the 21st and 28th days of PCA treatment. (G) The immobility time of TX mice was significantly increased on the 7th day of PCA treatment and significantly decreased on the 14th and 28th days of PCA treatment as compared with the immobility time of the model group. (H) The number of rearing instances in TX mice was significantly decreased on the 7th day of PCA treatment as compared with that in the model group. (I) On the 7th day of PCA treatment, the number of climbing instances was significantly decreased as compared with that in the model group. Data are presented as the mean ± standard error of the mean (SEM); one-way ANOVA and Bonferroni’s post hoc test, P < 0.05, ⧫⧫P < 0.01 vs. the corresponding control group; *P < 0.05, **P < 0.01 vs. the corresponding model group; P < 0.05, ⋆⋆P < 0.01, ***P < 0.001 vs. the corresponding 7th-day group; #P < 0.05, ##P < 0.01, ###P < 0.001 vs. the corresponding 14th-day group.
Figure 4
Figure 4
Total copper concentration in TX mouse brain samples after PCA treatment. (A,B) The copper concentrations in the primary motor cortex were significantly increased in TX mice after 7 days as compared with those in mice in the model group. Additionally, the copper concentrations in the sensorimotor cortex were significantly increased in TX mice after 14 days of treatment with PCA and decreased on the 28th day of treatment as compared with those in the model group. (C) The copper concentrations in the prefrontal cortex of TX mice decreased with PCA administration. (D–F) The copper concentrations in the corpus striatum, hippocampus, and amygdaloid nucleus of TX mice increased on the 14th day of treatment and decreased on the 21st and 28th days of treatment. (G) The copper concentrations in the cerebellum of TX mice increased on the 7th day of treatment and decreased on the 21st and 28th days of treatment. Data are presented as the mean ± SEM; n = 9 animals/group; one-way ANOVA, and Bonferroni’s post hoc test, ⧫⧫⧫P < 0.001 vs. the corresponding control group; *P < 0.05, **P < 0.01, ***P < 0.001 vs. the corresponding model group; P < 0.05, ⋆⋆P < 0.01, ⋆⋆⋆P < 0.001 vs. the corresponding 7th day group; ###P < 0.001 vs. the corresponding 14th day group.
Figure 5
Figure 5
Susceptibility values in various regions of TX mice brain after PCA treatment. (A) The magnetic susceptibility in the primary motor cortex of the TX mice was increased as compared with that in the primary motor cortex of mice in the control group. The magnetic susceptibility increased in the primary motor cortex after 7 days of treatment with PCA and decreased on 14, 21, 28 days of PCA treatment. (B) The magnetic susceptibility in the sensorimotor cortex of the TX mice was significantly increased as compared with that in the sensorimotor cortex of mice in the control group. (C) The magnetic susceptibility of the TX mice in the prefrontal cortex was increased as compared with that of mice in the control group. (D–F) The magnetic susceptibility of the TX mice in the corpus striatum, hippocampus, and amygdaloid nucleus, respectively, was increased as compared with that of mice in the control group. The magnetic susceptibility in the corpus striatum, hippocampus, and amygdaloid nucleus of TX mice increased on the 14th day and decreased on the 21st and 28th days. (G) The magnetic susceptibility in the cerebellum of TX mice was increased as compared with that in the cerebellum of mice in the control group. The magnetic susceptibility in the cerebellum of TX mice increased on the 7th day and decreased on the 21st and 28th days. Data are presented as the mean ± SEM; n = 6 animals/group; one-way ANOVA, and Bonferroni’s post hoc test, P < 0.05, ⧫⧫P < 0.01, ⧫⧫⧫P < 0.001 vs. the corresponding control group; *P < 0.05, **P < 0.01, ***P < 0.001 vs. the corresponding model group; P < 0.05, ⋆⋆⋆P < 0.001 vs. the corresponding 7th day group; #P < 0.05, ##P < 0.01, ###P < 0.001 vs. the corresponding 14th day group.
Figure 6
Figure 6
Correlation between copper concentrations and magnetic susceptibility. (A) Correlation between magnetic susceptibility and copper concentrations in the primary motor cortex. (B) Correlation between magnetic susceptibility and copper concentrations in the sensorimotor cortex. (C) Correlation between magnetic susceptibility and copper concentrations in the prefrontal cortex. (D) Correlation between magnetic susceptibility and copper concentrations in the amygdaloid nucleus. (E) Correlation between magnetic susceptibility and copper concentrations in the hippocampus. (F) Correlation between magnetic susceptibility and copper concentrations in the corpus striatum. (G) Correlation between magnetic susceptibility and copper concentrations in the cerebellum.
Figure 7
Figure 7
Correlation between behavior and copper concentrations. (A) Correlation between escape latency and copper concentrations. Escape latencies were significantly correlated with copper concentrations in the sensorimotor cortex, hippocampus, corpus striatum, and cerebellum. (B) Correlation between the open arm ratio and copper concentrations. The open arm ratio was significantly correlated with copper concentrations in the hippocampus and amygdaloid nucleus, but no significant correlations were observed between the open arm ratio and copper concentrations in the prefrontal cortex. (C) Correlation between the amount of time spent in the open arms of the elevated plus-maze (EPM) and copper concentrations. The amount of time spent in the open arms was significantly correlated with copper concentrations in the hippocampus and amygdaloid nucleus, but no significant correlations were observed between the amount of time spent in the open arms and copper concentrations in the prefrontal cortex. (D) Correlation between the amount of time spent in the center zone and copper concentrations. The amount of time spent in the center zone was significantly correlated with copper concentrations in the hippocampus and amygdaloid nucleus, but no significant correlations were observed between the amount of time spent in the center zone and copper concentrations in the prefrontal cortex. (E) Correlation between the amount of time spent in the wall zone and copper concentrations. The amount of time spent in the wall zone was significantly correlated with copper concentrations in the hippocampus and amygdaloid nucleus, but no significant correlations were observed between the amount of time spent in the wall zone and copper concentrations in the prefrontal cortex. (F) Correlation between the total distance traveled and copper concentrations. The total distance traveled was significantly correlated with copper concentrations in the primary motor cortex and corpus striatum. (G) Correlation between rearing and copper concentrations. There were no significant correlations between rearing and copper concentrations in the cerebellum and corpus striatum. (H) Correlation between climbing and copper concentrations. Climbing was significantly correlated with copper concentrations in the cerebellum, but no significant correlations were observed between climbing and copper concentrations in the corpus striatum. (I) Correlation between immobility time and copper concentrations. No obvious correlation was found between immobility time and copper concentrations in the hippocampus, prefrontal cortex, and amygdaloid nucleus.
Figure 8
Figure 8
Correlation between behavior and magnetic susceptibility. (A) Correlation between escape latency and magnetic susceptibility. The escape latencies were significantly correlated with magnetic susceptibility in the sensorimotor cortex, hippocampus, and corpus striatum, but no significant correlations were observed between the escape latencies and magnetic susceptibility in the cerebellum. (B) Correlation between the open arm ratio and magnetic susceptibility. The open arm ratio was significantly correlated with magnetic susceptibility in the hippocampus and amygdaloid nucleus, but no significant correlations were observed between the open arm ratio and magnetic susceptibility in the prefrontal cortex. (C) Correlation between the amount of time spent in the open arms of the EPM and magnetic susceptibility. The amount of time spent in the open arms was significantly correlated with magnetic susceptibility in the hippocampus and amygdaloid nucleus, but no significant correlations were observed between the amount of time spent in the open arms and magnetic susceptibility in the prefrontal cortex. (D) Correlation between the amount of time spent in the center zone and magnetic susceptibility. The amount of time spent in the center zone was significantly correlated with magnetic susceptibility in the hippocampus and amygdaloid nucleus, but no significant correlations were observed between the amount of time spent in the center zone and magnetic susceptibility in the prefrontal cortex. (E) Correlation between the amount of time spent in the wall zone and magnetic susceptibility. The amount of time spent in the wall zone was significantly correlated with magnetic susceptibility in the hippocampus and amygdaloid nucleus, but no significant correlations were observed between the amount of time spent in the wall zone and magnetic susceptibility in the prefrontal cortex. (F) Correlation between the total distance traveled and magnetic susceptibility. The total distance traveled was significantly correlated with the magnetic susceptibility in the primary motor cortex and corpus striatum. (G) Correlation between rearing and magnetic susceptibility. There were no significant correlations were rearing and magnetic susceptibility in the cerebellum and corpus striatum. (H) Correlation between climbing and magnetic susceptibility. Climbing was significantly correlated with magnetic susceptibility in the cerebellum, but no significant correlations were observed between climbing and magnetic susceptibility in the corpus striatum. (I) Correlation between immobility time and magnetic susceptibility. There were no obvious correlations between immobility time and magnetic susceptibility in the hippocampus, prefrontal cortex, and amygdaloid nucleus.

Similar articles

Cited by

References

    1. Aggarwal A., Bhatt M. (2014). The pragmatic treatment of Wilson’s disease. Mov. Disord. Clin. Pract. 1, 14–23. 10.1002/mdc3.12003 - DOI - PMC - PubMed
    1. Ala A., Walker A. P., Ashkan K., Dooley J. S., Schilsky M. L. (2007). Wilson’s disease. Lancet 369, 397–408. 10.1016/S0140-6736(07)60196-2 - DOI - PubMed
    1. Appenzeller-Herzog C., Mathes T., Heeres M., Weiss K. H., Houwen R., Ewald H. (2019). Comparative effectiveness of common therapies for Wilson disease: a systematic review and meta-analysis of controlled studies. Liver Int. 39, 2136–2152. 10.1111/liv.14179 - DOI - PubMed
    1. Boga S., Jain D., Schilsky M. L. (2015). Trientine induced colitis during therapy for Wilson disease: a case report and review of the literature. BMC Pharmacol. Toxicol. 16:30. 10.1186/s40360-015-0031-z - DOI - PMC - PubMed
    1. Brewer G. J., Terry C. A., Aisen A. M., Hill G. M. (1987). Worsening of neurologic syndrome in patients with Wilson’s disease with initial penicillamine therapy. Arch. Neurol. 44, 490–493. 10.1001/archneur.1987.00520170020016 - DOI - PubMed

LinkOut - more resources