

Genome-Wide Association Study Reveals Novel Marker-Trait Associations (MTAs) Governing the Localization of Fe and Zn in the Rice Grain
- PMID: 32391041
- PMCID: PMC7188789
- DOI: 10.3389/fgene.2020.00213
Genome-Wide Association Study Reveals Novel Marker-Trait Associations (MTAs) Governing the Localization of Fe and Zn in the Rice Grain
Abstract
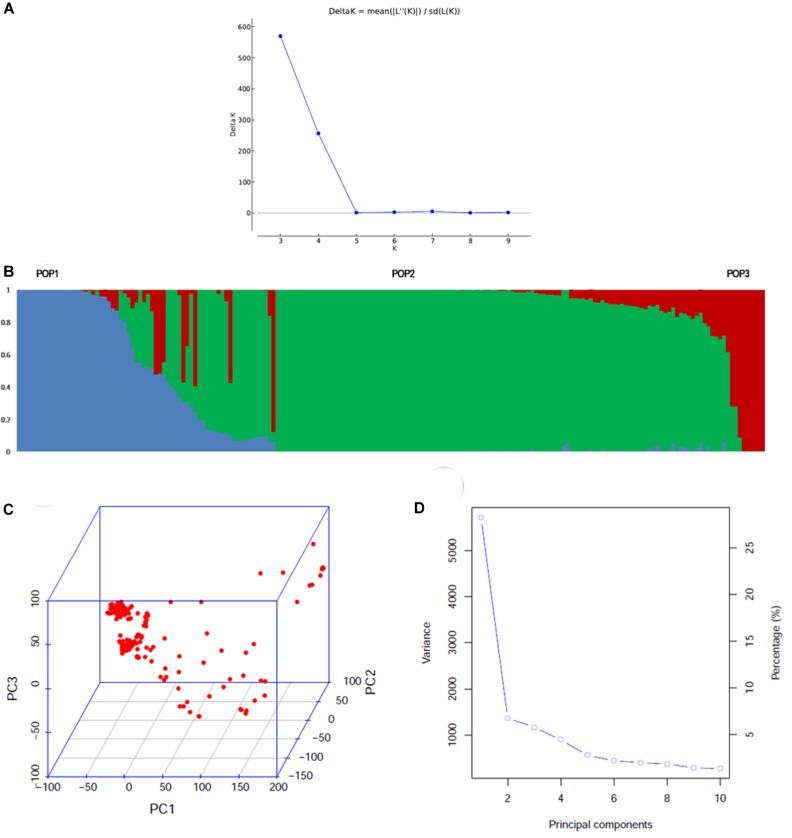
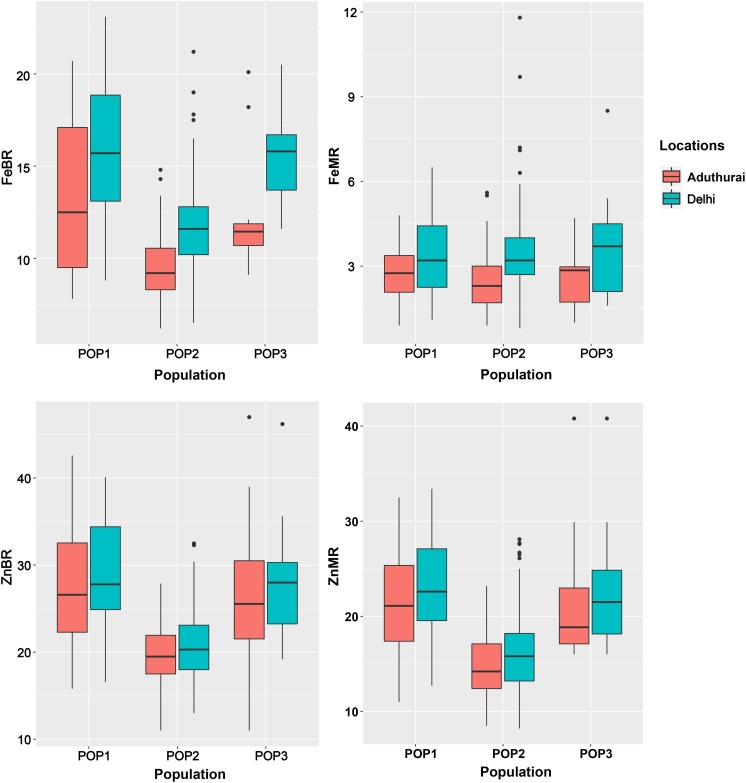
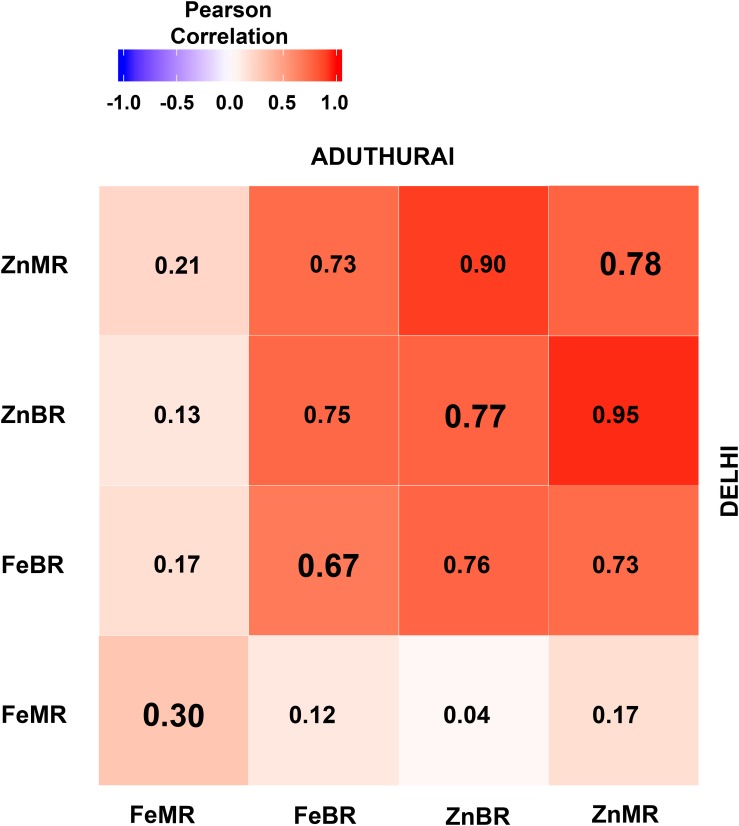
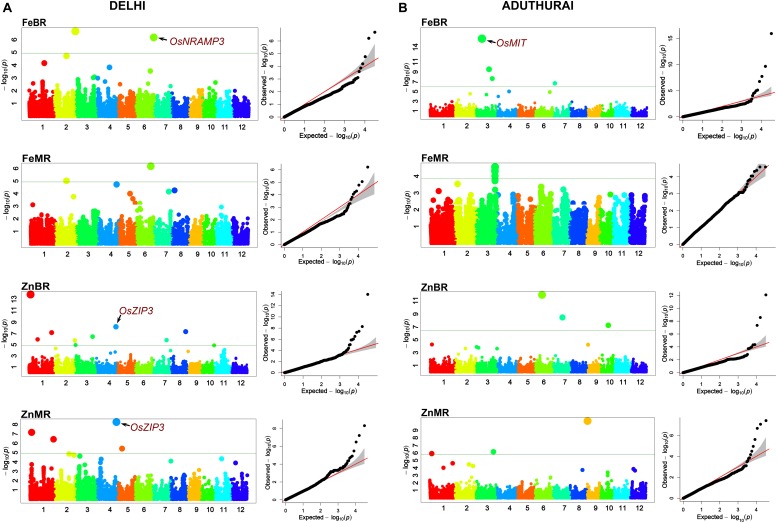
Micronutrient malnutrition due to Fe and Zn, affects around two billion people globally particularly in the developing countries. More than 90% of the Asian population is dependent on rice-based diets, which is low in these micronutrients. In the present study, a set of 192 Indian rice germplasm accessions, grown at two locations, were evaluated for Fe and Zn in brown rice (BR) and milled rice (MR). A significant variation was observed in the rice germplasm for these micronutrients. The grain Fe concentration was in the range of 6.2-23.1 ppm in BR and 0.8-12.3 ppm in MR, while grain Zn concentration was found to be in the range of 11.0-47.0 ppm and 8.2-40.8 ppm in the BR and MR, respectively. Grain Fe exhibited maximum loss upon milling with a mean retention of 24.9% in MR, while Zn showed a greater mean retention of 74.2% in MR. A genome-wide association study (GWAS) was carried out implementing the FarmCPU model to control the population structure and kinship, and resulted in the identification of 29 marker-trait associations (MTAs) with significant associations for traits viz. FeBR (6 MTAs), FeMR (7 MTAs), ZnBR (11 MTAs), and ZnMR (5 MTAs), which could explain the phenotypic variance from 2.1 to as high as 53.3%. The MTAs governing the correlated traits showed co-localization, signifying the possibility of their simultaneous improvement. The robust MTAs identified in the study could be valuable resource for enhancing Fe and Zn concentration in the rice grain and addressing the problem of Fe and Zn malnutrition among rice consumers.
Keywords: Fe; GWAS; Zn; biofortification; brown rice; donors; milled rice; rice.
Copyright © 2020 Bollinedi, Yadav, Vinod, Gopala Krishnan, Bhowmick, Nagarajan, Neeraja, Ellur and Singh.
Figures
References
-
- Anuradha K., Agarwal S., Batchu A. K., Babu P. A., Swamy B. P. M., Longvah T., et al. (2012a). Evaluating rice germplasm for iron and zinc concentration in brown rice and seed dimensions. J. Phytol. 4 19–25.
-
- Bashir K., Ishimaru Y., Nishizawa N. K. (2012). Molecular mechanisms of zinc uptake and translocation in rice. Plant Soil 361 189–201. 10.1007/s11104-012-1240-5 - DOI
LinkOut - more resources
Full Text Sources