. 2016 Sep;3(9):094001.
doi: 10.1088/2053-1591/3/9/094001. Epub 2016 Sep 2.

Enabling long term monitoring of dopamine using dimensionally stable ultrananocrystalline diamond microelectrodes

Affiliations

Enabling long term monitoring of dopamine using dimensionally stable ultrananocrystalline diamond microelectrodes

Gaurab Dutta et al. Mater Res Express. 2016 Sep.

Abstract

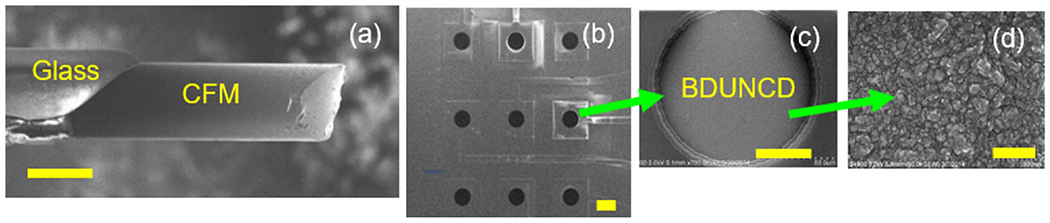
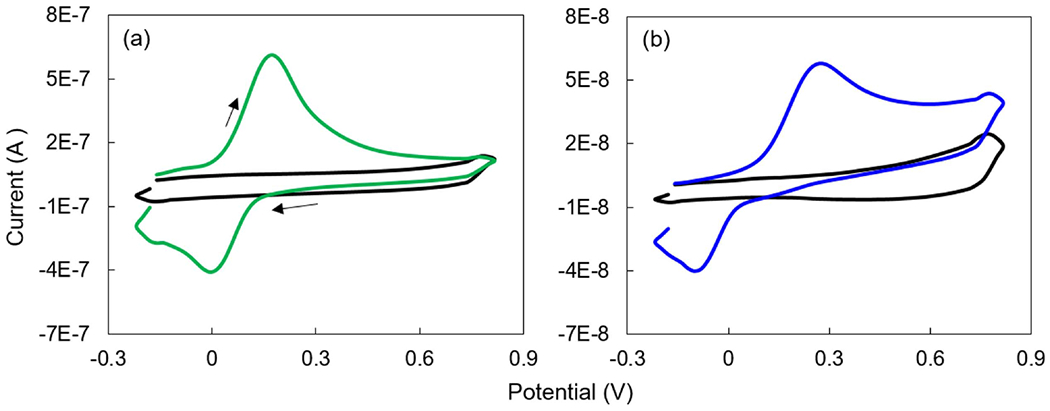
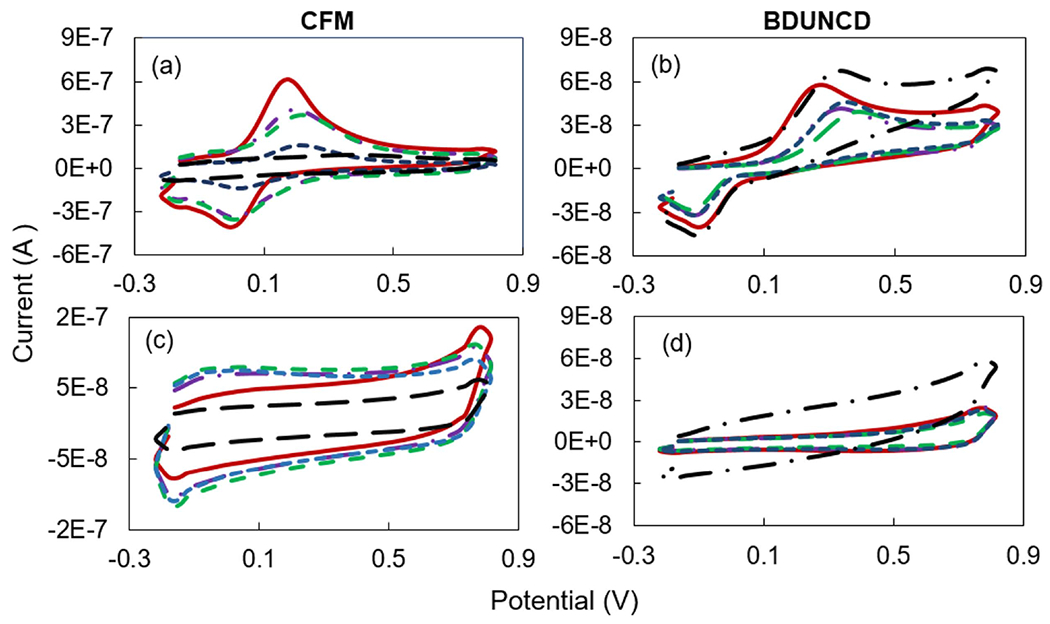
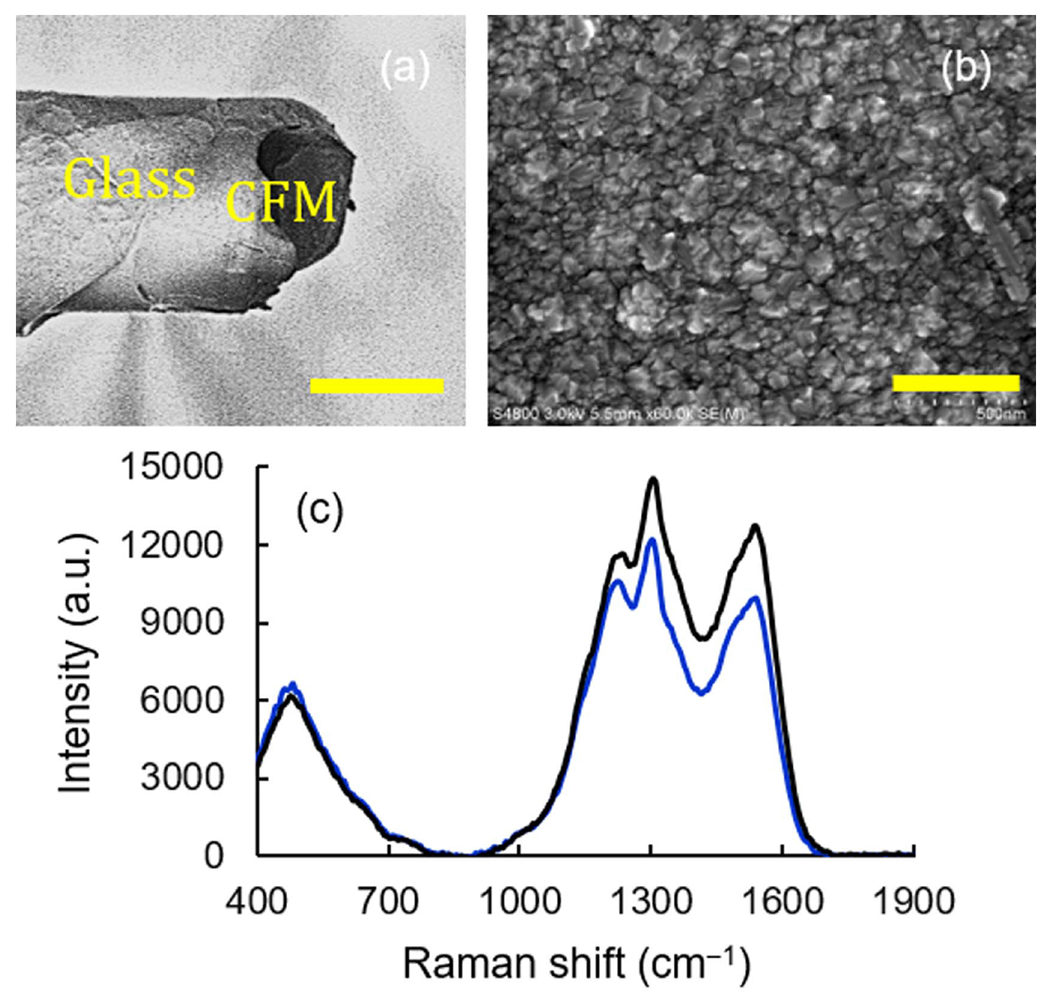
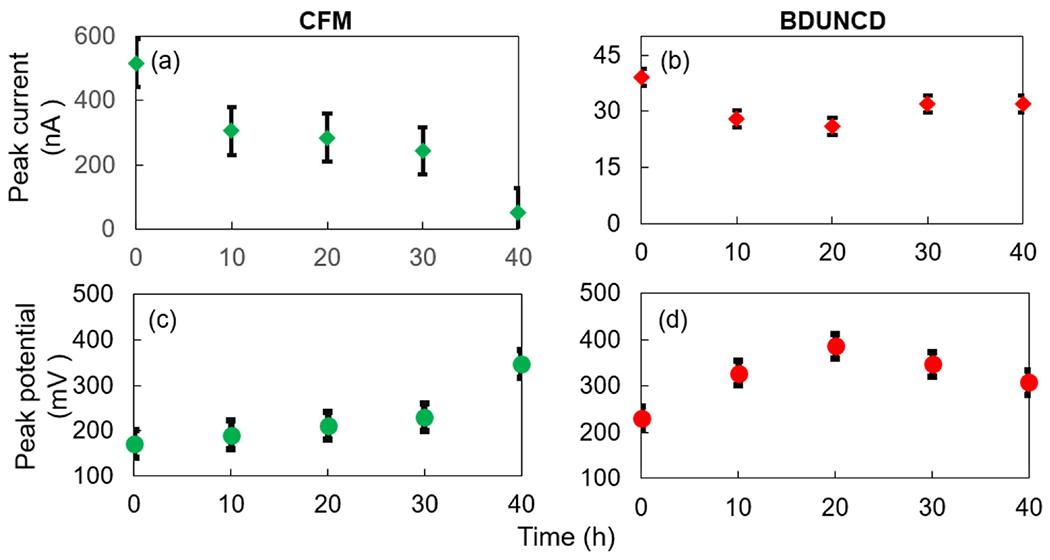
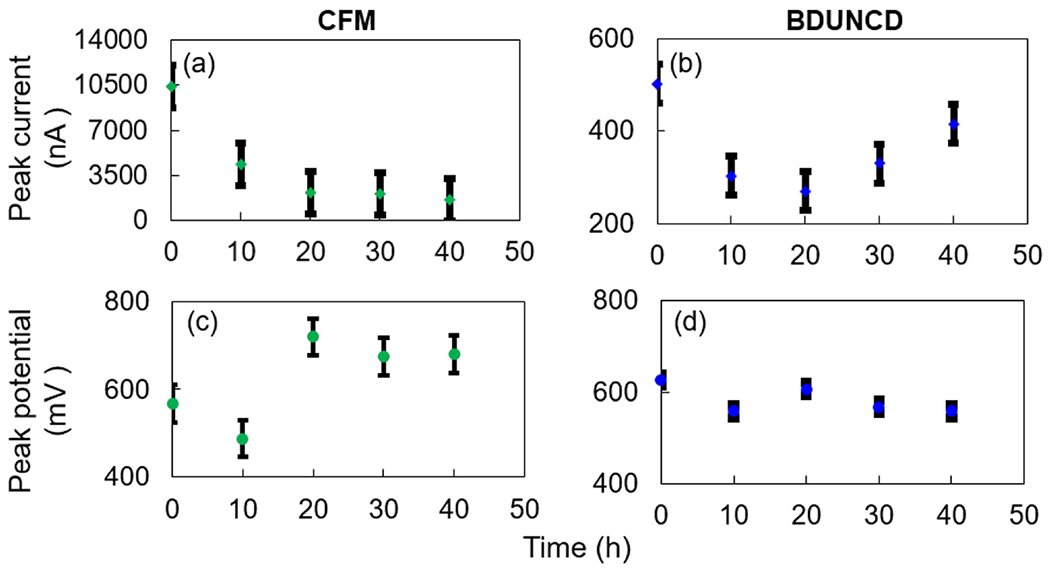
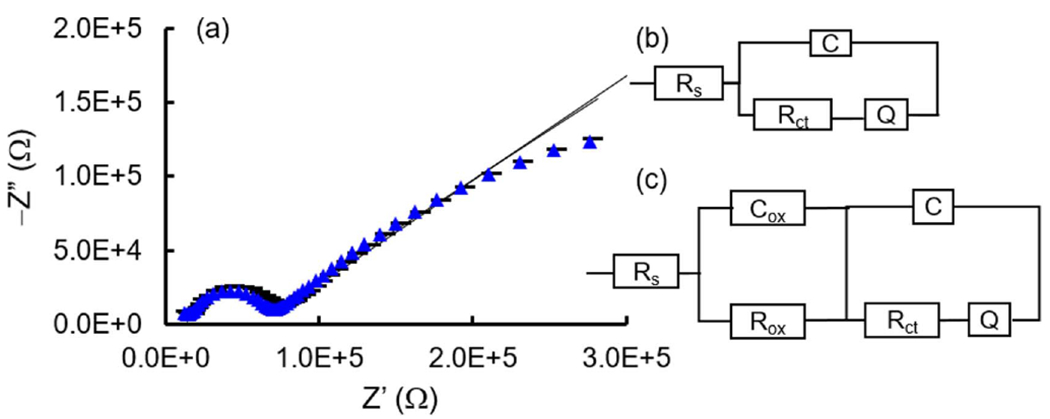
Chronic dopamine (DA) monitoring is a critical enabling technology to identify the neural basis of human behavior. Carbon fiber microelectrodes (CFM), the current gold standard electrode for in vivo fast scan cyclic voltammetry (FSCV), rapidly loses sensitivity due to surface fouling during chronic neural testing. Periodic voltage excursions at elevated anodic potentials regenerate fouled CFM surfaces but they also chemically degrade the CFM surfaces. Here, we compare the dimensional stability of 150 μm boron-doped ultrananocrystalline diamond (BDUNCD) microelectrodes in 1X PBS during 'electrochemical cleaning' with a similar-sized CFM. Scanning electron microscopy and Raman spectroscopy confirm the exceptional dimensional stability of BDUNCD after 40 h of FSCV cycling (~8 million cycles). The fitting of electrochemical impedance spectroscopy data to an appropriate circuit model shows a 2x increase in charge transfer resistance and an additional RC element, which suggests oxidation of BDUNCD electrode surface. This could have likely increased the DA oxidation potential by ~34% to +308 mV. A 2x increase in BDUNCD grain capacitance and a negligible change in grain boundary impedance suggests regeneration of grains and the exposure of new grain boundaries, respectively. Overall, DA voltammogram signals were reduced by only ~20%. In contrast, the CFM is completely etched with a ~90% reduction in the DA signal using the same cleaning conditions. Thus, BDUNCD provides a robust electrode surface that is amenable to repeated and aggressive cleaning which could be used for chronic DA sensing.

Keywords: carbon fiber; diamond; dopamine; microelectrode; nanocrystalline.


Conflict of interest statement

Conflict of interest The authors declare no competing financial interest.

Figures

Figure 1.
Figure 1.
SEM images of (a) a cylindrical CFM (30 μm diameter X 150 μm long), (b) one of the chips showing the nine individually addressable BDUNCD microelectrodes in 3 × 3 array format. (c) An individual 150 μm BDUNCD microelectrode, (d) BDUNCD surface morphology. The scale bars in (a)–(d) are 30, 200, 50 and 0.5 microns, respectively.
Figure 2.
Figure 2.
Cyclic voltammograms of (a) CFM (green curve) and (b) 150 μm BDUNCD (blue curve) microelectrodes in 100 μM DA prepared in 1X PBS buffer solution. Background voltammograms (black curves) are taken in 1X PBS buffer. Scan rate is 10 V s−1. The arrows represent the scan direction, i.e. starting at −0.2 V and scanning forward to +0.8 V and back to −0.2 V.
Figure 3.
Figure 3.
Cyclic voltammograms of CFM (a), (c) and BDUNCD (b), (d) microelectrodes in 100 μM DA (a), (b) and 1X PBS (c), (d) at various electrochemical cleaning times (brown solid curve—0 h, purple dashed dot—10 h, green long dashed—20 h, blue short dashed—30 h and black dot dashed—40 h). Scan rate is 10 V s−1.
Figure 4.
Figure 4.
Effect of 40 h of electrochemical cleaning in 1X PBS buffer. SEM images of (a), (b) completely etched-away CFM and BDUNCD microelectrodes. The cleaning was performed by cycling between−0.6 and +1.4 V, 400 V s−1, 60 Hz. The scale bars are 30 and 0.5 microns. (c) Raman spectra of BDUNCD before (black curve) and after (blue curve) cleaning.
Figure 5.
Figure 5.
The anodic peak current and potential values of CFM (a), (c) and BDUNCD (b), (d) microelectrodes in 100 μM DA, respectively at various cleaning times (0–40 h). Scan rate is 10 V s−1. T-test was performed with two different scan rate data for anodic peak current and peak voltage values with results p < 0.05 for confidence interval 95%.
Figure 6.
Figure 6.
The anodic peak current and potential values of CFM (a), (c) and BDUNCD (b), (d) microelectrodes in 100 μM DA, respectively at various cleaning times (0–40 h). Scan rate is 400 V s−1. T-test was performed with two different scan rate data for anodic peak current and peak voltage values with results p < 0.05 for confidence interval 95%.
Figure 7.
Figure 7.
(a) Nyquist plot of BDUNCD microelectrode before (blue triangle curve) and after (black dashed curve) 40 h electrochemical cleaning. The solid curves are fitted to experimental data. The electrolyte is 5 mM Fe(CN)63−/4− in 1 M KCl. 10 mV amplitude, 0.1 Hz–100 KHz. (b), (c) The equivalent circuits fitted to experimental EIS data collected before and after the cleaning.

References

    1. Eccles JC 1982. Ann. Rev. Neurosci 5 325–33 - PubMed
    1. Eccles JC 1990. J. Neurosci 10 3769–81 - PMC - PubMed
    1. Swanson CJ, Bures M, Johnson MP, Linden AM, Monn JAand Schoepp DD 2005. Nat. Rev. Drug Discov 4 131–44 - PubMed
    1. Clark JJ et al. 2010. Nat. Methods 7 126–9 - PMC - PubMed
    1. Meurs A, Clinckers R, Ebinger G, Michotte Y and Smolders I 2008. Epilepsy Res. 78 50–9 - PubMed

LinkOut - more resources