. 2020 Apr 24:10:494.
doi: 10.3389/fonc.2020.00494. eCollection 2020.

The Intratumoral Heterogeneity Reflects the Intertumoral Subtypes of Glioblastoma Multiforme: A Regional Immunohistochemistry Analysis

Affiliations

The Intratumoral Heterogeneity Reflects the Intertumoral Subtypes of Glioblastoma Multiforme: A Regional Immunohistochemistry Analysis

Natalie Bergmann et al. Front Oncol. .

Abstract

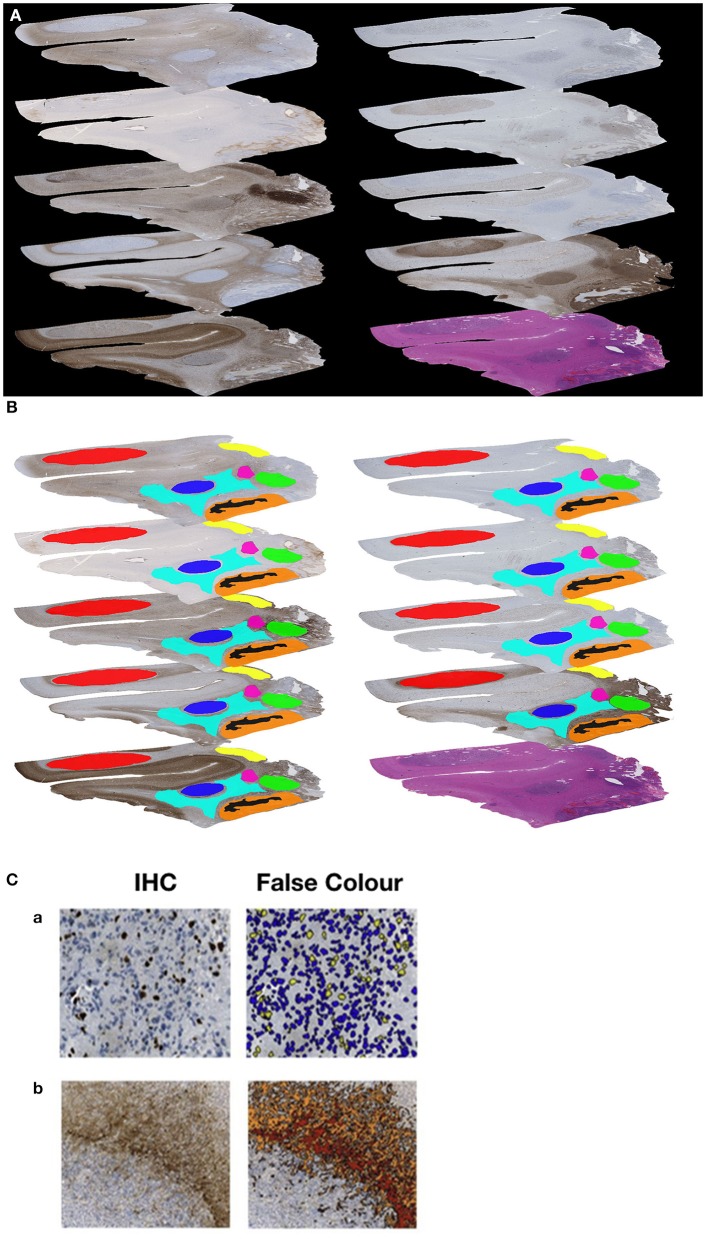
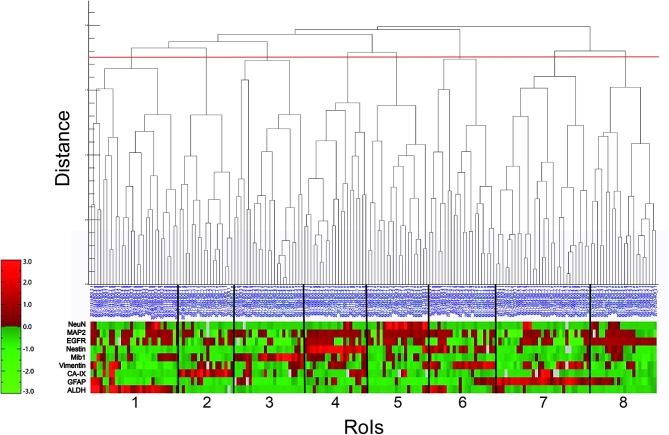
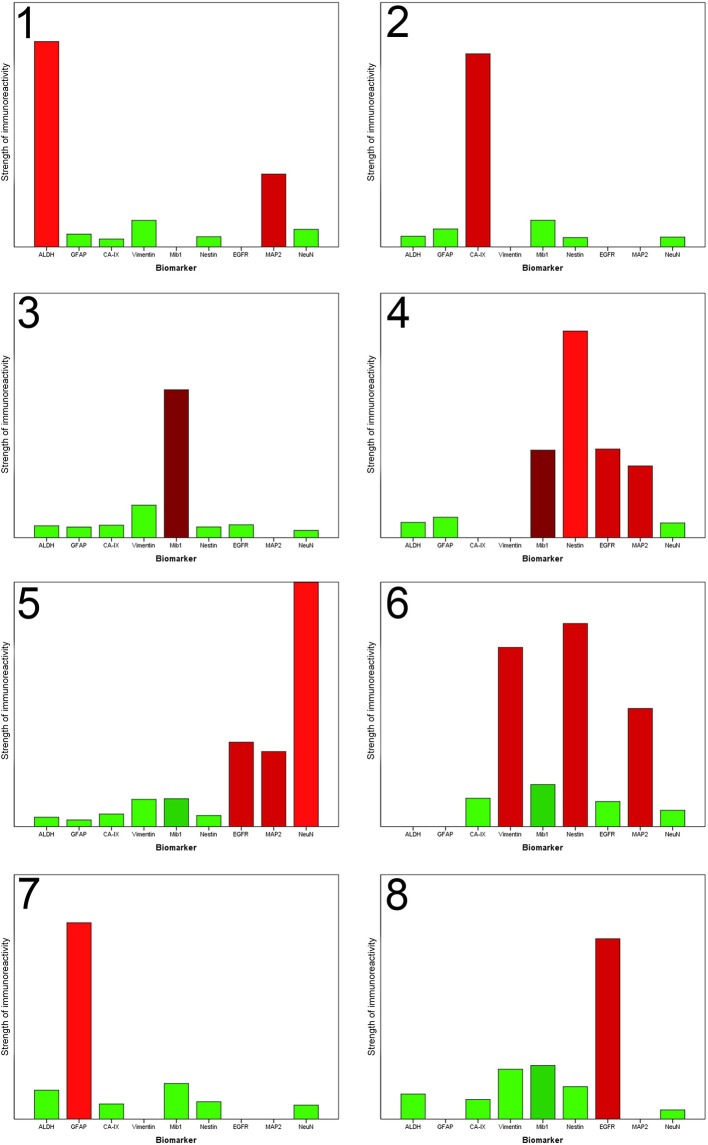
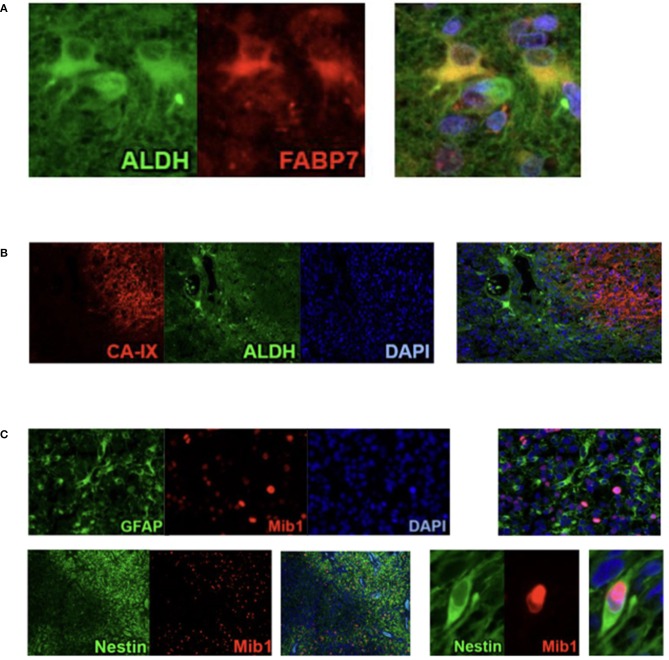
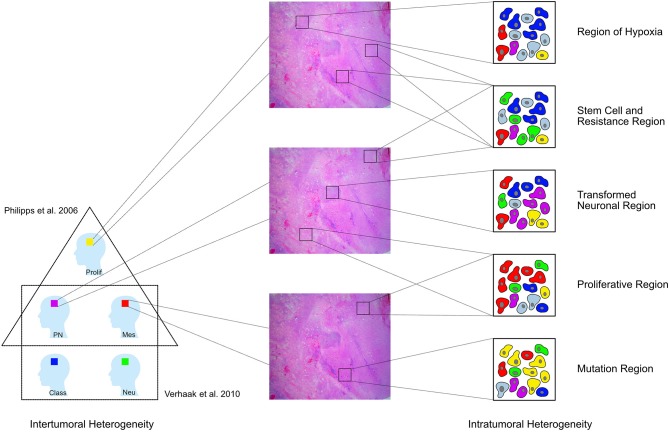
Glioblastoma multiforme (GBM) is the most frequent and aggressive primary brain tumor in adults. Despite extensive therapy the prognosis for GBM patients remains poor and the extraordinary therapy resistance has been attributed to intertumoral heterogeneity of glioblastoma. Different prognostic relevant GBM tumor subtypes have been identified based on their molecular profile. This approach, however, neglects the heterogeneity within individual tumors, that is, the intratumoral heterogeneity. Here, we detected the regional immunoreactivity by immunohistochemistry and immunofluorescence using nine different markers on resected GBM specimens (IDH wildtype, WHO grade IV). We found repetitive expression profiles, that could be classified into clusters. These clusters could then be assigned to five pathophysiologically relevant groups that reflect the previously described subclasses of GBM, including mesenchymal, classical, and proneural subtype. Our data indicate the presence of tumor differentiations and tumor subclasses that occur within individual tumors, and might therefore contribute to develop adapted, individual-based therapies.

Keywords: glioblastoma; histological architecture; histological subtypes; intertumoral heterogeneity; intratumoral heterogeneity.


Figures

Figure 1
Figure 1
(A) Example of a sequence of 10 sections (nine immunohistochemical stained slides and one H&E slide). (B) Example of the manually generated RoIs on each of the nine immunohistochemically stained slides of the same Glioblastoma. (C) Example for immunohistochemical (IHC) stain and automated image analysis (False Color) for MiB-1 (a) and GFAP (b).
Figure 2
Figure 2
Hierarchical cluster analysis (lin_corr_norm_a3; linkage = 1). The X-axis lists the 186 RoIs with their blue identification number. The Y-axis represents the distance of item-splitting. When setting the cutoff point at 1.75 (red line), 8 clusters appear (numbered from 1 to 8). The red-green bar illustrates the immunoreactivitiy profile of each RoI with regard to the nine biomarkers (ALDH, GFAP, CA-IX, Vimentin, Mib1, Nestin, EGFR, MAP2, and NeuN). It is a relative color scale. Small values are shown in green and high values in red. Gray blocks indicate data gaps stemming from material damage during staining procedure.
Figure 3
Figure 3
Each column chart demonstrates the homogenized representative marker profile of each newly detected cluster. The X-axis shows the nine biomarkers. The Y-axis specifies the strength of immunoreactivity. The column of NeuN in Cluster 5 is artificially shortened to obtain a better overview. A missing column indicates that the immunoreactivitiy of the biomarker in this special cluster is highly variable, that no unification is possible and the specific biomarker does not contribute to the characterization of this cluster. The coloring corresponds to the preceding illustration. Each column is colored with the in absolute terms (taking all RoIs of one cluster into account) dominant color.
Figure 4
Figure 4
Results from Co-Immunofluorescence. (A) ALDH1 (green), FABP7 (red), and fusion demonstrating the stem cell characteristics of ALDH1 immunoreactive tumor cells in Stem Cell Region (ASReg, cluster 1). (B) Hypoxia marker CA-IX (red), ALDH1 (green), DAPI (blue), and fusion showing ALDH1 positive tumor cells located next to hypoxic regions (HReg, cluster 2). (C) Upper panel: GFAP (green), Mib1 (red), DAPI, and fusion demonstrating that GFAP-positive cells are very rarely proliferating; lower panel: Nestin (green), Mib1 (red) and fusion showing high percentage of Nestin-positive cells is proliferating.
Figure 5
Figure 5
GBM have been divided into different tumoral subtypes on the basis of their molecular characteristics [Phillips et al. (3) distinguished three types proneural (PN), proliferative (Prolif), and mesenchymal (Mes); Verhaak et al. (4) classified them into four groups neural (Neu), proneural (PN), classical (Class), and mesenchymal (Mes)]. In addition to this intertumoral heterogeneity, the tumor tissue removed from one single patient also shows a heterogeneous architecture and cells with diverse features in different regions of the tumor. This study shows that the whole neoplasic tissue can be subdivided into eight clusters according to the respective immunoreactivity profile. These clusters can then be assigned to five larger pathophysiologically relevant groups [Regions of hypoxia (HReg), Stem cell and resistance regions, Tansformed neuronal regions (TNReg), Proliferative regions (PReg), and Mutation regions (MReg)].

References

    1. Li K, Lu D, Guo Y, Wang C, Liu X, Liu Y, et al. . Trends and patterns of incidence of diffuse glioma in adults in the United States, 1973-2014. Cancer Med. (2018) 7:5281–90. 10.1002/cam4.1757 - DOI - PMC - PubMed
    1. Stupp R, Mason WP, van den Bent MJ, Weller M, Fisher B, Taphoorn MJ, et al. . Radiotherapy plus concomitant and adjuvant temozolomide for glioblastoma. N Engl J Med. (2005) 352:987–96. 10.1056/NEJMoa043330 - DOI - PubMed
    1. Phillips HS, Kharbanda S, Chen R, Forrest WF, Soriano RH, Wu TD, et al. . Molecular subclasses of high-grade glioma predict prognosis, delineate a pattern of disease progression, and resemble stages in neurogenesis. Cancer Cell. (2006) 9:157–73. 10.1016/j.ccr.2006.02.019 - DOI - PubMed
    1. Verhaak RG, Hoadley KA, Purdom E, Wang V, Qi Y, Wilkerson MD, et al. . Integrated genomic analysis identifies clinically relevant subtypes of glioblastoma characterized by abnormalities in PDGFRA, IDH1, EGFR, and NF1. Cancer Cell. (2010) 17:98–110. 10.1016/j.ccr.2009.12.020 - DOI - PMC - PubMed
    1. Brennan CW, Verhaak RG, McKenna A, Campos B, Noushmehr H, Salama SR, et al. . The somatic genomic landscape of glioblastoma. Cell. (2013) 155:462–77. 10.1016/j.cell.2013.09.034 - DOI - PMC - PubMed

LinkOut - more resources