. 2020 Apr 24:10:147.
doi: 10.3389/fcimb.2020.00147. eCollection 2020.

Calibration of an Upconverting Phosphor-Based Quantitative Immunochromatographic Assay for Detecting Yersinia pestis, Brucella spp., and Bacillus anthracis Spores

Affiliations

Calibration of an Upconverting Phosphor-Based Quantitative Immunochromatographic Assay for Detecting Yersinia pestis, Brucella spp., and Bacillus anthracis Spores

Pingping Zhang et al. Front Cell Infect Microbiol. .

Abstract

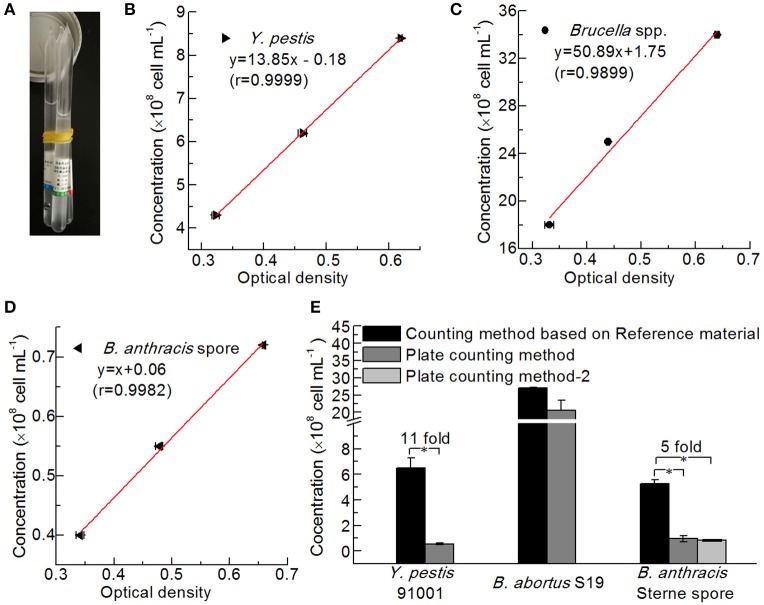
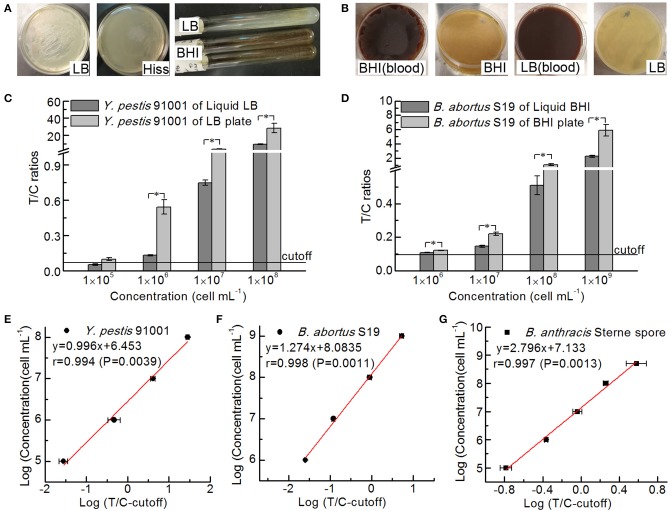
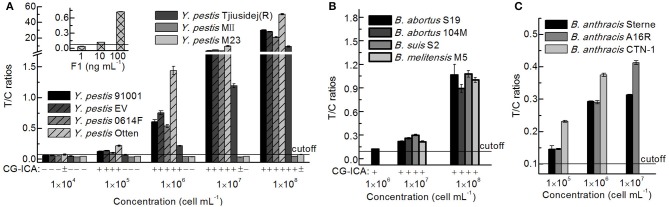
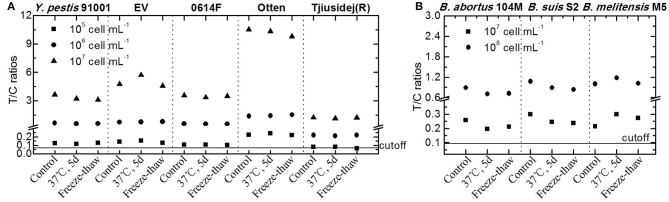
Yersinia pestis, Brucella spp., and Bacillus anthracis are pathogens that can cause infectious zoonotic diseases with high mortality rates. An upconverting phosphor-based quantitative immunochromatographic (UPT-LF) assay, a point-of-care testing method suitable for resource-limited areas, was calibrated to quantitatively detect pathogenic bacteria. The bacterial purity or activity were ensured via staining methods and growth curves, respectively. Growth assays showed that the classic plate-counting method underestimated bacterial numbers compared with the bacterial counting method recommended by the reference material of the National Institutes for Food and Drug Control, China. The detection results of the UPT-LF assay differed significantly between the bacterial cultures in liquid and solid media and between different strains. Accelerated stability assessments and freeze-thaw experiments showed that the stability of the corresponding antigens played an important role in calibrating the UPT-LF assay. In this study, a new calibration system was developed for quantitative immunochromatography for detecting pathogenic bacteria. The results demonstrated the necessity of calibration for standardizing point-of-care testing methods.

Keywords: biodefense; calibration; immunochromatographic assay; pathogen; quantitative detection.


Figures

Figure 1
Figure 1
The criteria program and an illustration of the UPT-LF assay. (A) Program for the UPT-LF assay criteria. (B) The photograph of UPT biosensor scanning of a strip. (C) The detection result shows the concentration of bacteria. The signal peak on the left is derived from the control band, and that on the right is derived from the test band. (D) Information stored by the UPT-LF biosensor including time, sample ID, detection target, concentration of the target, the value of the signal for the test band and control band, T/C ratio, as well as the parameters for standard curves (y = Ax + B, the logarithm of T/C-cutoff as x and the logarithm of concentration as y) for quantitation of the concentration of target bacteria, including the cut-off, A and B. Some information, with the exception of the detection result, was recorded in radiofrequency identification devices (RFID) for each commercial strip, and this can be revised through a new record after calibration.
Figure 2
Figure 2
Staining of the spores and vegetative forms of B. anthracis. B. anthracis Sterne (A) and B. cereus 41 (B) spores stained with malachite green. (C) Vegetative form of B. anthracis Sterne among spores stained with crystal violet-iodine. (D) Vegetative form of B. subtilis stained with crystal violet-iodine. (E) B. subtilis spores stained with crystal violet-iodine.
Figure 3
Figure 3
Preincubation times and growth curves for Y. pestis 91001 (A,C) and B. abortus S19 (B,D) in the LB and BHI media.
Figure 4
Figure 4
Optical densities of Y. pestis 91001(A) and B. abortus S19 (B) in LB or BHI medium and normal saline. Asterisks denote significant differences in OD value (t-test; p < 0.05; n = 3).
Figure 5
Figure 5
Comparison of different bacterial counting methods. (A) Reference Material for Bacterial Content of the Plague Vaccine, Brucellosis Vaccine, and Anthrax Vaccine from NIFDC. Standard curves of the reference material for counting Y. pestis (B), Brucella spp. (C), and B. anthracis (D) were plotted based on optical density. (E) Comparison of the bacterial concentrations determined by the reference material method and the plate-counting method (Hiss agar plate containing 5% goat blood for Y. pestis 91001, BHI plate containing 5% goat blood for B. abortus S19, and LB plate and LB plate containing 5% goat blood for B. anthracis Stern spores). Asterisks denote significant differences in bacterial concentrations determined by the counting methods (t-test; p < 0.05; n = 3).
Figure 6
Figure 6
Differences in the UPT-LF detection results for Y. pestis 91001, B. abortus S19, and B. anthracis Sterne cultured in liquid and solid media. The growth conditions for Y. pestis (A) and B. abortus (B) differed on different solid media. UPT-LF detection results for Y. pestis differed significantly between liquid LB broth and LB plates (C) and for B. abortus S19 between the liquid BHI medium and BHI plates (D). All bacterial concentrations were determined using the NIFDC reference material, and the standard curves for the UPT-LF assay for quantifying Y. pestis 91001 (E), B. abortus S19 (F), and B. anthracis Sterne spores (G) were plotted after calibration. Asterisks denote significant differences in UPT-LF results for bacterial culture of liquid and solid medium (t-test; p < 0.05; n = 3).
Figure 7
Figure 7
Detection results for different Y. pestis, Brucella spp., and B. anthracis strains. (A) Detection results for Y. pestis stains and the F1 antigen via a UPT-LF assay and CG-ICA. (B) Detection results for Brucella spp. strains via UPT-LF and CG-ICA methods. (C) Detection results for B. anthracis strains via a UPT-LF assay.
Figure 8
Figure 8
Detection results for the UPT-LF assay for Y. pestis (A) and Brucella spp. strains (B) in accelerated stability assessments.

Similar articles

Cited by

References

    1. Antwerpen M. H., Zimmermann P., Bewley K., Frangoulidis D., Meyer H. (2008). Real-time PCR system targeting a chromosomal marker specific for Bacillus anthracis. Mol. Cell. Probes. 22, 313–315. 10.1016/j.mcp.2008.06.001 - DOI - PubMed
    1. Bentahir M., Ambroise J., Delcorps C., Pilo P., Gala J. L. (2018). Sensitive and specific recombinase polymerase amplification assays for fast screening, detection, and identification of Bacillus anthracis in a field setting. Appl. Environ. Microbiol. 84, e00506–e00518. 10.1128/aem.00506-18 - DOI - PMC - PubMed
    1. Breed R. S., Dotterrer W. D. (1916). The number of colonies allowable on satisfactory agar plates. J. Bacteriol. 1, 321–331. - PMC - PubMed
    1. Burrows T. W., Bacon G. A. (1958). The effects of loss of different virulence determinants on the virulence and immunogenicity of strains of Pasteurella pestis. Br. J. Exp. Pathol. 39, 278–291. - PMC - PubMed
    1. Dalgaard P., Ross T., Kamperman L., Neumeyer K., Mcmeekin T. A. (1994). Estimation of bacterial growth rates from turbidimetric and viable count data. Int. J. Food Microbiol. 23, 391–404. 10.1016/0168-1605(94)90165-1 - DOI - PubMed

Publication types