

Exploring the Use of Compound-Induced Transcriptomic Data Generated From Cell Lines to Predict Compound Activity Toward Molecular Targets
- PMID: 32391323
- PMCID: PMC7191531
- DOI: 10.3389/fchem.2020.00296
Exploring the Use of Compound-Induced Transcriptomic Data Generated From Cell Lines to Predict Compound Activity Toward Molecular Targets
Abstract
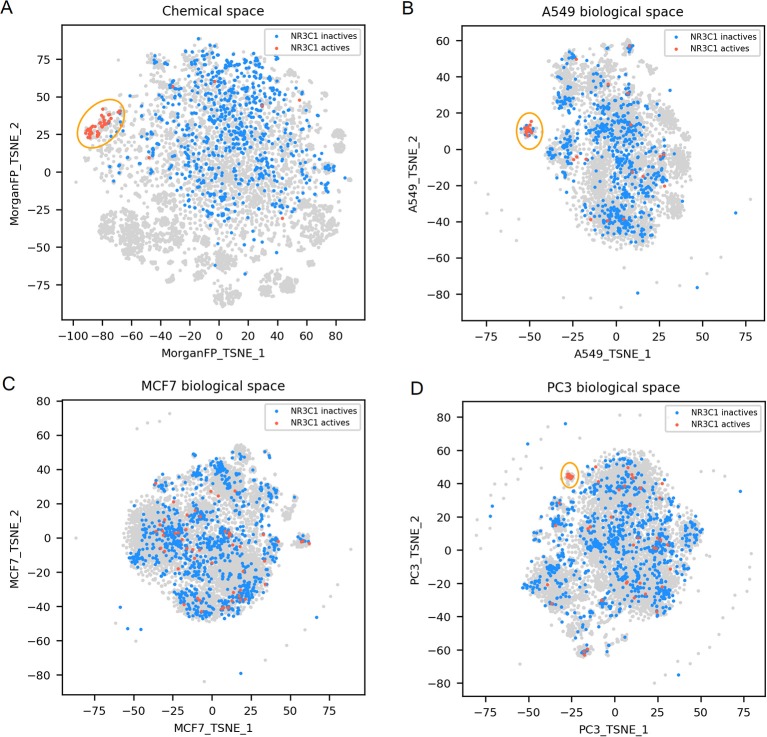
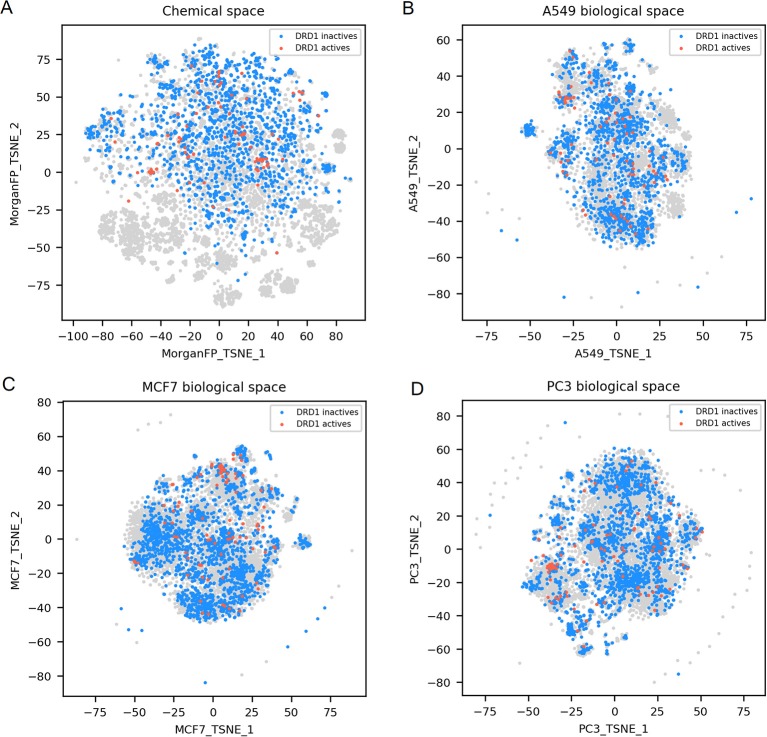
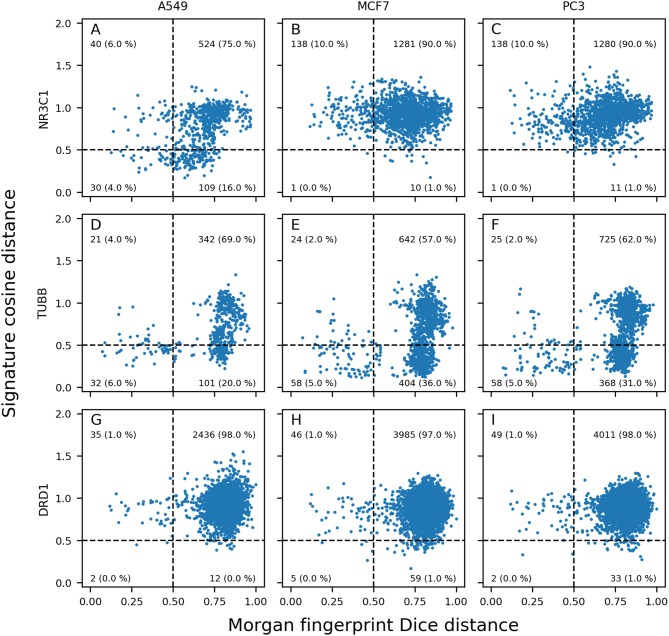
Pharmaceutical or phytopharmaceutical molecules rely on the interaction with one or more specific molecular targets to induce their anticipated biological responses. Nonetheless, these compounds are also prone to interact with many other non-intended biological targets, also known as off-targets. Unfortunately, off-target identification is difficult and expensive. Consequently, QSAR models predicting the activity on a target have gained importance in drug discovery or in the de-risking of chemicals. However, a restricted number of targets are well characterized and hold enough data to build such in silico models. A good alternative to individual target evaluations is to use integrative evaluations such as transcriptomics obtained from compound-induced gene expression measurements derived from cell cultures. The advantage of these particular experiments is to capture the consequences of the interaction of compounds on many possible molecular targets and biological pathways, without having any constraints concerning the chemical space. In this work, we assessed the value of a large public dataset of compound-induced transcriptomic data, to predict compound activity on a selection of 69 molecular targets. We compared such descriptors with other QSAR descriptors, namely the Morgan fingerprints (similar to extended-connectivity fingerprints). Depending on the target, active compounds could show similar signatures in one or multiple cell lines, whether these active compounds shared similar or different chemical structures. Random forest models using gene expression signatures were able to perform similarly or better than counterpart models built with Morgan fingerprints for 25% of the target prediction tasks. These performances occurred mostly using signatures produced in cell lines showing similar signatures for active compounds toward the considered target. We show that compound-induced transcriptomic data could represent a great opportunity for target prediction, allowing to overcome the chemical space limitation of QSAR models.
Keywords: QSAR; cellular context; compound-induced transcriptomic data; machine learning; target prediction.
Copyright © 2020 Baillif, Wichard, Méndez-Lucio and Rouquié.
Figures


Similar articles
-
Toxicity prediction using target, interactome, and pathway profiles as descriptors.Toxicol Lett. 2023 May 15;381:20-26. doi: 10.1016/j.toxlet.2023.04.005. Epub 2023 Apr 13. Toxicol Lett. 2023. PMID: 37061207
-
Targeting HIV/HCV Coinfection Using a Machine Learning-Based Multiple Quantitative Structure-Activity Relationships (Multiple QSAR) Method.Int J Mol Sci. 2019 Jul 22;20(14):3572. doi: 10.3390/ijms20143572. Int J Mol Sci. 2019. PMID: 31336592 Free PMC article.
-
A new ChEMBL dataset for the similarity-based target fishing engine FastTargetPred: Annotation of an exhaustive list of linear tetrapeptides.Data Brief. 2022 Apr 11;42:108159. doi: 10.1016/j.dib.2022.108159. eCollection 2022 Jun. Data Brief. 2022. PMID: 35496477 Free PMC article.
-
Multi-Target QSAR Approaches for Modeling Protein Inhibitors. Simultaneous Prediction of Activities Against Biomacromolecules Present in Gram-Negative Bacteria.Curr Top Med Chem. 2015;15(18):1801-13. doi: 10.2174/1568026615666150506144814. Curr Top Med Chem. 2015. PMID: 25961517 Review.
-
Transfer and Multi-task Learning in QSAR Modeling: Advances and Challenges.Front Pharmacol. 2018 Feb 6;9:74. doi: 10.3389/fphar.2018.00074. eCollection 2018. Front Pharmacol. 2018. PMID: 29467659 Free PMC article. Review.
Cited by
-
Exploration of the DARTable Genome- a Resource Enabling Data-Driven NAMs for Developmental and Reproductive Toxicity Prediction.Front Toxicol. 2022 Jan 19;3:806311. doi: 10.3389/ftox.2021.806311. eCollection 2021. Front Toxicol. 2022. PMID: 35295108 Free PMC article.
-
Predicting molecular initiating events using chemical target annotations and gene expression.BioData Min. 2022 Mar 4;15(1):7. doi: 10.1186/s13040-022-00292-z. BioData Min. 2022. PMID: 35246223 Free PMC article.
-
Application of perturbation gene expression profiles in drug discovery-From mechanism of action to quantitative modelling.Front Syst Biol. 2023 Feb 9;3:1126044. doi: 10.3389/fsysb.2023.1126044. eCollection 2023. Front Syst Biol. 2023. PMID: 40809500 Free PMC article. Review.
-
Computational analyses of mechanism of action (MoA): data, methods and integration.RSC Chem Biol. 2021 Dec 22;3(2):170-200. doi: 10.1039/d1cb00069a. eCollection 2022 Feb 9. RSC Chem Biol. 2021. PMID: 35360890 Free PMC article. Review.
-
Protocol for predicting suppressors of cell-death pathways based on transcriptomic and vulnerability data.STAR Protoc. 2025 Jun 20;6(2):103855. doi: 10.1016/j.xpro.2025.103855. Epub 2025 May 29. STAR Protoc. 2025. PMID: 40449001 Free PMC article.
References
-
- Breiman L. (2001). Randomforest2001. Mach. Learn. 45, 5–32. 10.1017/CBO9781107415324.004 - DOI
LinkOut - more resources
Full Text Sources