

Modeling the trend of coronavirus disease 2019 and restoration of operational capability of metropolitan medical service in China: a machine learning and mathematical model-based analysis
- PMID: 32391439
- PMCID: PMC7200323
- DOI: 10.1186/s41256-020-00145-4
Modeling the trend of coronavirus disease 2019 and restoration of operational capability of metropolitan medical service in China: a machine learning and mathematical model-based analysis
Abstract
Background: To contain the outbreak of coronavirus disease 2019 (COVID-19) in China, many unprecedented intervention measures are adopted by the government. However, these measures may interfere in the normal medical service. We sought to model the trend of COVID-19 and estimate the restoration of operational capability of metropolitan medical service in China.
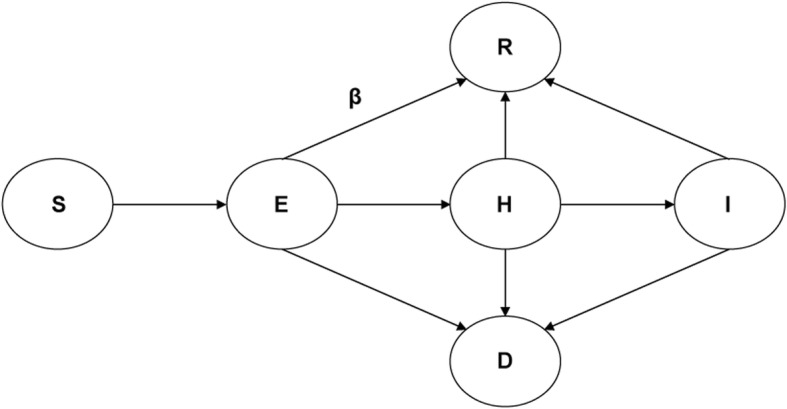
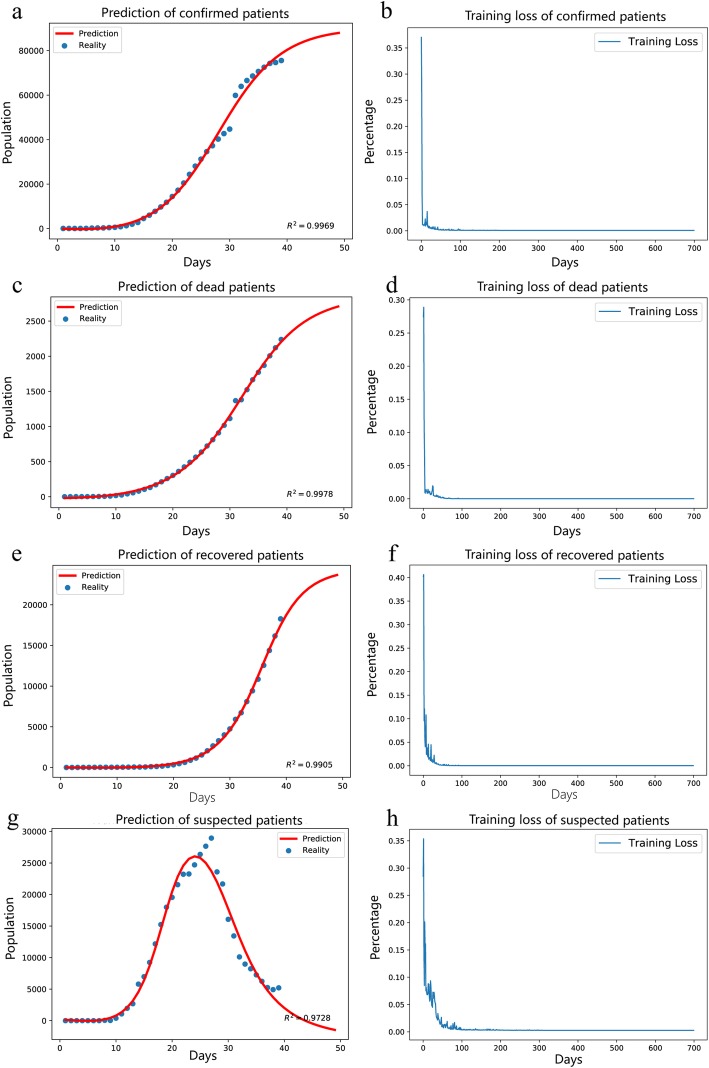
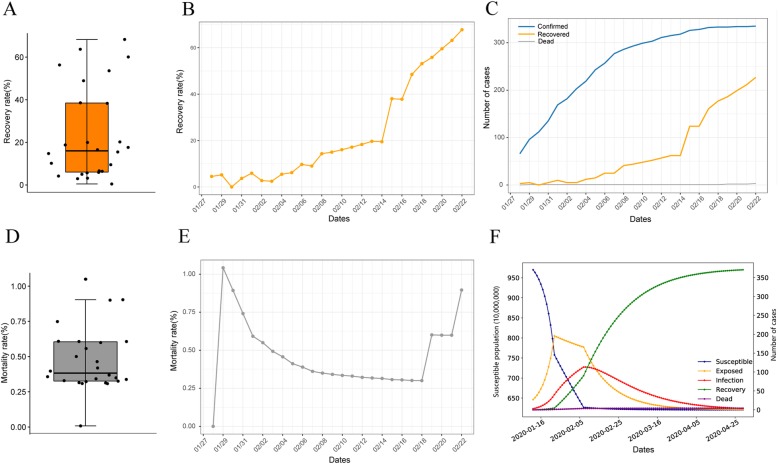
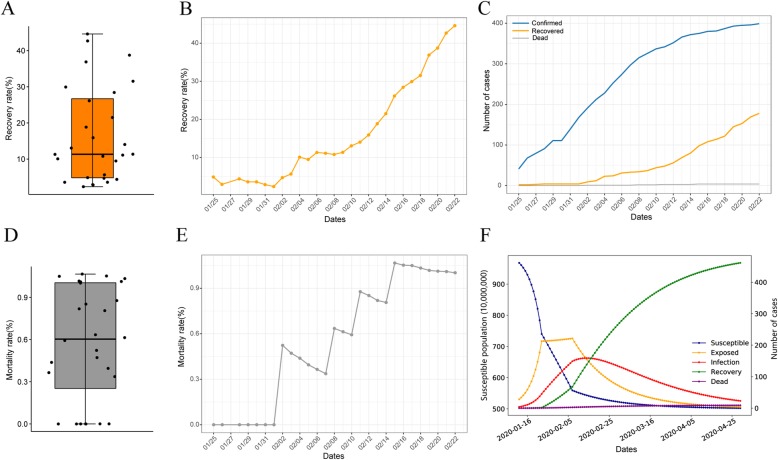
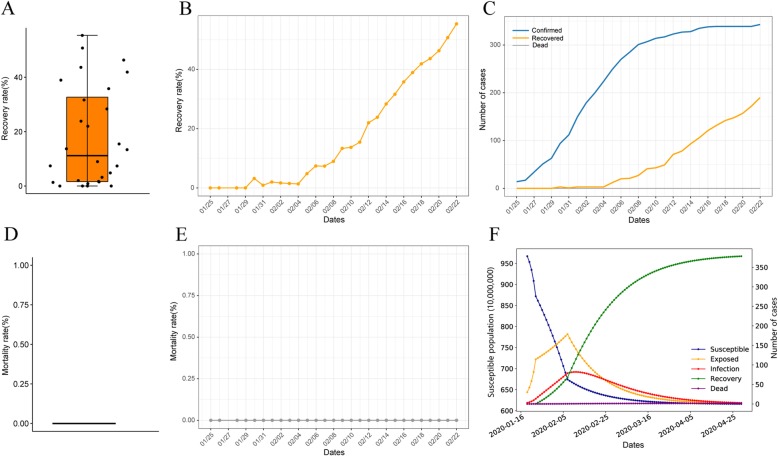
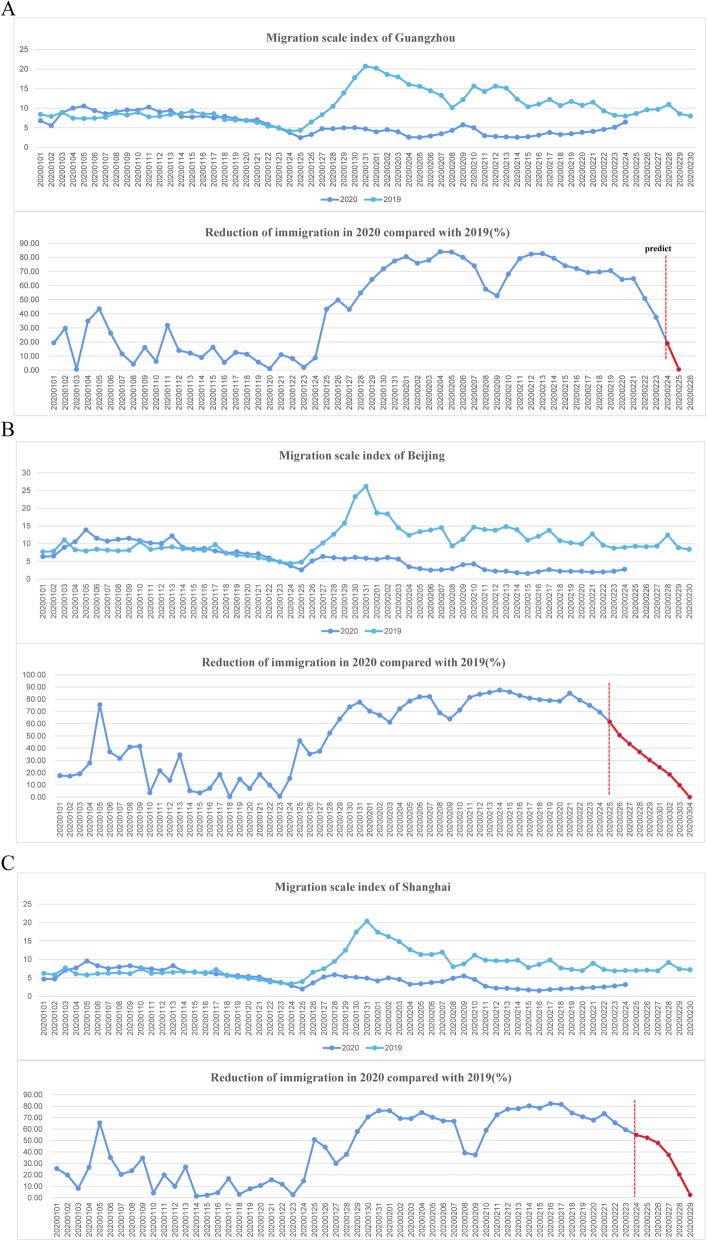
Methods: Real-time data of COVID-19 and population mobility data were extracted from open sources. SEIR (Susceptible, Exposed, Infectious, Recovered) and neural network models (NNs) were built to model disease trends in Wuhan, Beijing, Shanghai and Guangzhou. Combined with public transportation data, Autoregressive Integrated Moving Average (ARIMA) model was used to estimate the accumulated demands for nonlocal hospitalization during the epidemic period in Beijing, Shanghai and Guangzhou.
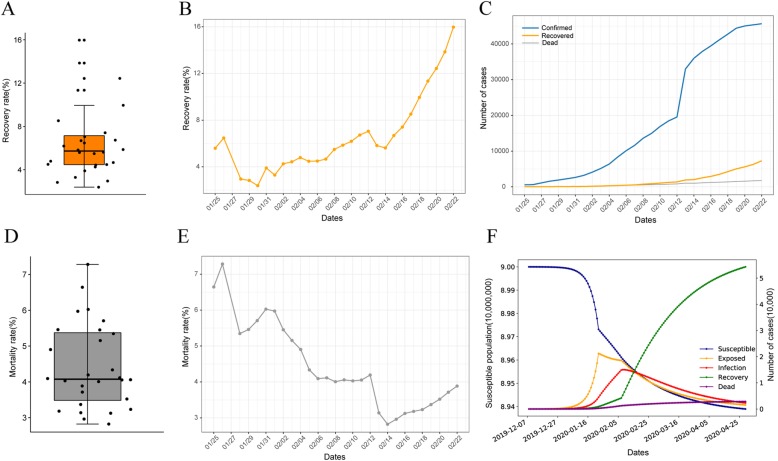
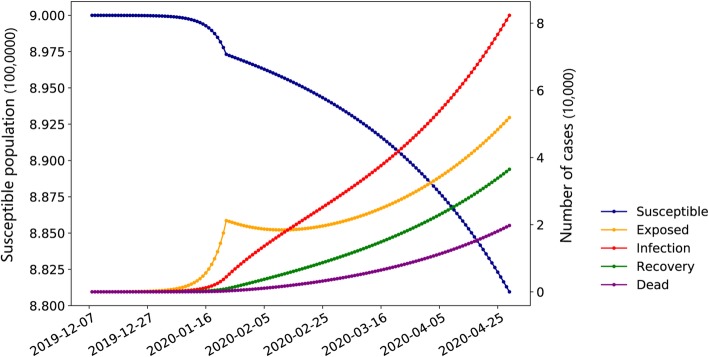
Results: The number of infected people and deaths would increase by 45% and 567% respectively, given that the government only has implemented traffic control in Wuhan without additional medical professionals. The epidemic of Wuhan (measured by cumulative confirmed cases) was predicted to reach turning point at the end of March and end in later April, 2020. The outbreak in Beijing, Shanghai and Guangzhou was predicted to end at the end of March and the medical service could be fully back to normal in middle of April. During the epidemic, the number of nonlocal inpatient hospitalizations decreased by 69.86%, 57.41% and 66.85% in Beijing, Shanghai and Guangzhou respectively. After the end of epidemic, medical centers located in these metropolises may face 58,799 (95% CI 48926-67,232) additional hospitalization needs in the first month.
Conclusion: The COVID-19 epidemic in China has been effectively contained and medical service across the country is expected to return to normal in April. However, the huge unmet medical needs for other diseases could result in massive migration of patients and their families, bringing tremendous challenges for medical service in major metropolis and disease control for the potential asymptomatic virus carrier.
© The Author(s) 2020.
Conflict of interest statement
Competing interestsThe authors declare that they have no competing interests.
Figures
References
-
- Notification from Wuhan Municipal Health Commission about cases of viral pneumonia of unknown cause. http://wjw.wuhan.gov.cn/front/web/showDetail/2020011109036. Accessed 26 Feb 2020.
-
- Institute of medical information, Chinese Academy of Medical Sciences. The dataset of nationwide designated hospitals and related fever clinics for novel coronavirus pneumonia (in Chinese). Data warehouse of National Population Health Science Data Center PHDA, 2020.CSTR:A0006.11.A0003.202001.000583.
-
- NHC.CHINA. 2018 National Report on the services, Quality and Safety in Medical Care System; 2018.
MeSH terms
LinkOut - more resources
Full Text Sources
Medical
Miscellaneous
