

Screening of healthcare workers for SARS-CoV-2 highlights the role of asymptomatic carriage in COVID-19 transmission
- PMID: 32392129
- PMCID: PMC7314537
- DOI: 10.7554/eLife.58728
Screening of healthcare workers for SARS-CoV-2 highlights the role of asymptomatic carriage in COVID-19 transmission
Abstract
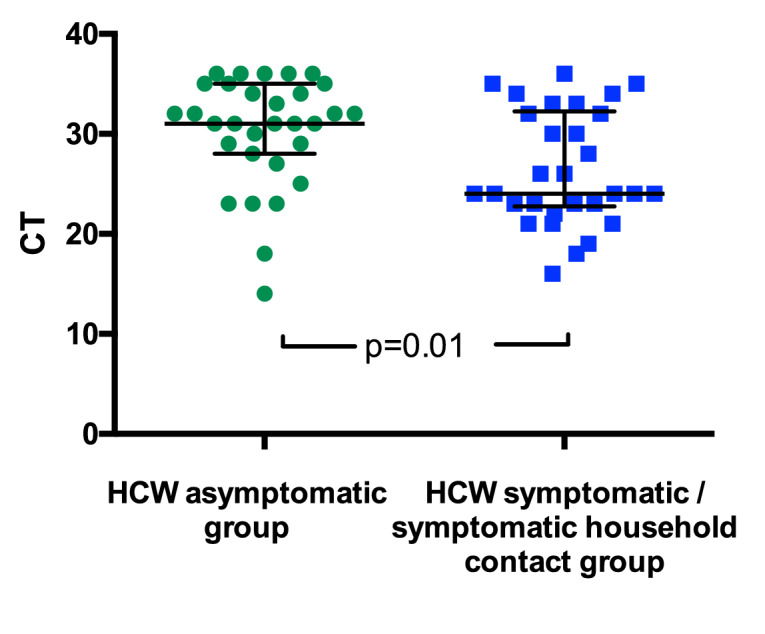
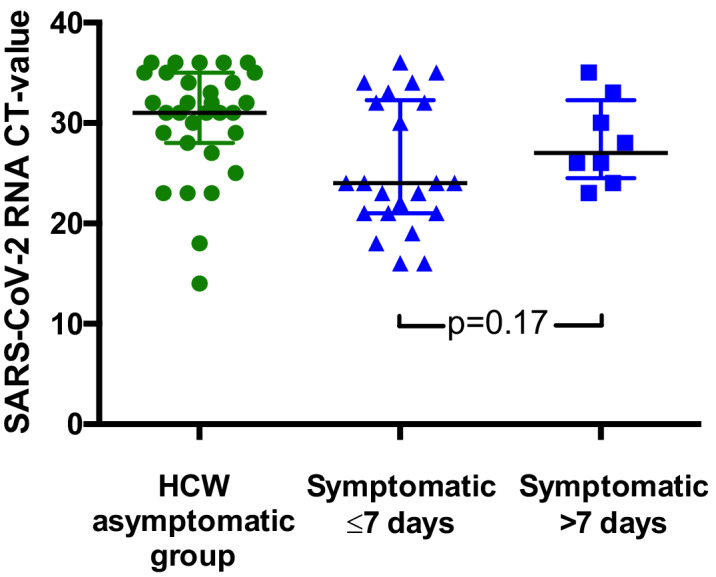
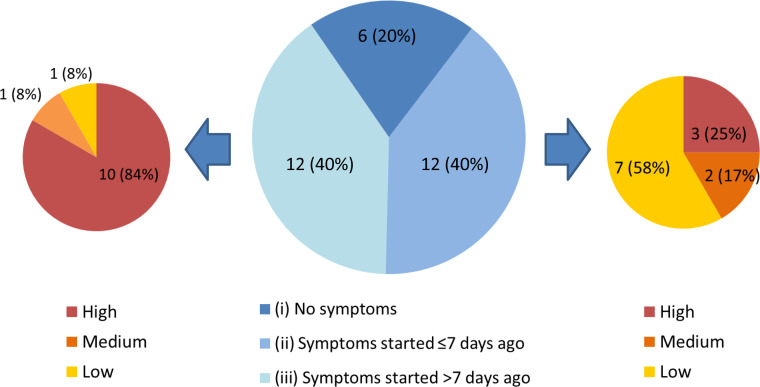
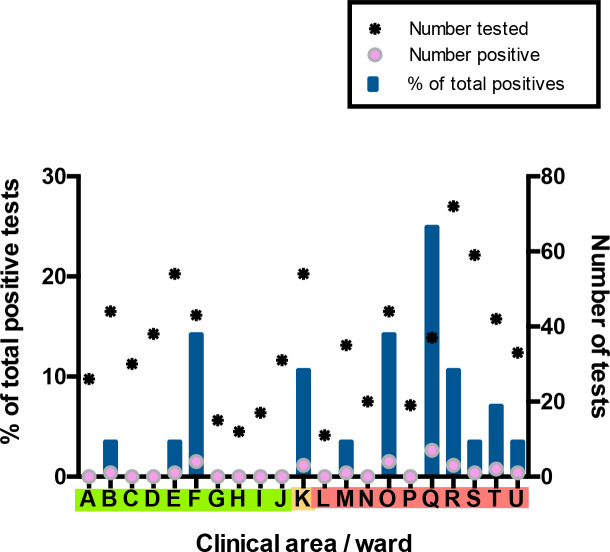
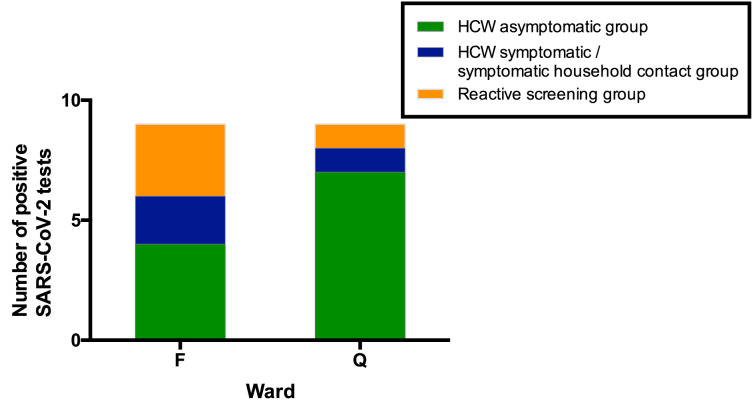
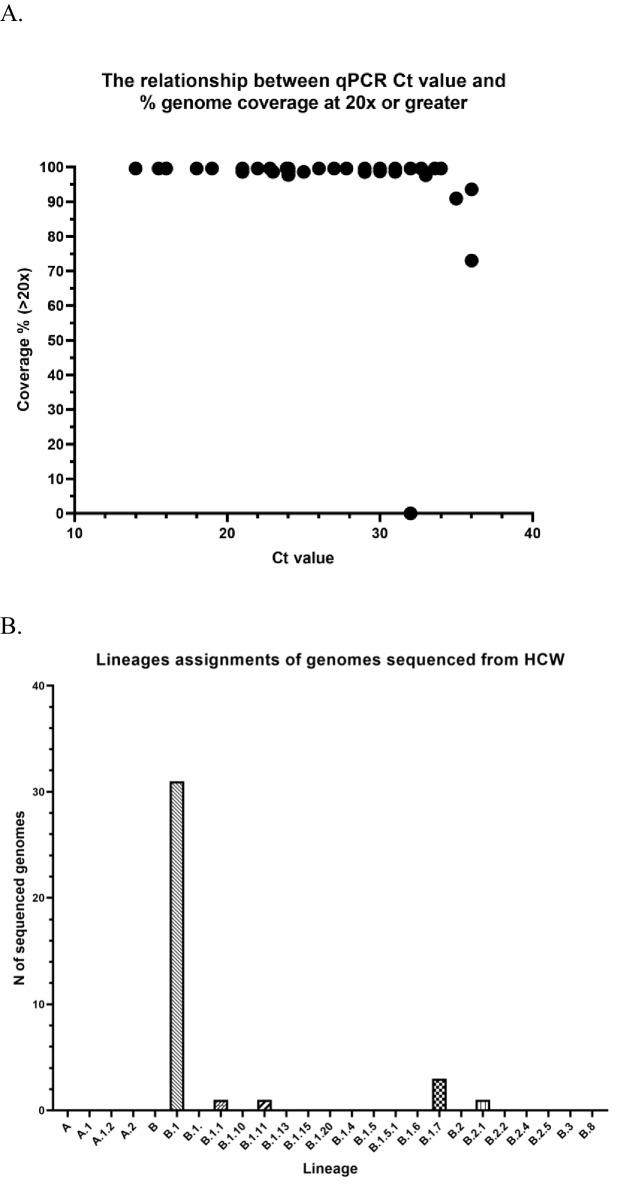
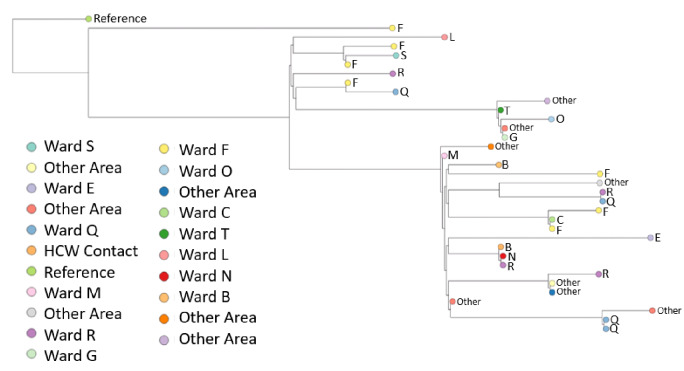
Significant differences exist in the availability of healthcare worker (HCW) SARS-CoV-2 testing between countries, and existing programmes focus on screening symptomatic rather than asymptomatic staff. Over a 3 week period (April 2020), 1032 asymptomatic HCWs were screened for SARS-CoV-2 in a large UK teaching hospital. Symptomatic staff and symptomatic household contacts were additionally tested. Real-time RT-PCR was used to detect viral RNA from a throat+nose self-swab. 3% of HCWs in the asymptomatic screening group tested positive for SARS-CoV-2. 17/30 (57%) were truly asymptomatic/pauci-symptomatic. 12/30 (40%) had experienced symptoms compatible with coronavirus disease 2019 (COVID-19)>7 days prior to testing, most self-isolating, returning well. Clusters of HCW infection were discovered on two independent wards. Viral genome sequencing showed that the majority of HCWs had the dominant lineage B∙1. Our data demonstrates the utility of comprehensive screening of HCWs with minimal or no symptoms. This approach will be critical for protecting patients and hospital staff.
Keywords: COVID-19; SARS-CoV-2; emerging pathogens; epidemiology; global health; human; human biology; infectious disease; medicine; occupational health; virology; virus.
Plain language summary
Patients admitted to NHS hospitals are now routinely screened for SARS-CoV-2 (the virus that causes COVID-19), and isolated from other patients if necessary. Yet healthcare workers, including frontline patient-facing staff such as doctors, nurses and physiotherapists, are only tested and excluded from work if they develop symptoms of the illness. However, there is emerging evidence that many people infected with SARS-CoV-2 never develop significant symptoms: these people will therefore be missed by ‘symptomatic-only’ testing. There is also important data showing that around half of all transmissions of SARS-CoV-2 happen before the infected individual even develops symptoms. This means that much broader testing programs are required to spot people when they are most infectious. Rivett, Sridhar, Sparkes, Routledge et al. set out to determine what proportion of healthcare workers was infected with SARS-CoV-2 while also feeling generally healthy at the time of testing. Over 1,000 staff members at a large UK hospital who felt they were well enough to work, and did not fit the government criteria for COVID-19 infection, were tested. Amongst these, 3% were positive for SARS-CoV-2. On closer questioning, around one in five reported no symptoms, two in five very mild symptoms that they had dismissed as inconsequential, and a further two in five reported COVID-19 symptoms that had stopped more than a week previously. In parallel, healthcare workers with symptoms of COVID-19 (and their household contacts) who were self-isolating were also tested, in order to allow those without the virus to quickly return to work and bolster a stretched workforce. Finally, the rates of infection were examined to probe how the virus could have spread through the hospital and among staff – and in particular, to understand whether rates of infection were greater among staff working in areas devoted to COVID-19 patients. Despite wearing appropriate personal protective equipment, healthcare workers in these areas were almost three times more likely to test positive than those working in areas without COVID-19 patients. However, it is not clear whether this genuinely reflects greater rates of patients passing the infection to staff. Staff may give the virus to each other, or even acquire it at home. Overall, this work implies that hospitals need to be vigilant and introduce broad screening programmes across their workforces. It will be vital to establish such approaches before ‘lockdown’ is fully lifted, so healthcare institutions are prepared for any second peak of infections.
© 2020, Rivett et al.
Conflict of interest statement
LR, SS, DS, MR, NJ, SF, JY, JP, WH, MF, LM, MC, SF, AS, JB, GW No competing interests declared, MT Reports grants from Academy of Medical Sciences and the Health Foundation, non-financial support from National Institute of Health Research, grants from Medical Research Council, grants from Global Challenges Research Fund, personal fees from Wellcome Sanger Institute, personal fees from University of Cambridge, personal fees from Oxford University Press, AC Reports grants from Cambridge Biomedical Research Centre at CUHNFT, RS Reports grants from EPSRC fellowship, GD Reports grants from NIHR, KS, MW Reports grants from Wellcome Trust, PL, IG, SB Reports grants from Wellcome Trust and Addenbrooke's Charitable Trust, NM Reports grants from MRC (UK) and NHS Blood and Transfusion
Figures
References
-
- Arons MM, Hatfield KM, Reddy SC, Kimball A, James A, Jacobs JR, Taylor J, Spicer K, Bardossy AC, Oakley LP, Tanwar S, Dyal JW, Harney J, Chisty Z, Bell JM, Methner M, Paul P, Carlson CM, McLaughlin HP, Thornburg N, Tong S, Tamin A, Tao Y, Uehara A, Harcourt J, Clark S, Brostrom-Smith C, Page LC, Kay M, Lewis J, Montgomery P, Stone ND, Clark TA, Honein MA, Duchin JS, Jernigan JA. Presymptomatic SARS-CoV-2 infections and transmission in a skilled nursing facility. New England Journal of Medicine. 2020 doi: 10.1056/NEJMoa2008457. - DOI - PMC - PubMed
-
- Artic network artic-ncov2019 / primer_schemes. GitHub. 2020 https://github.com/artic-network/artic-ncov2019/tree/master/primer_schem...
-
- Cook T, Kursumovic E, Lennane S. Exclusive: deaths of NHS staff from covid-19 analysed. [April 25, 2020];2020 https://www.hsj.co.uk/exclusive-deaths-of-nhs-staff-from-covid-19-analys...
Publication types
MeSH terms
Substances
Grants and funding
- MC_PC_17230/MRC_/Medical Research Council/United Kingdom
- MR/V011561/1/MRC_/Medical Research Council/United Kingdom
- Cambridge Biomedical Research Centre/National Institute for Health Research/International
- PRECISION Grand Challenge C38317/A24043/CRUK_/Cancer Research UK/United Kingdom
- EP/N031938/1/Engineering and Physical Sciences Research Council/International
- 200871/Z/16/Z/Wellcome/International
- 210688/Z/18/Z/Wellcome/International
- 108070/Z/15/Z/Wellcome/International
- Clinician Scientist Fellowship/AMS_/Academy of Medical Sciences/United Kingdom
- MC_PC_12009/MRC_/Medical Research Council/United Kingdom
- MR/P008801/1/MRC_/Medical Research Council/United Kingdom
- 206298/B/17/Z/Wellcome/International
- WT_/Wellcome Trust/United Kingdom
- 215515/Z/19/Z/Wellcome/International
- WPA15-02/NHS Blood and Transplant/International
- EP/P031447/1/Engineering and Physical Sciences Research Council/International
- 207498?Z/17/Z/Wellcome/International
LinkOut - more resources
Full Text Sources
Other Literature Sources
Medical
Miscellaneous
