. 2020 May 11;16(5):e1008255.
doi: 10.1371/journal.pgen.1008255. eCollection 2020 May.

Depletion of Ric-8B leads to reduced mTORC2 activity

Affiliations

Depletion of Ric-8B leads to reduced mTORC2 activity

Maíra H Nagai et al. PLoS Genet. .

Abstract

mTOR, a serine/threonine protein kinase that is involved in a series of critical cellular processes, can be found in two functionally distinct complexes, mTORC1 and mTORC2. In contrast to mTORC1, little is known about the mechanisms that regulate mTORC2. Here we show that mTORC2 activity is reduced in mice with a hypomorphic mutation of the Ric-8B gene. Ric-8B is a highly conserved protein that acts as a non-canonical guanine nucleotide exchange factor (GEF) for heterotrimeric Gαs/olf type subunits. We found that Ric-8B hypomorph embryos are smaller than their wild type littermates, fail to close the neural tube in the cephalic region and die during mid-embryogenesis. Comparative transcriptome analysis revealed that signaling pathways involving GPCRs and G proteins are dysregulated in the Ric-8B mutant embryos. Interestingly, this analysis also revealed an unexpected impairment of the mTOR signaling pathway. Phosphorylation of Akt at Ser473 is downregulated in the Ric-8B mutant embryos, indicating a decreased activity of mTORC2. Knockdown of the endogenous Ric-8B gene in cultured cell lines leads to reduced phosphorylation levels of Akt (Ser473), further supporting the involvement of Ric-8B in mTORC2 activity. Our results reveal a crucial role for Ric-8B in development and provide novel insights into the signals that regulate mTORC2.


Conflict of interest statement

The authors have declared that no competing interests exist.

Figures

Fig 1
Fig 1. Ric-8B gene trap mice.
(A) The genomic structure of the Ric-8B gene is shown, with its ten exons (1–10) and nine introns (between the exons) and the insertion sites of the gene trap vector in the ES cell lines RRH188 and RRA103. The insertion of the gene trap vector in intron 3 in the RRH188 cell line leads to the expression of chimeric mRNA containing exons 1, 2 and 3 in frame with the β-geo sequence. The locations of the primers used for PCR-based genotyping are indicated. SA: splice acceptor site. The Ric-8BΔ9 isoform lacks exon 9 (indicated in grey), is indicated. B) Multiplex PCR-based genotyping of the embryos obtained from intercrossing of heterozygous mice using one forward primer (188intronF2) and two reverse primers (VectorR2 and 188intronR2). A 312 bp PCR product is expected for the mutant allele, and a 582 bp PCR product is expected for the wild type allele. Representative analyzed embryos showed the following genotypes: Ric-8Bwt/wt (wild type, lanes 1, 3 and 5), Ric-8Bwt/bgeo (heterozygote, lanes 2 and 4) and Ric-8Bbgeo/bgeo (homozygous, lanes 6 and 7). (C) Ric-8B gene expression in the mouse embryo. RT-PCR was conducted to amplify Ric-8B and Ric-8BΔ9 transcripts from RNA prepared from wild type mouse embryos at different developmental stages. The PCR product sizes expected using the pair of primers that flank the ninth exon (A) are 462 bp (Ric-8B) and 342 bp (Ric-8BΔ9). (D) RT-PCR was conducted to amplify the regions between exon 3 and exon 5 (1) and exon 7 and exon 10 (2) of Ric-8B and actin (3) from embryos with different genotypes as indicated. (E) Real-time PCR was conducted to compare the expression levels of the Ric-8B gene in wild type (Ric-8Bwt/wt), heterozygotes (Ric-8Bwt/bgeo) and homozygous (Ric-8Bbgeo/bgeo) mutant embryos. Transcript levels were normalized to β-actin levels and are shown relative to the expression levels in wild type embryos. (F) Western blot analysis of protein extracts from embryos with the different genotypes using anti-Ric-8B antibodies. α-tubulin was used as a loading control.
Fig 2
Fig 2. Ric-8B expression in the adult Ric-8Bwt/bgeo mouse as revealed by X-gal staining.
(A) Sagittal whole-mount view of the nasal cavity and brain stained with X-gal. Blue staining can be detected in the olfactory epithelium (OE) and septal organ (SO), but not in the olfactory bulb (OB) nor in the vomeronasal organ (VNO). (B) The brain region is cut in a parasagittal plane, revealing blue staining of the striatum. (C-G) X-gal staining of sections cut through the nasal cavity of Ric-8B wt/bgeo mice (C, D and F) or Ric-8B wt/wt mice (E and G). X-gal staining is present throughout the olfactory epithelium (C, D and F), and in the septal organ region (arrow in D). In the same experimental conditions, no staining is observed in the wild type tissues. Sections in A-G were taken from the regions indicated in the schematic representation of the mouse brain.
Fig 3
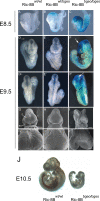
Fig 3. Ric-8B mutant embryos are smaller and show defective neural tube closure in the cephalic region.
(A-F´) Wild type (Ric-8Bwt/wt), heterozygous (Ric-8Bwt/bgeo) or homozygous (Ric-8Bbgeo/bgeo) embryos at E8.5 or E9.5 stained with X-gal are shown (not shown in scale). Ventral (D-F) and dorsal (D’-F’) views of the embryos are shown. In the Ric-8Bbgeo/bgeo embryos, the cephalic neural folds are not fused (white arrows) but the other regions of the neural tube are normally closed (F, F’). (G-I) Wild type (Ric-8Bwt/wt), heterozygous (Ric-8Bwt/bgeo) or homozygous (Ric-8Bbgeo/bgeo) embryos were examined by scanning electron microscopy at E9.5. G’, H’ and I’ are magnified regions from G, H and I, respectively. P (prosencephalon), BA (first branchial arch). Scale bars in G- I represent 100 μm, in G’-I’, 50 μm. (J) Representative images of a wild type and a homozygous mutant embryo (shown in scale).
Fig 4
Fig 4. Ric-8B expression in the embryo is predominant in the nervous system.
Upper panels: sagittal views of a Ric-8Bwt/bgeo embryo (A) or a Ric-8B bgeo/bgeo embryo (C) at E8.5. The lines indicate the levels at which the sections were cut (shown in B and D). In the Ric-8Bwt/bgeo embryo (A and B), blue staining is detected in the neural folds in the brain region (asterisk) and in the notochord (nc). In the Ric-8Bbgeo/bgeo embryo (C and D) blue staining is detected in the same regions as in the Ric-8Bwt/bgeo embryo, however the staining is stronger and expanded. Lower panels: sagittal and ventral views of a Ric-8Bwt/bgeo embryo (E and F) or a Ric-8Bbgeo/bgeo embryo (I and J) at E9.5. In the Ric-8Bwt/bgeo embryo (E-H), blue staining is detected in the neural fold fusion in the brain region (arrows) and in the floor plate region (fp). Note that the neural tube is closed (arrow in G). (H) Higher magnification of the neural tube in the Ric-8Bwt/bgeo embryo showing strong blue staining in the floor plate region and weaker staining in the notochord. In the Ric-8Bbgeo/bgeo embryo (I- L) blue staining is detected in the same regions as in the Ric-8Bwt/bgeo embryo; however, the staining is stronger and expanded. Note that the neural tube is not closed in the anterior region of the head (arrows in K) but are normally closed at the more caudal regions. (L) Higher magnification of the neural tube in the Ric-8Bbgeo/bgeo embryo showing strong blue staining in both the floor plate (fp) and notochord (nc) regions. Me (mesenchyme).
Fig 5
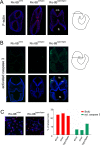
Fig 5. Increased apoptosis in Ric-8Bbgeo/bgeo embryos and MEFs.
(A) Transverse sections of E9.5 embryos stained with rhodamine-conjugated phalloidin (red) show that actin filament (F-actin) is highly concentrated in the apical region of the neural tube in wild type, heterozygous and mutant embryos. (B) Transverse sections of E9.5 embryos stained for active caspase 3 (green). Ric-8Bbgeo/bgeo embryos show an increased number of apoptotic cells in the mesenchyme and neuroepithelium when compared to wild type or heterozygous embryos. DAPI was used to stain the nuclei. Forebrain (fb); mesenchyme (me); midbrain (mb); hindbrain (hb); neuroepithelium (ne). The approximate localizations of the sections are indicated to the right. (C) MEFs were generated from Ric-8Bwt/wt (n = 2) or Ric-8Bbgeo/bgeo (n = 1) embryos were double stained for BrdU (red) and activated caspase-3 (green). The percentages of cells labeled in each case are indicated in the graph.
Fig 6
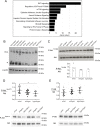
Fig 6. Phosphorylation of Akt (Ser473) is decreased in Ric-8Bbgeo/bgeo embryos.
(A) Cell signaling pathways predicted to be altered in the Ric-8B mutant embryos. Top 10 altered signaling pathways, as predicted by IPA, are shown. The ranking was based on the p values derived from the Fisher’s exact test (IPA). The x axis displays the–(log) p value. (B) Western blot of Gαs content in E9.5 embryos from the different Ric-8B genotypes. β-actin was used as loading control. (* possible degradation products of Gαs). (C) Western blot analysis of phospho-Akt (Thr308) in E9.5 embryos compared to pan-Akt. The graph shows the quantification of the ratio of phospho-Akt (Thr308) compared to pan-Akt (D) Semi-quantitative analysis of Akt (Ser473) phosphorylation in E9.5 embryos. The graph shows the quantification of the ratio of phospho-Akt (Ser473) compared to pan-Akt. Values are expressed relative to wild type embryo levels and shown as mean +/- S.E.M. (each dot represents an embryo), *, P<0.05. A representative Western blot is shown below the graph. (E) Semi-quantitative analysis of S6 phosphorylation in E9.5 embryos. The graph shows the quantification of the ratio of phospho-S6 compared to total S6. Values are expressed relative to wild type embryo levels and shown as mean +/- S.E.M. (each dot represents an embryo). A representative Western blot is shown below the graph.
Fig 7
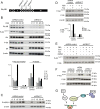
Fig 7. Ric-8B is required for mTORC2 activation in cultured cells.
(A) Schematic representation of the Ric-8B gene structure showing the regions targeted by the shRNAs used to knockdown endogenous expression of Ric-8B in cultured cells. (B) HEK293T cell lines containing a control shRNA (shRNA for luciferase) or the Ric-8B shRNA17 were starved for 4 hours and stimulated with FBS for 5, 15, 30 or 45 minutes. Total protein lysates were analyzed in Western blot experiments for the expression of the indicated proteins. The graph shows the quantification of the Western blots by densitometry of the ratio of phospho-Akt (Ser473) compared to total Akt and of phospho-S6 compared to total S6. (C) The same protein extracts as in (B) were analyzed in Western blot experiments for pNDRG1, a downstream target of mTORC2. (D) HEK293T cell lines containing the control shRNA or the Ric-8B shRNA17 were starved for 4 hours and stimulated with FBS or FBS plus 20μM forskolin for 30 minutes. Total protein lysates were analyzed in Western blot experiments for the expression of the indicated proteins. The graph shows the quantification by densitometry of the ratio of phospho-Akt (Ser473) compared to β-actin. (E) HEK293T cell lines containing the control shRNA or the Ric-8B shRNA17 were starved for 4 hours and stimulated with FBS or FBS plus 10μM surfen or 20 μM gallein for 30 minutes. Total protein lysates were analyzed in Western blot experiments for the expression of the indicated proteins. (F) HepG2 cell lines containing the control shRNA, Ric-8B shRNA16 or Ric-8B shRNA17 were starved for 4 hours and stimulated with FBS for 10 or 30 minutes. Protein lysates were analyzed for the expression of the indicated proteins as described above. (G) Schematic representation of the role played by Ric-8B in mTORC2 regulation. Growth factors activate PI3K at the cell membrane leading to the production of PIP3, recruitment of Akt and PDK1 and phosphorylation of Akt (Thr308) by PDK1. Depletion of Ric-8B impairs function and/or stability of Gα and Gβγ subunits and reduces phosphorylation of Akt (Ser473) by mTORC2. Increase in cAMP does not rescue mTORC2 activity, indicating that the effect is not due to deficient Gαs function. Whether Gβγ subunits are required for mTORC2 still needs to be determined. Ric-8B may also regulate mTORC2 independently of G proteins (dashed arrow). Phosphorylated substrates analyzed in our experiments are indicated in green.

References

    1. Tall GG, Krumins AM, Gilman AG (2003) Mammalian Ric-8A (synembryn) is a heterotrimeric Gα protein guanine nucleotide exchange factor. J Biol Chem 278: 8356–8362. 10.1074/jbc.M211862200 - DOI - PubMed
    1. Von Dannecker L, Mercadante A, Malnic B (2005) Ric-8B, an olfactory putative GTP exchange factor, amplifies signal transduction through the olfactory-specific G-protein Gaolf. J Neurosci 25: 3793–3800. 10.1523/JNEUROSCI.4595-04.2005 - DOI - PMC - PubMed
    1. Chan P, Gabay M, Wright FA, Tall GG (2011) Ric-8B is a GTP-dependent G protein alphas guanine nucleotide exchange factor. J Biol Chem 286: 19932–19942. 10.1074/jbc.M110.163675 - DOI - PMC - PubMed
    1. Jones DT, Reed RR (1989) Golf: an olfactory neuron-specific G-protein involved in odorant signal transduction. Science 244: 790–795. 10.1126/science.2499043 - DOI - PubMed
    1. Belluscio L, Gold GH, Nemes A, Axel R (1998) Mice deficient in G(olf) are anosmic. Neuron 20: 69–81. 10.1016/s0896-6273(00)80435-3 - DOI - PubMed

Publication types

Substances