Clinical Trial
. 2020 Aug 1;105(8):2541-2552.
doi: 10.1210/clinem/dgaa251.

Leptin-Mediated Changes in the Human Metabolome

Affiliations
Clinical Trial

Leptin-Mediated Changes in the Human Metabolome

Katherine Lawler et al. J Clin Endocrinol Metab. .

Abstract

Context: While severe obesity due to congenital leptin deficiency is rare, studies in patients before and after treatment with leptin can provide unique insights into the role that leptin plays in metabolic and endocrine function.

Objective: The aim of this study was to characterize changes in peripheral metabolism in people with congenital leptin deficiency undergoing leptin replacement therapy, and to investigate the extent to which these changes are explained by reduced caloric intake.

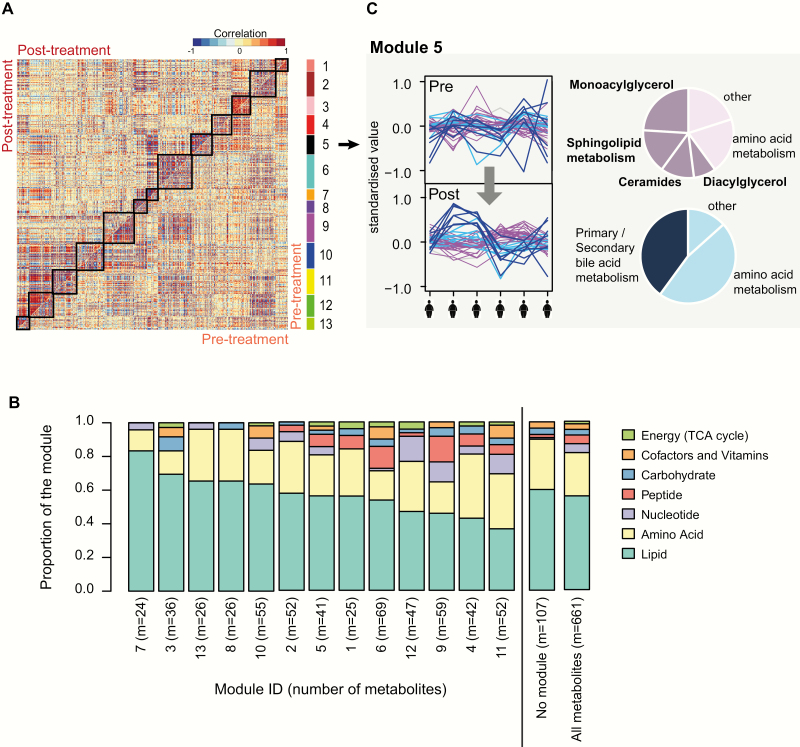
Design: Ultrahigh performance liquid chromatography-tandem mass spectroscopy (UPLC-MS/MS) was used to measure 661 metabolites in 6 severely obese people with congenital leptin deficiency before, and within 1 month after, treatment with recombinant leptin. Data were analyzed using unsupervised and hypothesis-driven computational approaches and compared with data from a study of acute caloric restriction in healthy volunteers.

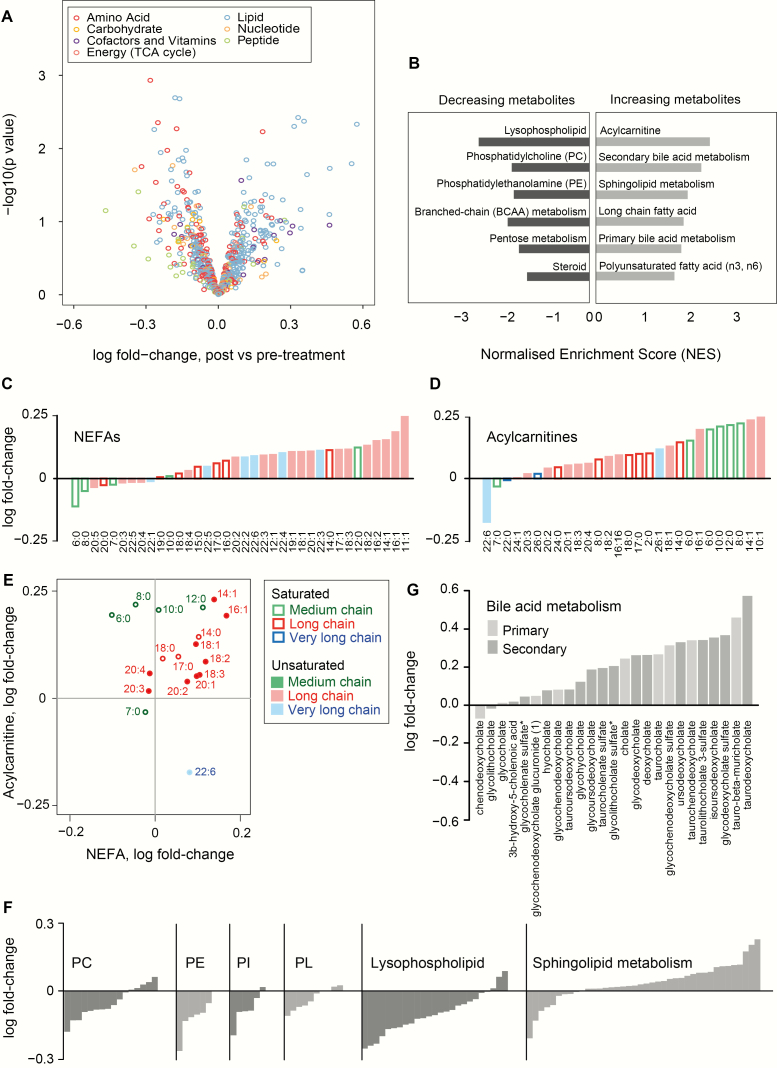
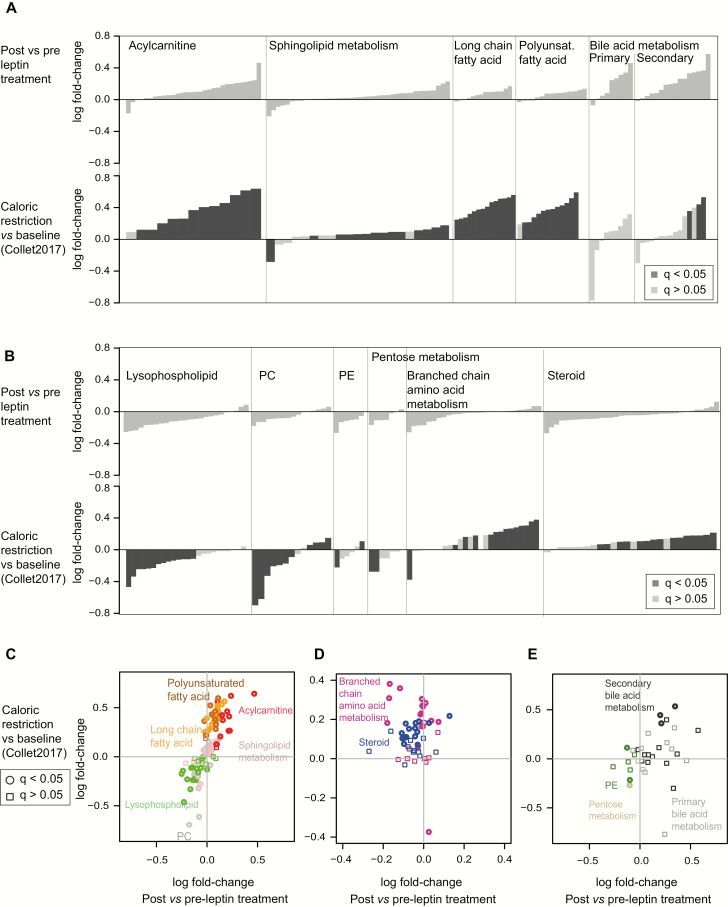
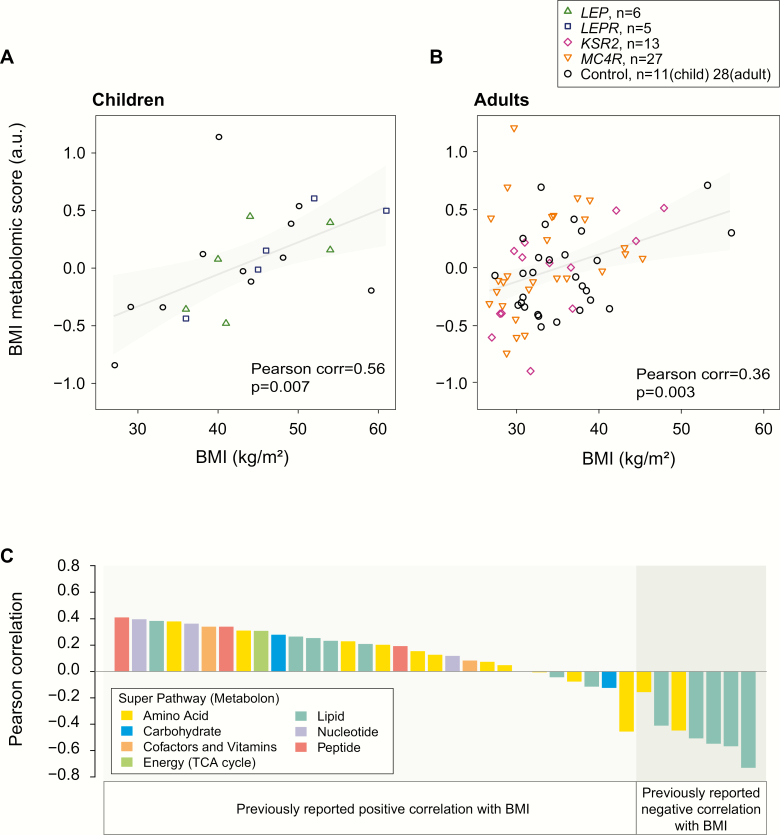
Results: Leptin replacement was associated with class-wide increased levels of fatty acids and acylcarnitines and decreased phospholipids, consistent with enhanced lipolysis and fatty acid oxidation. Primary and secondary bile acids increased after leptin treatment. Comparable changes were observed after acute caloric restriction. Branched-chain amino acids and steroid metabolites decreased after leptin, but not after acute caloric restriction. Individuals with severe obesity due to leptin deficiency and other genetic obesity syndromes shared a metabolomic signature associated with increased BMI.

Conclusion: Leptin replacement was associated with changes in lipolysis and substrate utilization that were consistent with negative energy balance. However, leptin's effects on branched-chain amino acids and steroid metabolites were independent of reduced caloric intake and require further exploration.

Keywords: bile acids; leptin; lipids; metabolomics; obesity.


Figures

Figure 1.
Figure 1.
Metabolome-wide changes after acute leptin treatment in congenital leptin deficiency. (A.) Volcano plot showing the acute change for each metabolite upon leptin treatment (“post”) compared to before treatment (“pre-treatment”) after correcting for confounding factors. Full results are in Table S1 (21). (B.) Metabolite-set enrichment analysis of sub-pathway annotations showing metabolite sets with FDR q value < 0.2 and raw P value < 0.05. Full results are in Table S2 (21). (C-E.) Global increase in NEFAs (C), acylcarnitines (D) and fold-change of corresponding NEFAs and acylcarnitines after leptin replacement. Filled symbols/bars indicate unsaturated, and unfilled symbols/bars represent saturated, fatty acids of different chain length: medium chain (C6-12), long chain (C13-21) and very long chain (C22 or more). (F.) Fold-change of metabolites after leptin treatment, illustrated for the following lipid classes: phosphatidylcholine (PC), phosphatidylethanolamine (PE), phosphatidylinositols (PI), plasmalogens (PL), lysophospholipids and sphingolipids. (G.) Fold-change of metabolites in the 2 sub-pathways “primary bile acid metabolism” (light grey bars) and “secondary bile acid metabolism” (dark grey bars). Metabolite-set enrichment analysis for these 2 sub-pathways is reported in Table S2, Fig. S2 (21).
Figure 2.
Figure 2.
Module analysis of changes in metabolites with acute leptin replacement. (A.) Metabolite correlation plot indicating the 13 modules with differential correlation in post-treatment samples compared with pre-treatment samples. The upper diagonal matrix shows correlation between pairs of metabolites in the post-treatment group while the lower diagonal matrix shows the correlation between pairs of metabolites in the pre-treatment group. Modules are identified in the heat map by squares and by a color bar on the right-hand side (labeled 1 to 13). Each module consists of 1 or more submodules comprised of metabolites which are correlated or anticorrelated across the 6 individuals. For each module, the constituent metabolites and their sub-pathway annotations are provided in Table S3 (21). (B.) Bar plots illustrate the super-pathway composition of modules 1-13, of the remaining metabolites which were not assigned to a module, and of all the metabolites. For a more detailed description of each module, the super-pathway and sub-pathway annotation of metabolites in each module is reported in Table S4 (21), and sub-pathway enrichments among the submodules are summarized in Table S5 (21). (C.) Illustrative example showing module 5. The line plots display the metabolites across the 6 individuals before (“pre”) and after (“post”) leptin treatment, showing a gain of correlation after treatment. Two submodules are negatively correlated with each other (depicted in pink and blue, respectively). Pie charts show the sub-pathway composition of each submodule (details in Table S5 (21)). The composition of a second module (module 7) is illustrated in Figure S5 (21).
Figure 3.
Figure 3.
Comparison of metabolite changes associated with leptin replacement with those associated with acute caloric restriction (A-B.) Comparison at the level of metabolite sets based on the metabolite-set enrichment analysis of sub-pathways in Fig. 1B. In each plot, the top row illustrates fold-changes in metabolites in patients with congenital leptin deficiency post- vs pre-leptin treatment and the bottom row illustrates fold-changes upon caloric restriction versus baseline (data obtained from (15); dark columns indicate metabolites with a reported statistically significant change after caloric restriction, FDR q value < 0.05). Metabolites are sorted by increasing fold-change. Metabolite sub-pathways which tend towards an increase (A) or decrease (B) upon leptin treatment are shown (also seeFig. 1B; Table S2 (21)). (C-E.) Comparison at the level of individual metabolites. The scatterplots of individual metabolites show fold-change in “caloric restriction versus baseline” (as reported in (15); y-axis) versus acute fold-change upon leptin replacement therapy (x-axis). (C) shows the sub-pathways which have a consistent direction in the 2 studies. (D-E) show the sub-pathways with opposing or inconsistent directions of change between the 2 studies.
Figure 4.
Figure 4.
Metabolomic signature of BMI is preserved in people with genetic obesity syndromes. (A-B.) Scatter plots show a summary score of BMI-associated metabolites (“BMI metabolomic score”) versus BMI for (A) obese children (2–18 years of age, n = 22) and (B) adults (18-55 years of age, n = 68) with genetic obesity syndromes (harboring mutations in LEP, LEPR, MC4R, KSR2) and age- and BMI-matched controls. The grey line and shaded regions illustrate fitted linear regression models (95% confidence) to highlight the significant positive association with BMI. Characteristics of the study participants are summarized in Table 2. C. For each metabolite comprising the metabolomic BMI score, the bar plot illustrates the Pearson correlation of BMI and the metabolite value across individuals. The correlation between metabolite score and BMI is compared to correlations reported in [30].

References

    1. Zhang Y, Proenca R, Maffei M, Barone M, Leopold L, Friedman JM. Positional cloning of the mouse obese gene and its human homologue. Nature. 1994;372(6505):425-432. - PubMed
    1. Halaas JL, Gajiwala KS, Maffei M, et al. Weight-reducing effects of the plasma protein encoded by the obese gene. Science. 1995;269(5223):543-546. - PubMed
    1. Pelleymounter MA, Cullen MJ, Baker MB, et al. Effects of the obese gene product on body weight regulation in ob/ob mice. Science. 1995;269(5223):540-543. - PubMed
    1. Campfield LA, Smith FJ, Guisez Y, Devos R, Burn P. Recombinant mouse OB protein: evidence for a peripheral signal linking adiposity and central neural networks. Science. 1995;269(5223):546-549. - PubMed
    1. Montague CT, Farooqi IS, Whitehead JP, et al. Congenital leptin deficiency is associated with severe early-onset obesity in humans. Nature. 1997;387(6636):903-908. - PubMed

Publication types

MeSH terms