. 2020 May 11;20(5):3.
doi: 10.1167/jov.20.5.3.

Task-dependence in scene perception: Head unrestrained viewing using mobile eye-tracking

Affiliations

Task-dependence in scene perception: Head unrestrained viewing using mobile eye-tracking

Daniel Backhaus et al. J Vis. .

Abstract

Real-world scene perception is typically studied in the laboratory using static picture viewing with restrained head position. Consequently, the transfer of results obtained in this paradigm to real-word scenarios has been questioned. The advancement of mobile eye-trackers and the progress in image processing, however, permit a more natural experimental setup that, at the same time, maintains the high experimental control from the standard laboratory setting. We investigated eye movements while participants were standing in front of a projector screen and explored images under four specific task instructions. Eye movements were recorded with a mobile eye-tracking device and raw gaze data were transformed from head-centered into image-centered coordinates. We observed differences between tasks in temporal and spatial eye-movement parameters and found that the bias to fixate images near the center differed between tasks. Our results demonstrate that current mobile eye-tracking technology and a highly controlled design support the study of fine-scaled task dependencies in an experimental setting that permits more natural viewing behavior than the static picture viewing paradigm.


Figures

Figure 1.
Figure 1.
Sequence of events in the scene-viewing experiment.
Figure 2.
Figure 2.
Transformation of scene-camera coordinates (subpixel level) into image coordinates in pixels. Left panel: Frame taken by SMI ETG-120Hz scene camera with measured fixation location (circle). Right panel: The same frame and fixation in image coordinates.
Figure 3.
Figure 3.
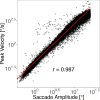
Main sequence. Double-logarithmic representation of saccade amplitude and saccade peak velocity.
Figure 4.
Figure 4.
Projector screen movement. As an approximation of head movements, the projector screen movement is measured by tracking the position of QR-markers in the scene-camera video.
Figure 5.
Figure 5.
Median horizontal and vertical deviation of participants’ gaze position from the initial fixation cross in the left and right panels, respectively.
Figure 6.
Figure 6.
Fixation duration distributions. The figure shows relative frequencies of fixation durations in the four tasks. Fixation durations were binned in steps of 25 ms.
Figure 7.
Figure 7.
Distribution of saccade amplitudes. The figure shows relative frequencies of saccade amplitudes in the four tasks. Saccade amplitudes were binned in steps of 0.5.
Figure 8.
Figure 8.
Temporal evolution of the central fixation bias measured as the average distance to image center. Each line corresponds to one of the four instructions. The horizontal line provides the expected distance to center, if fixations were uniformly placed on an image. Level of significance: *p < 0.05.
Figure 9.
Figure 9.
Shannon's entropy. Average entropy of fixation densities on an image in the four tasks. A value of 14 bit is expected for a uniform fixation density. Smaller values indicate that fixations cluster in specific parts of an image. Confidence intervals were corrected for within-subject designs (Cousineau, 2005; Morey, 2008).
Figure 10.
Figure 10.
Average predictability of fixation locations in a task. Predictability was measured in bit per fixation as the average gain in log-likelihood of each fixation relative to a uniform distribution. Fixations were predicted from the distribution of all fixation locations measured under (A) Count People, (B) Count Animals, (C) Guess Country, and (D) Guess Time instruction. Confidence intervals were corrected for within-subject designs (Cousineau, 2005; Morey, 2008).
Figure 11.
Figure 11.
Average predictability of fixation locations in each task by the DeepGaze2 model. Predictability was measured in bit per fixation as the average gain in log-likelihood of each fixation relative to a uniform distribution. Confidence intervals were corrected for within-subject designs (Cousineau, 2005; Morey, 2008).

References

    1. Baayen R. H., Davidson D. J., & Bates D. M. (2008). Mixed-effects modeling with crossed random effects for subjects and items. Journal of Memory and Language, 59, 390–412.
    1. Baddeley A., & Turner R. (2005). spatstat: An R package for analyzing spatial point patterns. Journal of Statistical Software, 12, 1–42.
    1. Bahill A. T., Clark M. R., & Stark L. (1975). The main sequence, a tool for studying human eye movements. Mathematical Biosciences, 24, 191–204.
    1. Ballard D. H., Hayhoe M. M., & Rao R. P. N. (1997). Deictic codes for the embodiment of cognition. Behavioral & Brain Sciences, 20, 723–767. - PubMed
    1. Bates D., Mächler M., Bolker B., & Walker S. (2015). Fitting linear mixed-effects models using lme4. Journal of Statistical Software, 67, 1–48.

Publication types