. 2020 Jun 19;48(11):5939-5952.
doi: 10.1093/nar/gkaa360.

Histone variant H2A.Z regulates nucleosome unwrapping and CTCF binding in mouse ES cells

Affiliations

Histone variant H2A.Z regulates nucleosome unwrapping and CTCF binding in mouse ES cells

Zengqi Wen et al. Nucleic Acids Res. .

Abstract

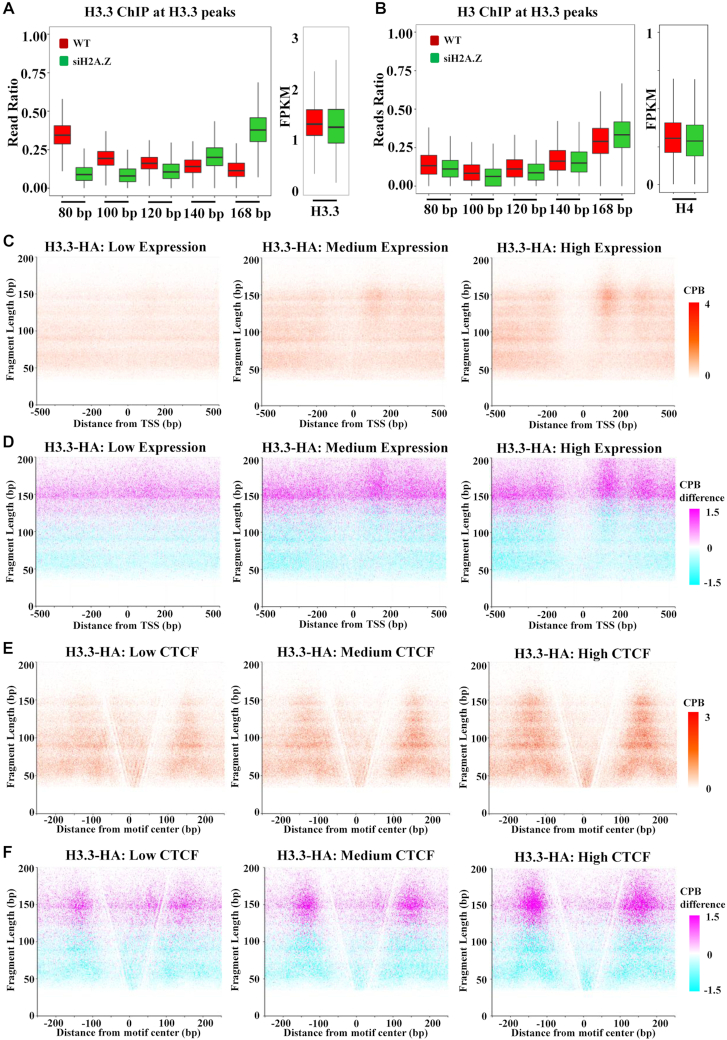
Nucleosome is the basic structural unit of chromatin, and its dynamics plays critical roles in the regulation of genome functions. However, how the nucleosome structure is regulated by histone variants in vivo is still largely uncharacterized. Here, by employing Micrococcal nuclease (MNase) digestion of crosslinked chromatin followed by chromatin immunoprecipitation (ChIP) and paired-end sequencing (MNase-X-ChIP-seq), we mapped unwrapping states of nucleosomes containing histone variant H2A.Z in mouse embryonic stem (ES) cells. We found that H2A.Z nucleosomes are more enriched with unwrapping states compared with canonical nucleosomes. Interestingly, +1 H2A.Z nucleosomes with 30-80 bp DNA is correlated with less active genes compared with +1 H2A.Z nucleosomes with 120-140 bp DNA. We confirmed the unwrapping of H2A.Z nucleosomes under native condition by re-ChIP of H2A.Z and H2A after CTCF CUT&RUN in mouse ES cells. Importantly, we found that depletion of H2A.Z results in decreased unwrapping of H3.3 nucleosomes and increased CTCF binding. Taken together, through MNase-X-ChIP-seq, we showed that histone variant H2A.Z regulates nucleosome unwrapping in vivo and that its function in regulating transcription or CTCF binding is correlated with unwrapping states of H2A.Z nucleosomes.


Figures

Figure 1.
Figure 1.
H2A.Z is enriched with nucleosome unwrapping. (A) Histogram shows the fragment length profiles (FLPs) of DNA fragments ChIPed by H2A.Z, H2A or H3 under ‘shortMN’ digestion condition. The red arrows indicate the major fragment length peaks. (B) Histogram shows the FLPs of DNA fragments ChIPed by H2A.Z, H2A or H3 under ‘longMN’ digestion condition. The red arrows indicate the major fragment length peaks. (C) Genome tracks show the distribution of H2A.Z ChIPed fragments under ‘shortMN’ and ‘longMN’ digestion conditions. The signals for all the tracks are normalized by reads per million (RPM) per 10 bp bin. (D) Venn plot shows the overlapping between peaks (n = 32843) of 30–80 bp DNA fragments and peaks (n = 33353) of 80–168 bp DNA fragments of H2A.Z nucleosomes. (E–G) Histograms show the distribution of H2A.Z (E), H3K4me3 (F) and Pol II (G) around 30–80bp specific peaks (n = 20935), Overlap peaks (n = 11 908) and 80–168 bp specific peaks (n = 21 445).
Figure 2.
Figure 2.
Unwrapping of H2A.Z nucleosomes at the promoters. (A) V-plots show the FLPs of H2A.Z ChIPed DNA fragments around the transcription start sites (TSSs) of low, medium and high expressed genes. The grey box highlights the signals indicating diffusing unwrapped +1 H2A.Z nucleosomes. Refer to Figure 1G for the interpretation of V-plot. (B) Hierarchical clustering of +1 H2A.Z nucleosomes based on the ratios of the five DNA fragment groups within each +1 H2A.Z nucleosome. The ratios were centered by median and scaled by median absolute deviation within each fragment group for clustering. Group 80, 100, 120, 140, 168 include fragments of 30–80, 80–100, 100–120, 120–140 and 140–168 bp, respectively. (C) Boxplots show the levels of H3K27ac, H3K4me3, Pol II and gene expression of promoters co-localized with each cluster of H2A.Z nucleosome. ** indicates P-value < 0.01. (D) Genome tracks of the H2A.Z ChIPed DNA fragments show the depletion of 30–80 bp DNA fragments of H2A.Z nucleosomes at the high expressed genes Snx2 and Fkbp9, and the presence of 30–80 bp DNA fragments of H2A.Z nucleosomes at the low expressed genes Snx24 and Nt5c3. The signals for all the tracks are normalized by reads per million (RPM) per 10 bp bin. (E) Gene ontology analysis revealed the enriched functions of the genes co-localized with Cluster-A or Cluster-D unwrapped H2A.Z nucleosomes. (F) A diagram shows the working model that the function of the +1 H2A.Z nucleosomes in transcription regulation is correlated with its unwrapping states. The +1 H2A.Z nucleosomes with the highest ratio of 30–80 bp DNA fragments are associated with less active genes, such as the genes involved in signaling transduction. The +1 H2A.Z nucleosomes with highest ratio of 120–140 bp DNA fragments are associated with genes involved in housekeeping functions.
Figure 3.
Figure 3.
Unwrapping of H2A.Z nucleosomes at the CTCF binding sites. (A, E) V-plots show the FLPs of H2A.Z (A) and H2A (E) ChIPed DNA around 4 kb regions of CBS sites. The CTCF peaks are orientated and centered on the CTCF binding motif 5′-CCACNAGGTGGCAG-3′ in Figures 3–5, Supplementary Figure S3-S4. (B, F) V-plots show the fragment length distribution of H2A.Z (B) and H2A (F) ChIPed DNA around 500 bp regions of CBS sites with low, medium and high CTCF binding. Two populations of unwrapped H2A.Z nucleosomes with 30–80 bp DNA (indicated by the signals highlighted in the grey box) can be observed on each of the two nucleosomes immediately flanking CBSs. (C, G) Meta profiles show the reads density of the five fragment groups of H2A.Z (C) and H2A (G) ChIPed DNA around 4 kb regions of CBS sites. (D, H) Meta profiles show the reads density of H2A.Z (D) and H2A (H) ChIPed DNA around 500 bp regions of CBS sites with low, medium and high CTCF binding. Red arrows in Figure D and Figure H indicate moderate signals of unwrapped H2A.Z or H2A nucleosomes with 30–80 bp DNA at the center of CBSs. Cyan arrows in Figure H indicate moderate signals of intact H2A nucleosomes between CBSs the downstream nucleosome.
Figure 4.
Figure 4.
H2A.Z regulates the unwrapping of H3.3 nucleosomes. (A, B) Boxplots show the change of the unwrapping states of H3.3 nucleosomes (A) or H3 nucleosomes (B) at the H3.3 peak regions (n = 13 226). (C, E) V-plots show the fragment length distribution of H3.3–HA ChIPed DNA fragments around the transcription start sites (TSSs) of low, medium and high expression genes (C) or around CBS sites with low, medium and high CTCF binding (E). (D, F) Difference-V-plots show the changes of fragment length distribution of H3.3-HA ChIPed DNA fragments after H2A.Z knockdown cells around the transcription start sites (TSSs) of low, medium and high expression genes (D) or around CBS sites with low, medium and high CTCF binding (F). To plot a difference-V-plot, the fragment length distribution of both wild type and H2A.Z knockdown cells was counted as matrix (normalized to centers per billion fragments (CPB)) as the V-plot; and then each of the data points in H2A.Z knockdown matrix was subtracted by the corresponding data point (with same x-axis value and y-axis value) in wild type matrix to derive the CPB difference. Colors magenta and cyan indicate increased and decreased signals after H2A.Z knockdown, respectively.
Figure 5.
Figure 5.
H2A.Z regulates nucleosome unwrapping and CTCF binding. (A) Genome tracks show the signals of H2A.Z ChIP-seq, H2A.Z or H2A re-ChIP after CTCF CUT&RUN, CTCF CUT&RUN and CTCF ChIP-seq. (B) Histograms show the FLPs of H2A.Z or H2A re-ChIPed DNA after CTCF CUT&RUN and total DNA of CTCF CUT&RUN. (C–E) V-plots show the distribution of fragments of H2A.Z (C) or H2A (D) re-ChIPed DNA after CTCF CUT&RUN and total DNA of CTCF CUT&RUN (E) around CBSs. (F, G) Heatmap (F) and meta-profile (G) and show the dynamics of CTCF around CBSs after H2A.Z knockdown. (H) A difference-V-plot shows the dynamics of DNA fragments of MNase-X-ChIP input at CBSs after H2A.Z knockdown. (I) A diagram shows the working model that unwrapped H2A.Z nucleosomes flanking CBSs facilitate CTCF binding while unwrapped H2A.Z nucleosomes at the center of CBSs compete with CTCF for binding. In unwrapped H2A.Z nucleosomes immediately flanking CBSs, the H2A.Z–H2B dimers may have detached from the (H3–H4)2 tetrasome to form open nucleosomes.

Similar articles

Cited by

References

    1. Luger K., Mader A.W., Richmond R.K., Sargent D.F., Richmond T.J.. Crystal structure of the nucleosome core particle at 2.8 Å resolution. Nature. 1997; 389:251–260. - PubMed
    1. Luger K., Dechassa M.L., Tremethick D.J.. New insights into nucleosome and chromatin structure: an ordered state or a disordered affair. Nat. Rev. Mol. Cell Biol. 2012; 13:436. - PMC - PubMed
    1. Fei J., Torigoe S.E., Brown C.R., Khuong M.T., Kassavetis G.A., Boeger H., Kadonaga J.T.. The prenucleosome, a stable conformational isomer of the nucleosome. Genes Dev. 2015; 29:2563–2575. - PMC - PubMed
    1. Engeholm M., de Jager M., Flaus A., Brenk R., van Noort J., Owen-Hughes T.. Nucleosomes can invade DNA territories occupied by their neighbors. Nat. Struct. Mol. Biol. 2009; 16:151. - PMC - PubMed
    1. Kato D., Osakabe A., Arimura Y., Mizukami Y., Horikoshi N., Saikusa K., Akashi S., Nishimura Y., Park S.-Y., Nogami J. et al. .. Crystal structure of the overlapping dinucleosome composed of hexasome and octasome. Science. 2017; 356:205. - PubMed

Publication types