. 2020 Aug 13;136(7):845-856.
doi: 10.1182/blood.2020004801.

Developmental trajectory of prehematopoietic stem cell formation from endothelium

Affiliations

Developmental trajectory of prehematopoietic stem cell formation from endothelium

Qin Zhu et al. Blood. .

Abstract

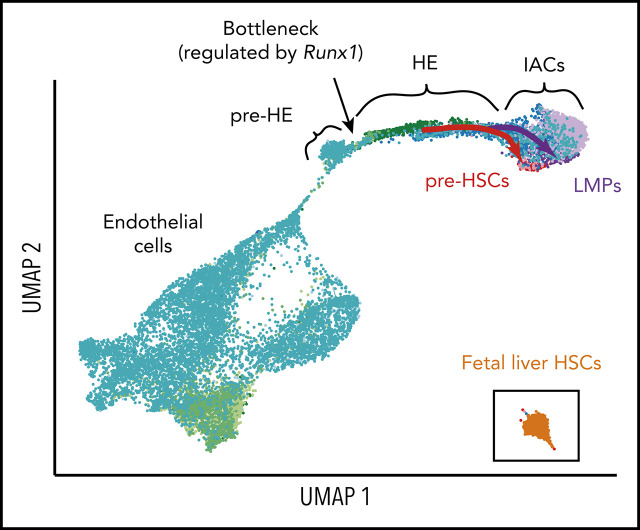
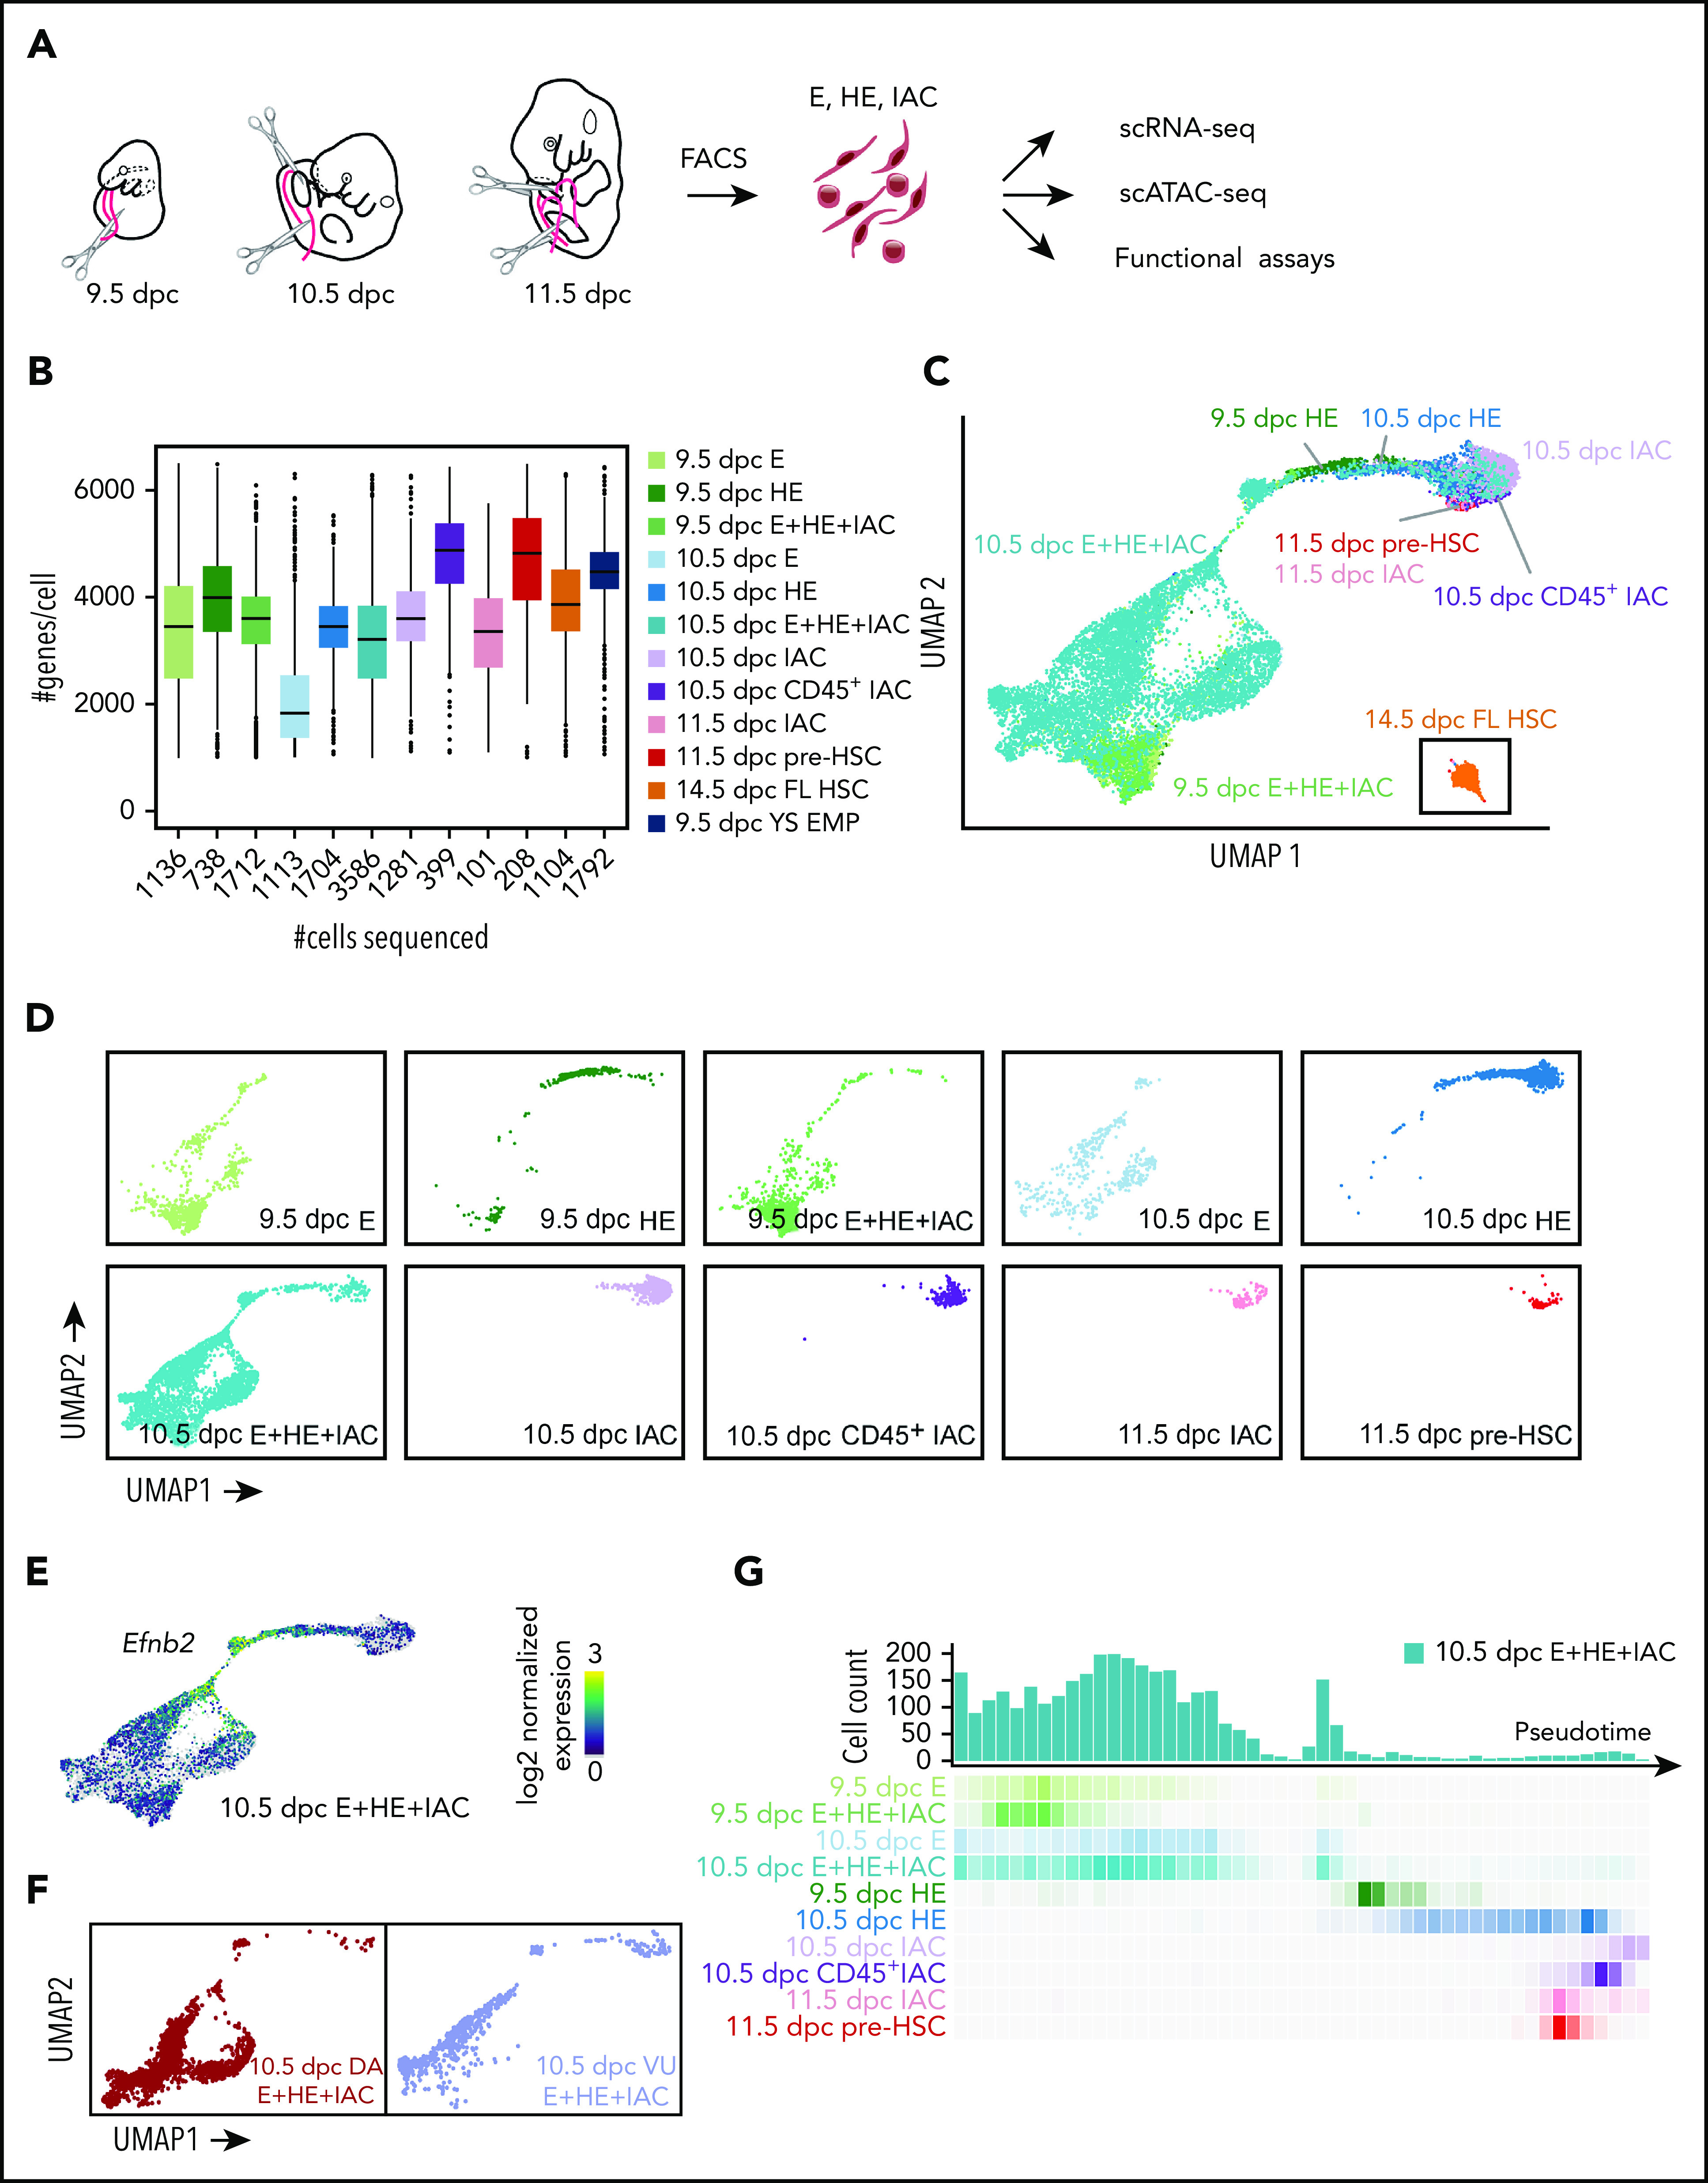
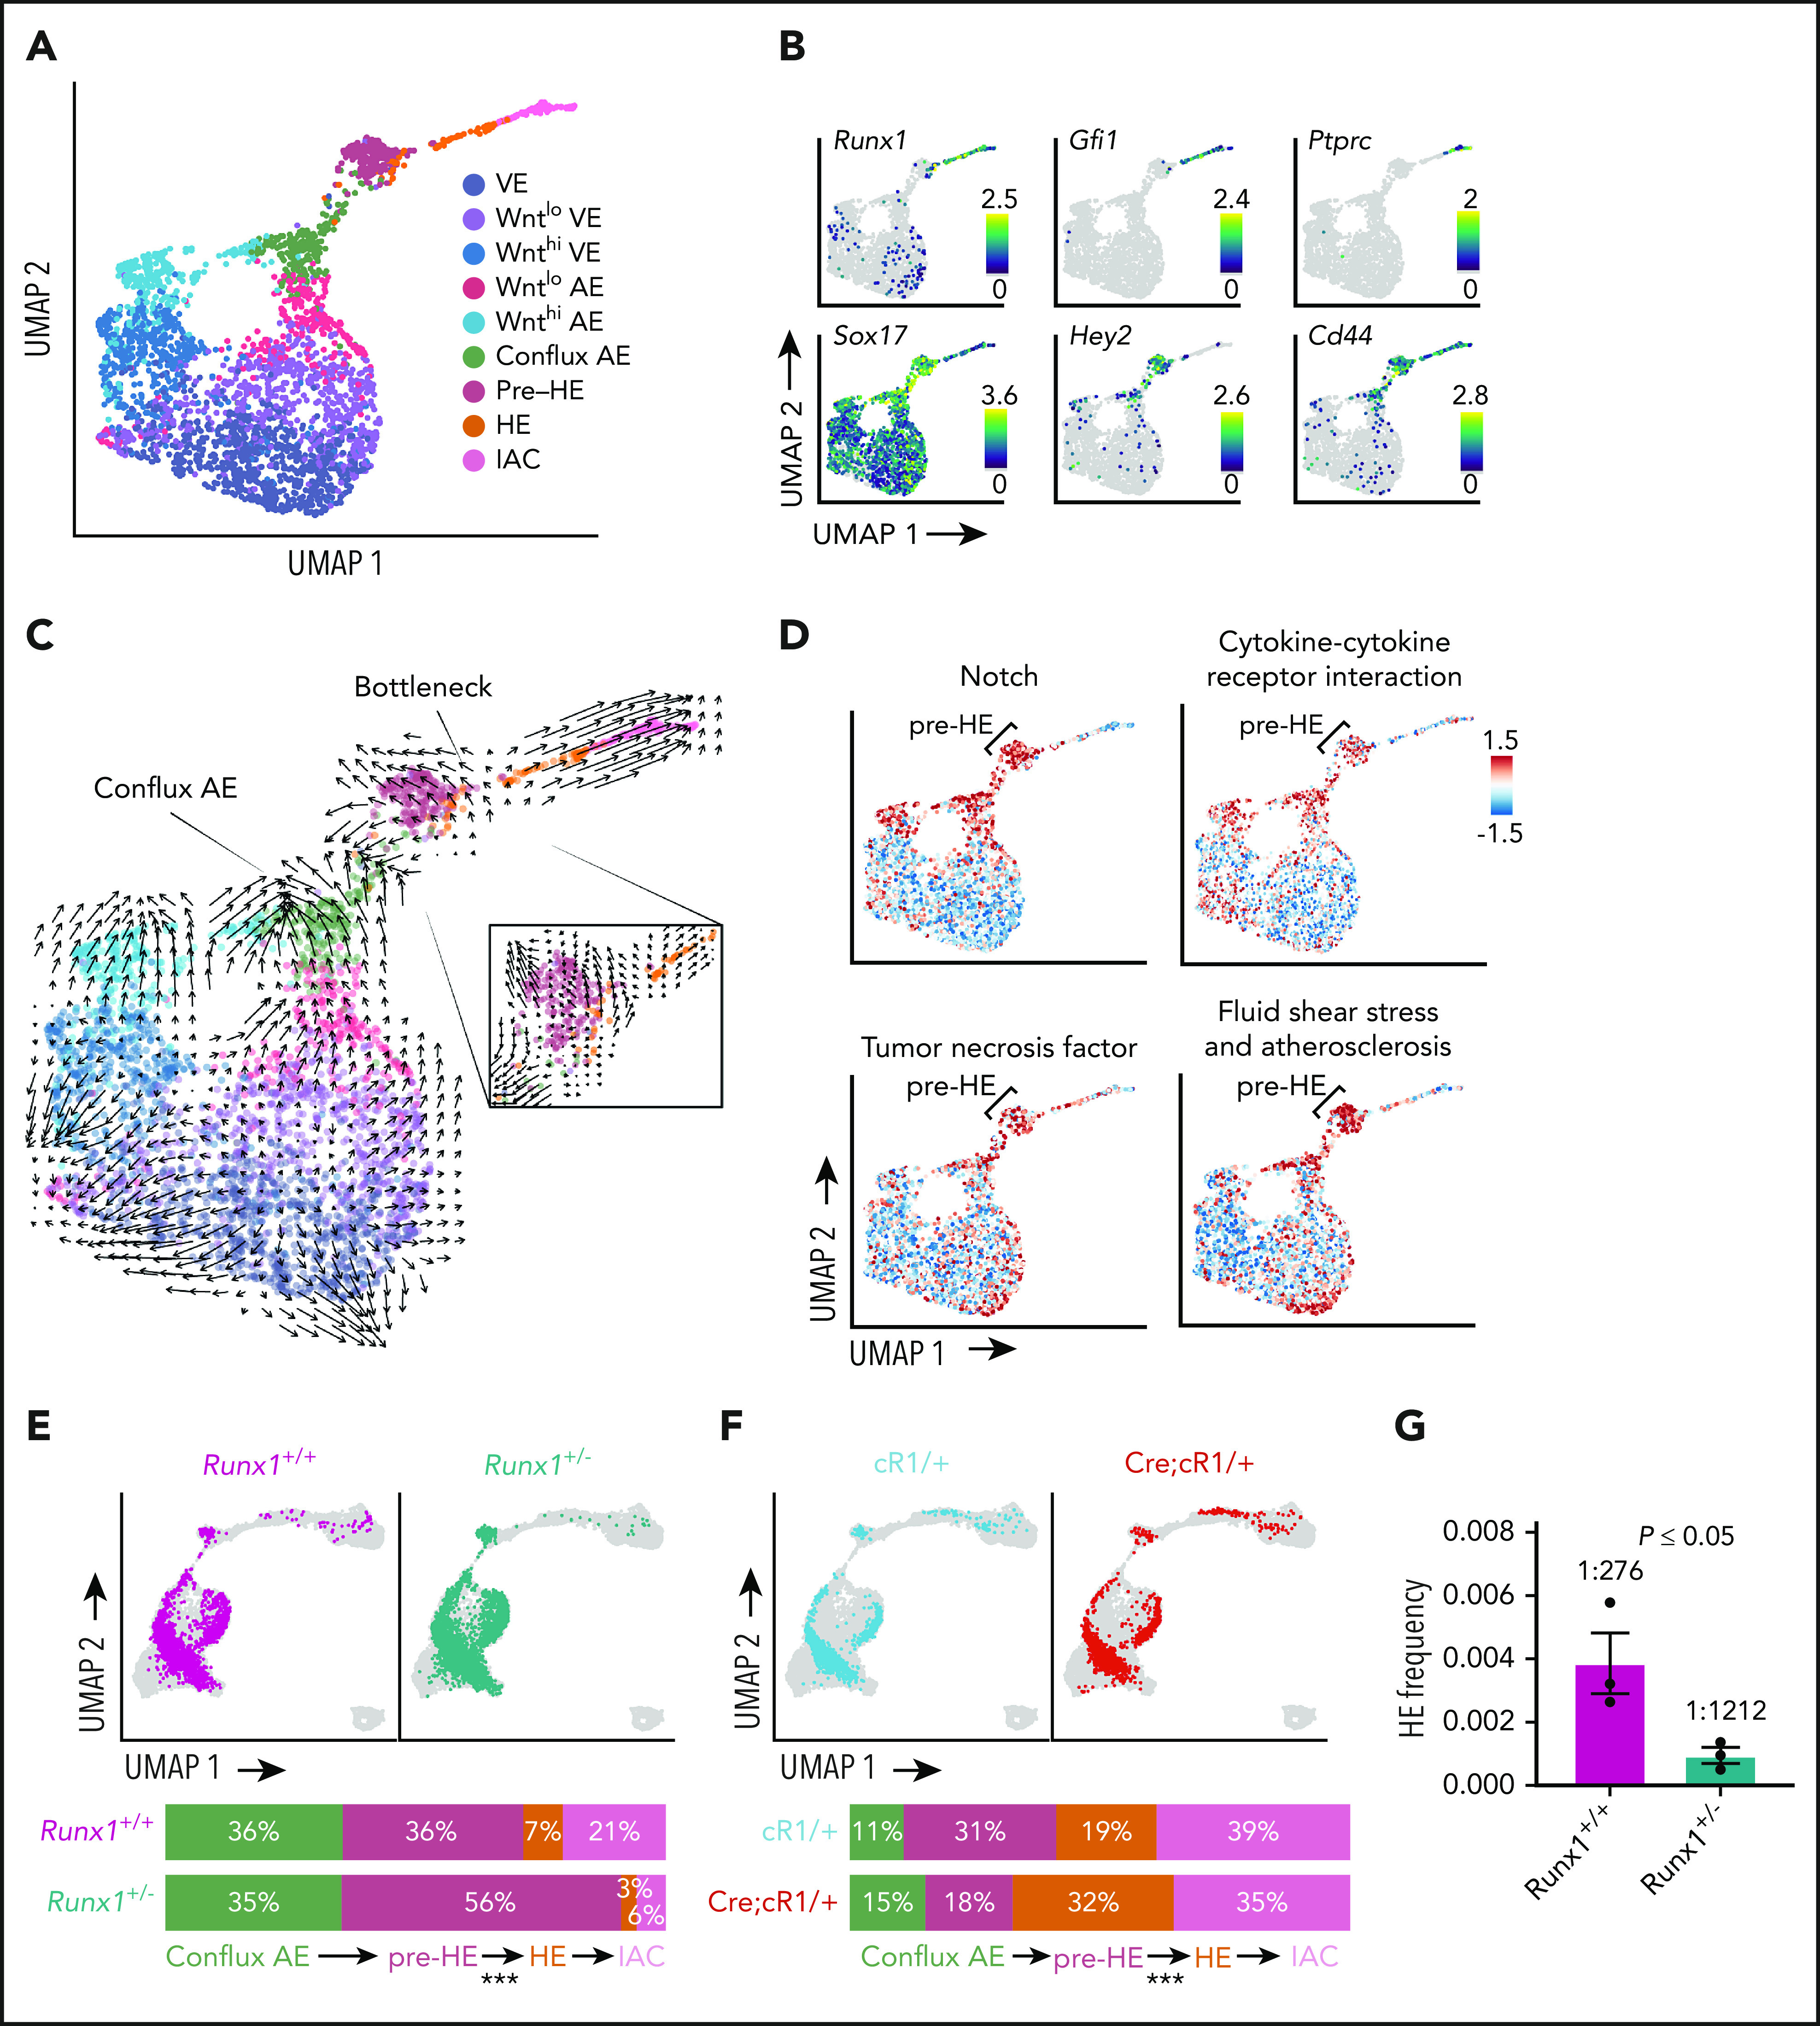
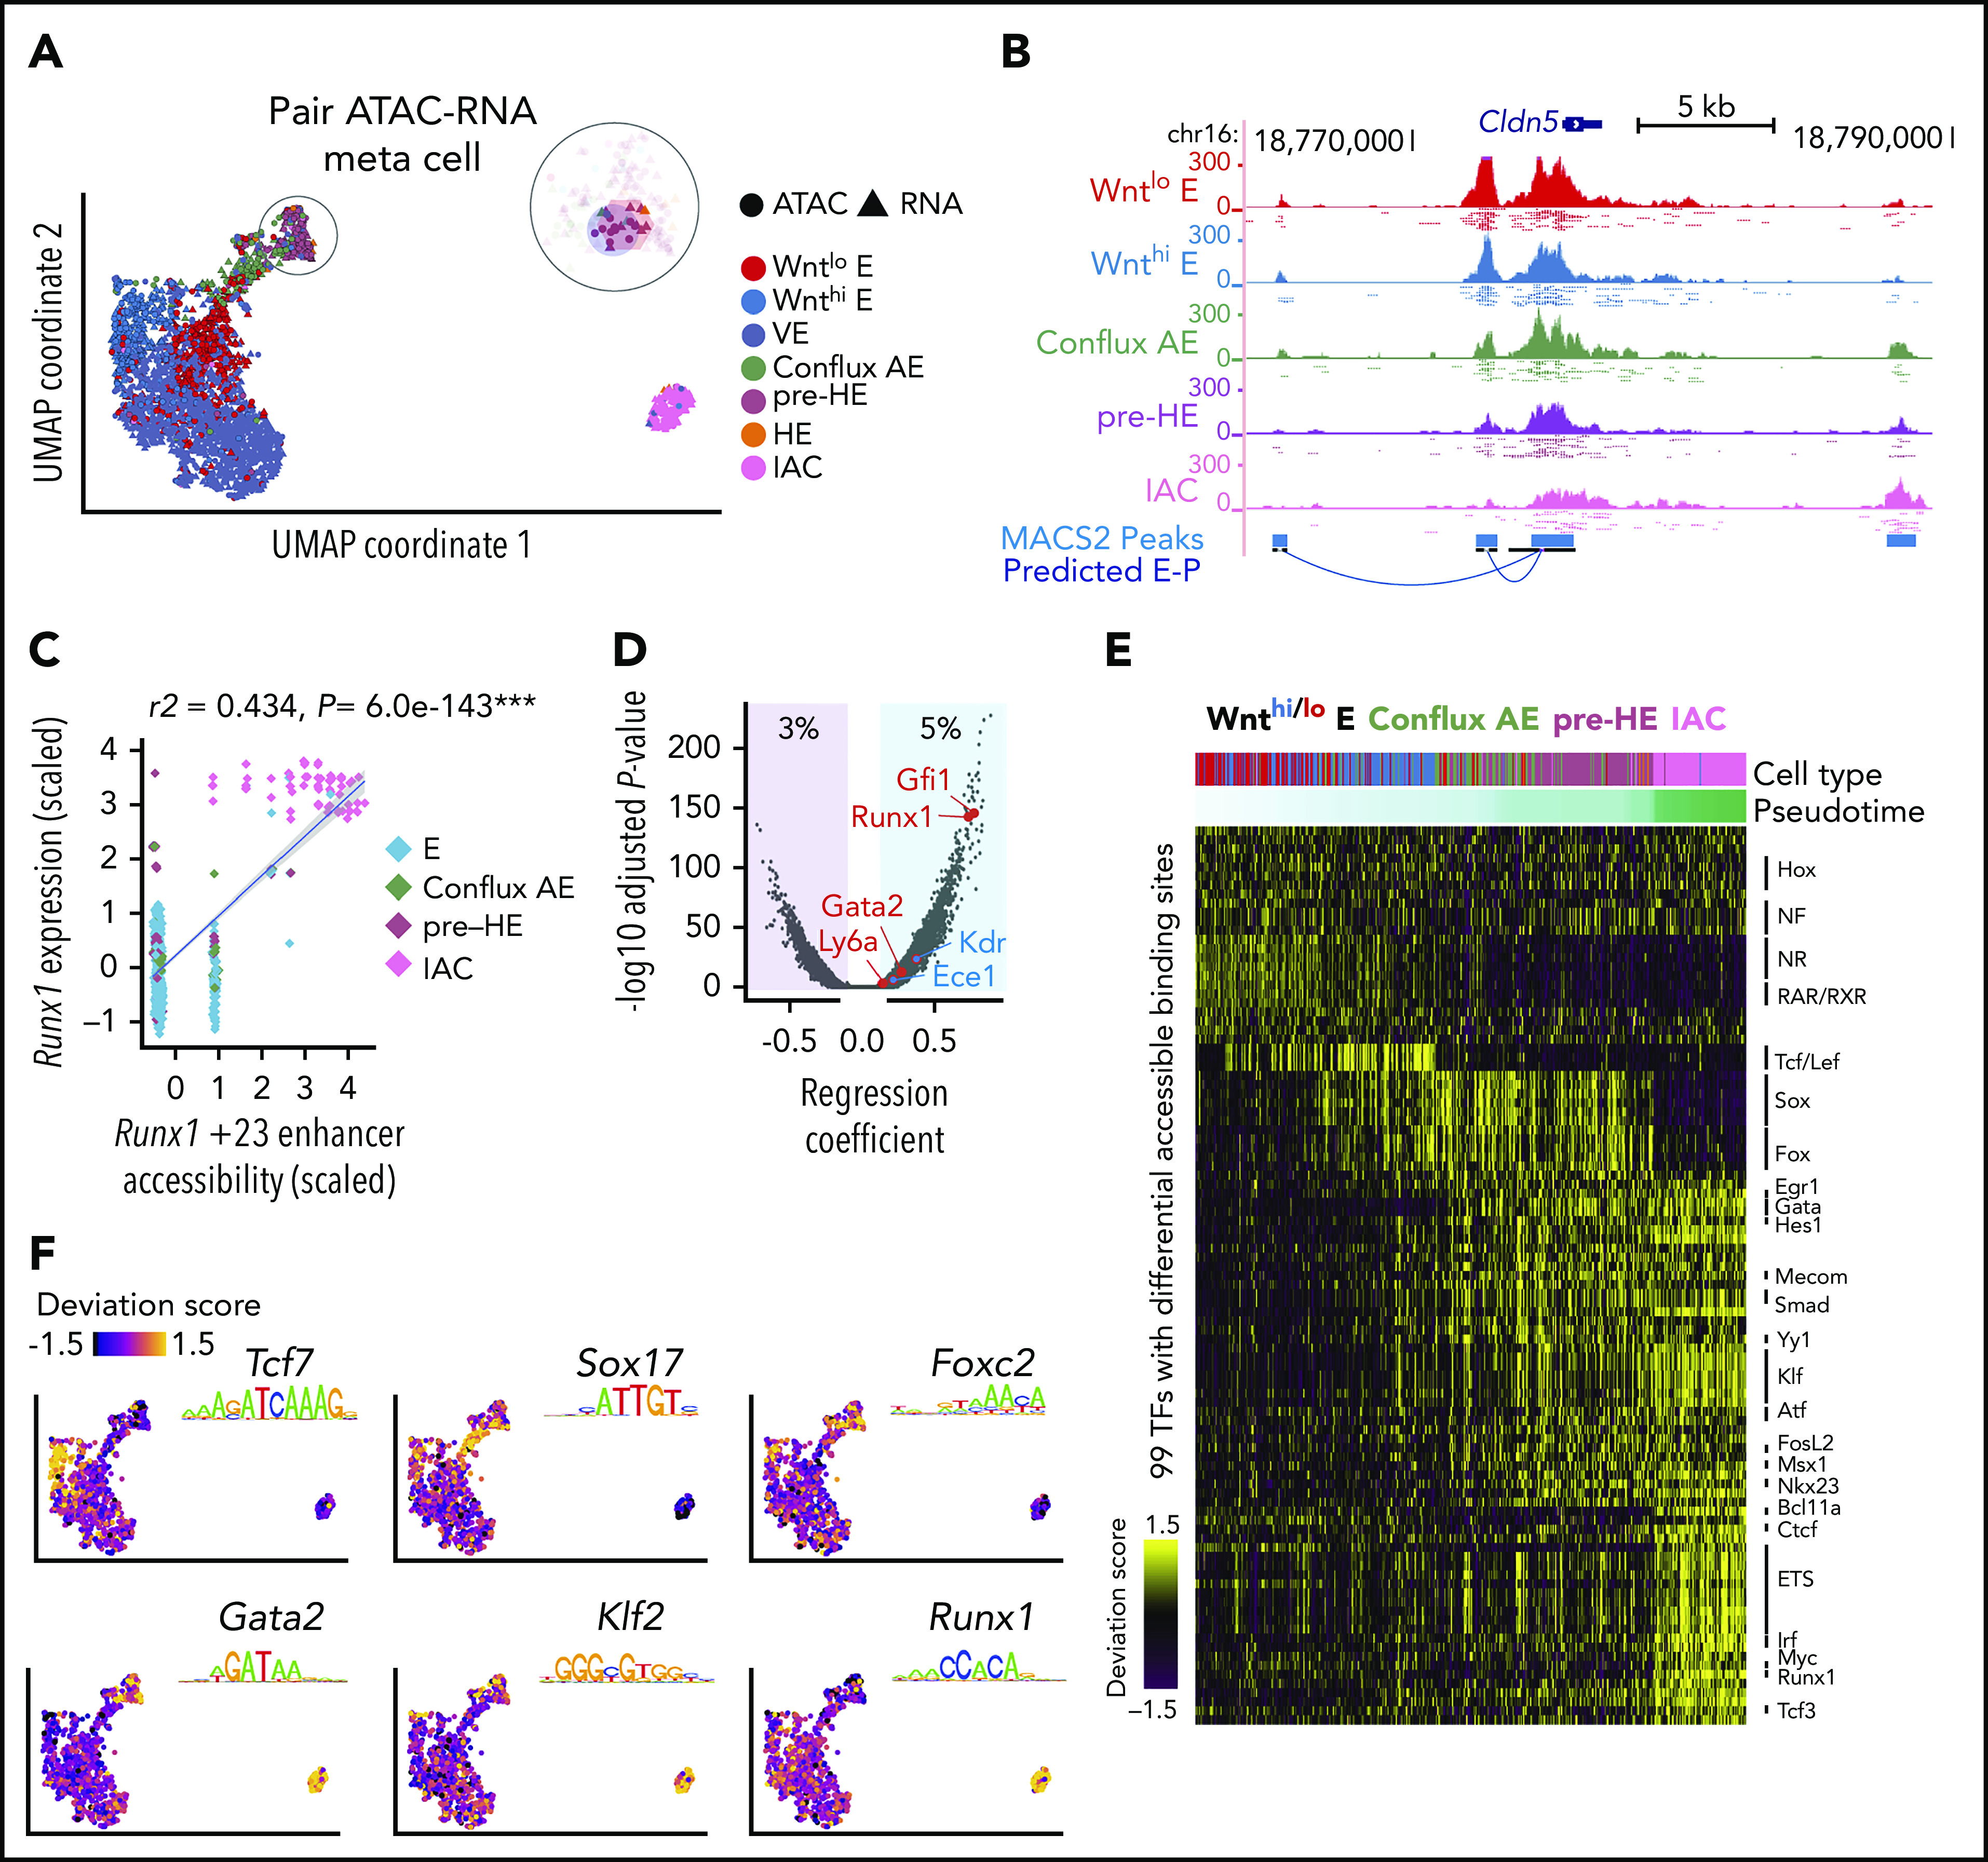
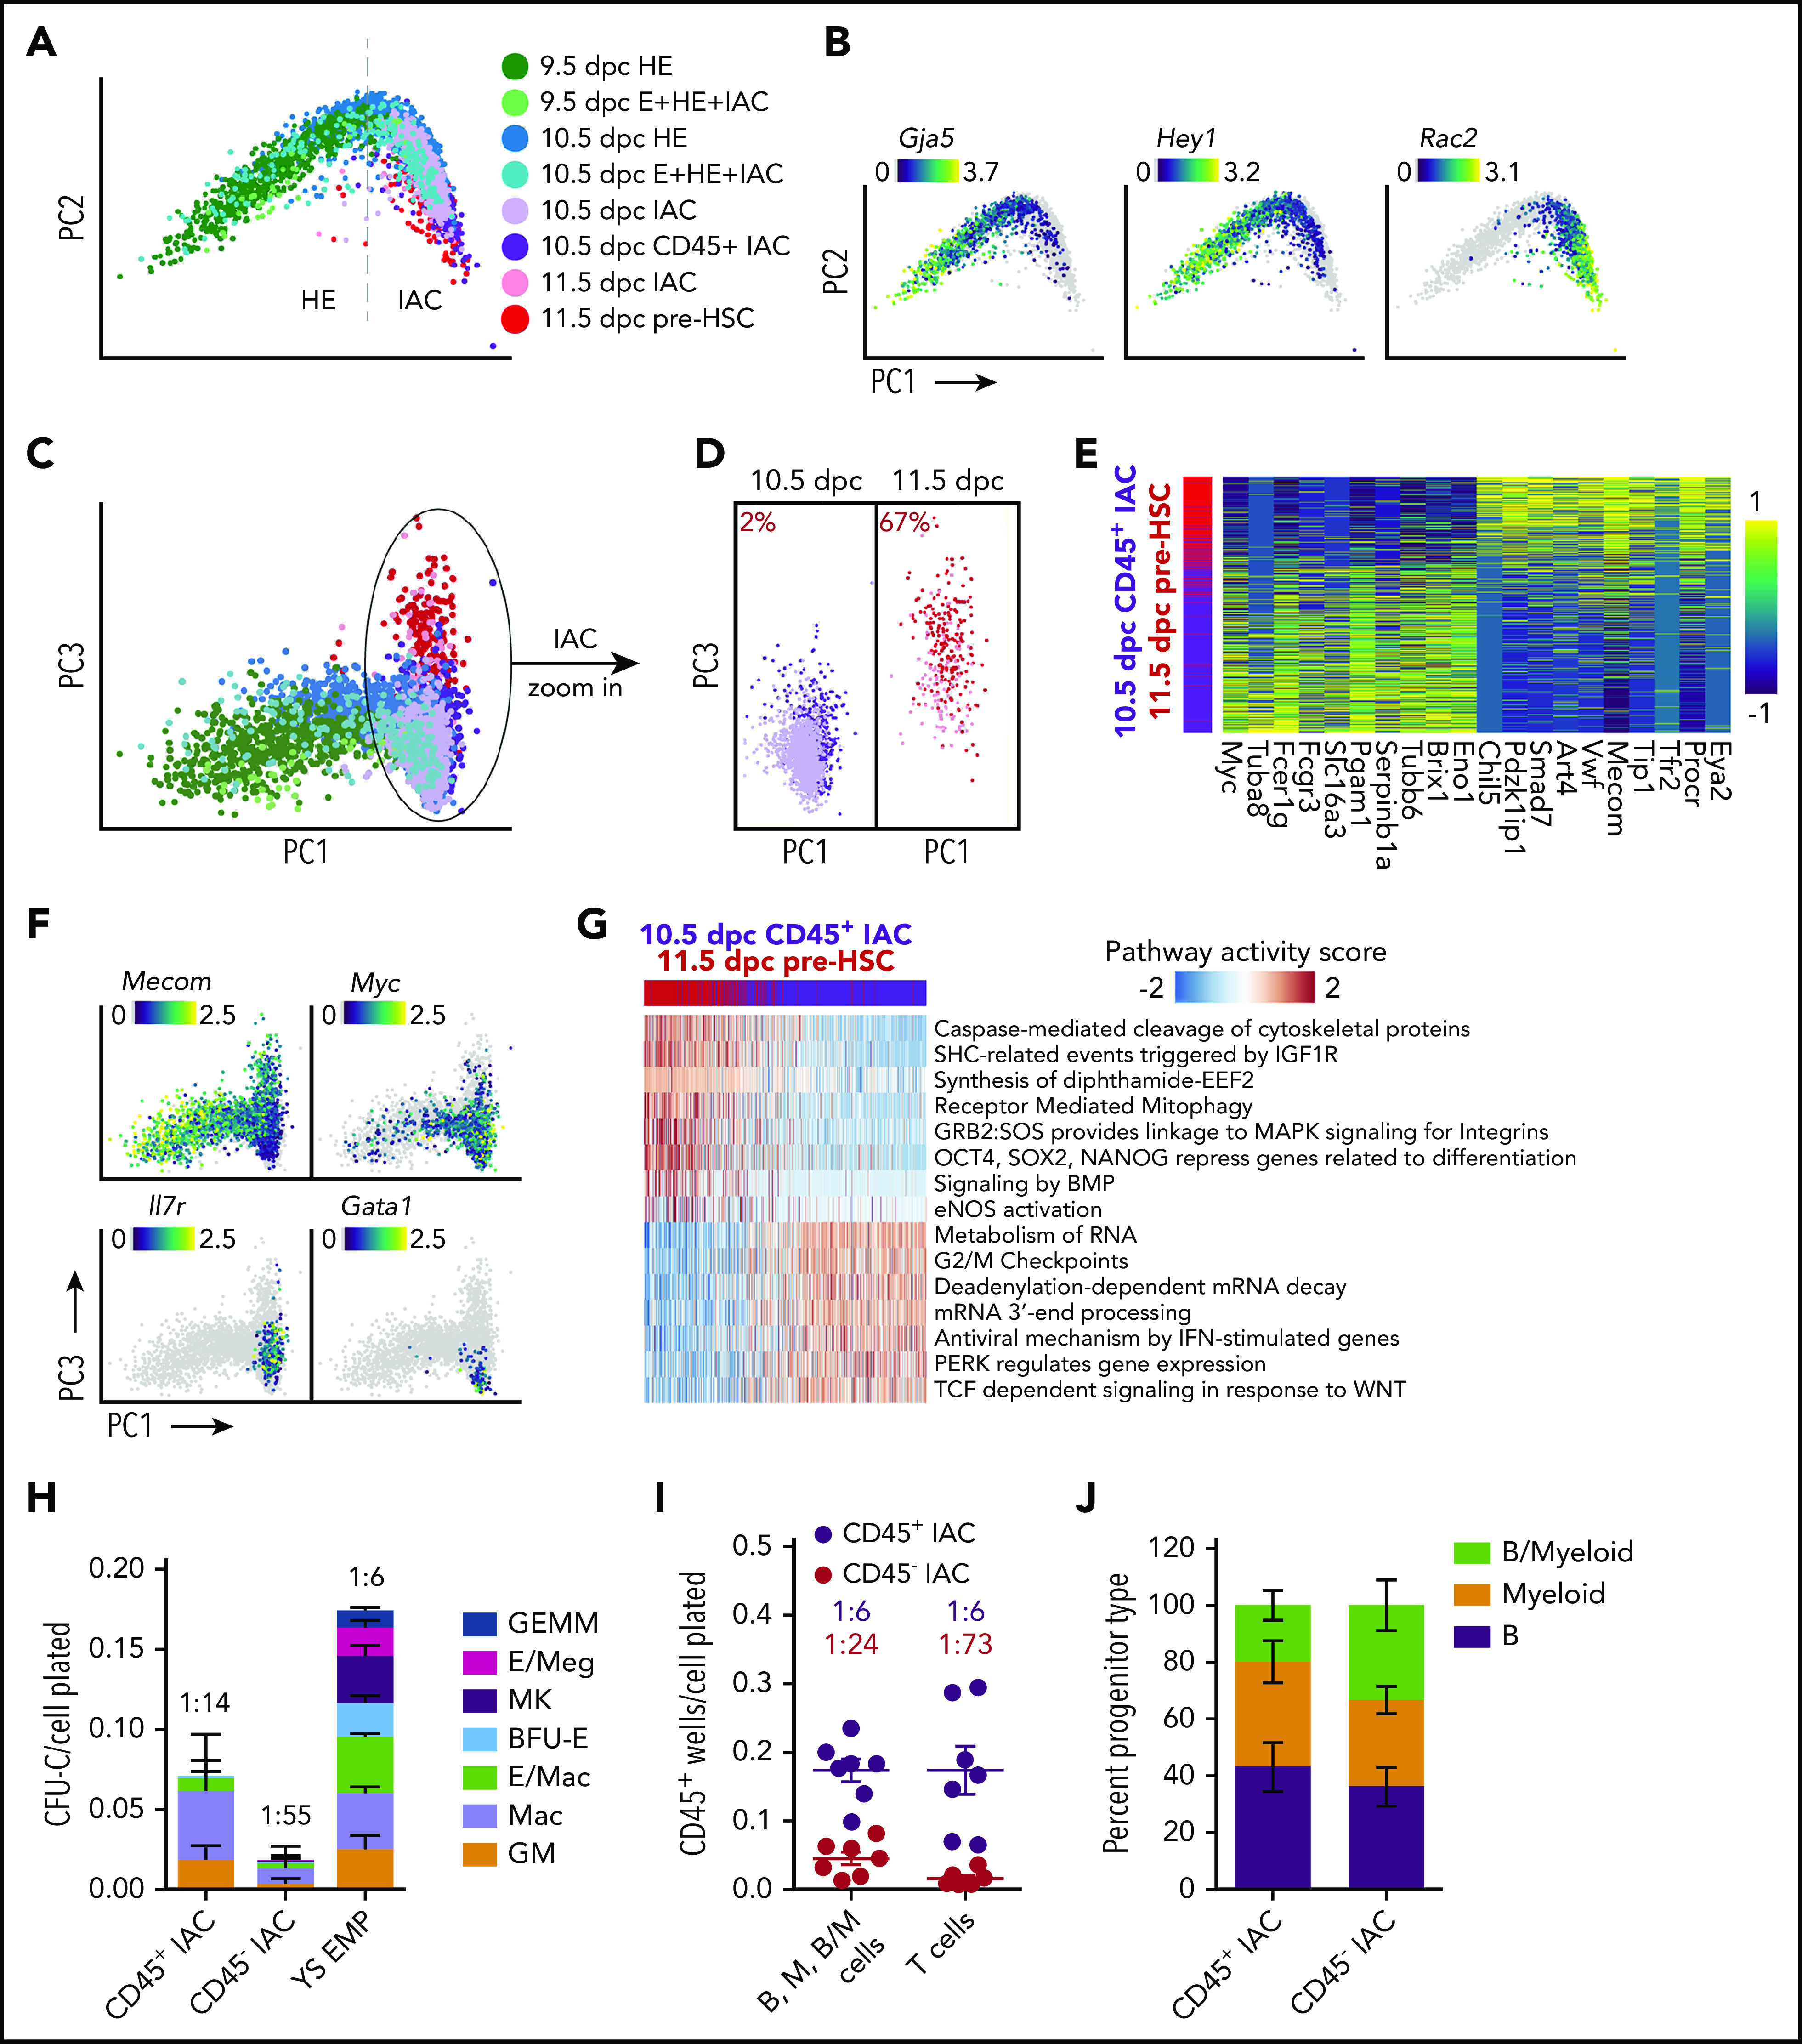
Hematopoietic stem and progenitor cells (HSPCs) in the bone marrow are derived from a small population of hemogenic endothelial (HE) cells located in the major arteries of the mammalian embryo. HE cells undergo an endothelial to hematopoietic cell transition, giving rise to HSPCs that accumulate in intra-arterial clusters (IAC) before colonizing the fetal liver. To examine the cell and molecular transitions between endothelial (E), HE, and IAC cells, and the heterogeneity of HSPCs within IACs, we profiled ∼40 000 cells from the caudal arteries (dorsal aorta, umbilical, vitelline) of 9.5 days post coitus (dpc) to 11.5 dpc mouse embryos by single-cell RNA sequencing and single-cell assay for transposase-accessible chromatin sequencing. We identified a continuous developmental trajectory from E to HE to IAC cells, with identifiable intermediate stages. The intermediate stage most proximal to HE, which we term pre-HE, is characterized by increased accessibility of chromatin enriched for SOX, FOX, GATA, and SMAD motifs. A developmental bottleneck separates pre-HE from HE, with RUNX1 dosage regulating the efficiency of the pre-HE to HE transition. A distal candidate Runx1 enhancer exhibits high chromatin accessibility specifically in pre-HE cells at the bottleneck, but loses accessibility thereafter. Distinct developmental trajectories within IAC cells result in 2 populations of CD45+ HSPCs; an initial wave of lymphomyeloid-biased progenitors, followed by precursors of hematopoietic stem cells (pre-HSCs). This multiomics single-cell atlas significantly expands our understanding of pre-HSC ontogeny.


Conflict of interest statement

Conflict-of-interest disclosure: The authors declare no competing financial interests.

Figures

None
Graphical abstract
Figure 1.
Figure 1.
Experimental design and overview of single cell RNA-Seq data. (A) The caudal part of embryos was isolated (boundaries are illustrated with scissors), and then organs and gut tube removed. VU were isolated and included in the sample. The tissue was dissociated and cells were isolated by fluorescence-activated cell sorting, then analyzed by scRNA-Seq, scATAC-Seq, or in functional assays. All cell populations purified and sequenced are listed in supplemental Table 2; sort plots are shown in supplemental Figures 1 and 2. (B) The number of cells sequenced (x-axis) and genes per cell detected for representative samples. (C) UMAP of continuous EHT trajectory and FL-HSCs, with selected cell populations labeled. (D) Distribution of cells from each dataset in the UMAP reflecting EHT trajectory. (E) UMAP illustrating the 2 streams of E cells expressing high levels of the arterial marker Efnb2 that converge to form the stem leading to HE and IACs. (F) E+HE+IAC cells separately purified from the VU arteries, and from the DA within the caudal half of the embryo, highlighted on the global UMAP plot. (G) Cell count along the pseudotime trajectory. Bar graph quantifies results from a single sort of 10.5 dpc E+HE+IAC cells; heat maps below the graph show distribution of cells in all sorted cell populations.
Figure 2.
Figure 2.
Two streams of E cells converge before hemogenic endothelium. (A) UMAP of EHT trajectory (from Figure 1C, with FL-HSC removed) showing the 7 clusters identified by Louvain clustering in supplemental Figure 5A, with Wnthi E subdivided into Wnthi AE and Wnthi VE, plus Wntlo E subdivided into Wntlo AE and Wntlo VE based on the arterial/venous score determined as shown in panels B and C. (B) Enlarged UMAP highlighting the 2 streams of endothelial cells converging to conflux AE. Numbers in yellow circles represent pseudotime bins up to the point of convergence. The dotted gray line represents the boundary between AE and VE. (C) Arterial score vs venous score over pseudotime bins. Cluster VE from panel A is used as the first pseudotime bin. Curves are fitted for AE score and VE score of each branch using a generalized additive model. (D) Violin plots of expression of cluster-specific genes, including venous marker Nr2f2, arterial marker Sox17, Wntlo AE-specific gene Tmem255a, Wnthi AE-specific genes Foxq1 and Nkd1, and Notch ligand Dll4. (E) Average expression of Wntlo E, Wnthi E, and pre-HE-specific genes over pseudotime. Differentially expressed genes were derived by pairwise expression analysis between Wntlo E and Wnthi E. Pre-HE specific genes were derived by comparing pre-HE with Wntlo plus Wnthi E. (F) Heatmap showing stream-specific Reactome pathway activity over pseudotime. AUCell package was used to compute a pathway activity score for each cell. One vs the rest Student t test was used to identify group-specific pathways and the top 6 most significant pathways were plotted.
Figure 3.
Figure 3.
Developmental bottleneck between pre-HE and HE cells. (A) UMAP of E10.5 E+HE+IAC cells showing 9 cell types from Figure 2A. (B) Expression of key markers of clusters, including Hey2 in conflux AE and pre-HE, Cd44 in conflux AE, pre-HE, HE, and IACs; Ptprc in IACs; Gfi1 and Runx1 in HE and IACs; and high levels of Sox17 in conflux AE and pre-HE, with downregulation in HE. Note Runx1 is expressed at low levels in all subsets of endothelial cells. (C) Velocyto analysis revealing different differentiation dynamics along the EHT in ED10.5 E+HE+IAC cells. To the right is an enlargement velocity of pre-HE cells that have accumulated at the bottleneck between pre-HE and HE. (D) Activity of pathways from Kyoto Encyclopedia of Genes and Genomes database, computed for each cell using the AUCell method. (E) UMAP of E+HE+IAC cells from 10.5 dpc Runx1+/+ and Runx1+/− littermates. Bars at bottom depict the distribution of cells between conflux AE, pre-HE, combined HE, and IAC populations in 10.5 dpc Runx1+/+ and Runx1+/− littermates. P values indicate significant differences in the distributions of cells in pre-HE and HE in Runx1+/+ vs Runx1+/− samples based on proportion test. ***P < .001. (F) UMAP of E+HE+IAC cells from 10.5 dpc control embryos (cR1/+) and littermates ectopically expressing RUNX1 in all endothelial cells from the Rosa26 locus (Cre;cR1/+). Bars at bottom as in panel E. ***P < .001. (G) Limiting dilution assay to determine the frequency of HE in the CD44+ fraction of E+HE+IAC cells isolated from 10.5 dpc embryos (see supplemental Figure 2G for fluorescence-activated cell sorting plots). Shown are frequencies of cells that yielded hematopoietic cells (B220+, CD19+, Mac1+, Gr1+, and/or CD41 and CD45) ex vivo. Frequencies were calculated by ELDA. Data represent 3 independent cell purifications and limiting dilution assays (mean ± standard deviation [SD], unpaired 2-tailed Student t test).
Figure 4.
Figure 4.
Joint scRNA-Seq and scATAC-Seq analysis of bottleneck populations. (A) UMAP of 1637 cells from scRNA-Seq and 1,186 cells from scATAC-Seq, aligned using Seurat algorithm with a custom defined gene-by-cell activity score matrix (see supplemental Methods). The number of HE cells was too few to be resolved by UMAP and was clustered with pre-HE. To gain enough statistical power for predicting E-P, we pooled reads from 10 nearest neighbors as “meta cells,” and paired scATAC meta cells to nearby scRNA meta cells. Additional details can be found in the supplemental Methods section. (B) UCSC genome browser tracks showing open chromatin signal of Cldn5 promoter and its predicted enhancers. Dots below each aggregated signal track represent signal from 50 sampled cells of each type. (C) Linear regression shows high correlation between Runx1 +23 enhancer chromatin accessibility and Runx1 expression levels (z-score transformed). Each point represents a paired ATAC-RNA meta cell in panel A, with pooled RNA expression on the y-axis and pooled enhancer accessibility on the x-axis. (D) Prediction of E-P interaction using linear regression. Predictions (points in blue shaded area, 5% of total candidate interactions) were made using P < .01 and regression coefficient >0.1. We recapitulated the majority of known E-P interactions that function during EHT, with the Runx1 +23 enhancer and Gfi1 enhancer among the top predictions. (E) TF binding patterns among called scATAC-Seq peaks assessed using chromVar, which defines a deviation score reflecting the accessibility change at binding sites of each TF across all cells. Binding sites were determined using DNA motif scan on the called enhancers, which does not discriminate TFs in the same family with very similar motifs. Top significant TFs based on Mann-Whitney U test are plotted for each stage. (F) ChromVar deviation score for selected TF motifs plotted on the UMAP, showing specific binding pattern for Tcf7 in Wnthi E, Sox17 in conflux E, Foxc2 in pre-HE, Gata2, and Klf2 in both pre-HE and IAC. Runx1 binding sites are highly accessible after bottleneck, but also exhibit medium to high level of chromatin accessibility in some early stage cells.
Figure 5.
Figure 5.
Developmental-stage-specific enhancers of Runx1. (A) UCSC genome browser tracks showing open chromatin signal for each of the populations. Tracks from E to IAC are cumulative scATAC-Seq signals (per-base unique fragment coverage) normalized by the number of cells in that population. Tracks for FL-HSC are bulk ATAC-Seq data from Chen et al. Experimentally validated enhancers and E-Ps from Marsman et al are shown in magenta. Enhancers and E-P links from Chen et al are shown in dark green. E-P links were inferred based on linear regression on paired scRNA-scATAC meta cells (supplemental Methods). Placental mammal conservation by PhastCons score is shown as a gray track. For each of the inferred enhancers, we scanned for known motifs from CIS-BP database and grouped TFs from the same family having similar motifs. Motif hits of several previously reported early hematopoietic TFs are highlighted below the track. (B) Distribution of linear regression P values for predicted Runx1 enhancers. Highly significant peaks include the validated +23 and −371 enhancers. The most significant peak is ∼3.6 kb downstream of P1. (C) Coaccessibility of Runx1 P1 promoter and its predicted linked enhancers in each cell type. P values for coaccessibility in each cell type were computed using Fisher exact test with multiple testing correction. (D) Stage-specific chromatin accessibility of Runx1 −371 enhancer and Runx1 expression levels (z-score transformed). Each point in the scatter plot represents a paired ATAC-RNA meta cell in Figure 5A, with pooled RNA expression on the y-axis and pooled enhancer accessibility on the x-axis. A 2-dimensional density plot is superimposed on the scatter plot. (E) Coexpression of transcription factors that have binding motifs at Runx1 enhancers and whose expression precedes Runx1. Correlations were computed using gene expression matrix including conflux E, pre-HE, and HE cells. TFs with Pearson correlation with Runx1 <0.05 were removed. Hierarchical clustering was performed on the correlation matrix and a strong TF coexpression module was highlighted.
Figure 6.
Figure 6.
Two waves of CD45+ HSPCs in IAC cells. (A) PCA plot of a subset of data containing IACs, illustrating the trajectory of IAC differentiation from HE along the PC1 axis. (B) Expression of Gja5, Hey1, and Rac2 illustrating the maturation of IAC cells along the trajectory. (C) PCA plot showing the separation of 10.5 and 11.5 dpc IAC cells along the PC3 axis. (D) 10.5 and 11.5 dpc IAC cells, 10.5 dpc CD45+ IAC cells, and 11.5 dpc pre-HSCs plotted separately to visualize their relative distribution along the PC3 axis. A k-nearest-neighbor classifier (k = 3 with PC1-10 as feature input) was trained using 10.5 dpc CD45+ IAC cells and 11.5 dpc pre-HSCs to determine the fraction of pre-HSCs (red) in 10.5 and 11.5 dpc IAC cells. (E) Heatmap showing top differentially expressed genes in 10.5 dpc CD45+ IAC cells vs 11.5 dpc pre-HSCs. (F) Preferential expression of Mecom in 11.5 dpc pre-HSCs and IAC cells vs Myc, Il7r, and Gata1 in 10.5 dpc CD45+ IAC enriched for lymphomyeloid-biased progenitors and in 10.5 dpc IAC cells. (G) Reactome pathway analysis comparing 11.5 dpc pre-HSC and 10.5 dpc CD45+ IAC cells. Color indicates pathway activity score computed using the AUCell package. (H) Methylcellulose (colony forming unit-culture, CFU-C) assay performed in the presence of stem cell factor (SCF), interleukin 3 (IL-3), IL-6, and erythropoietin (EPO) to measure the frequency of committed erythroid and myeloid progenitors in 10.5 dpc CD45+ IAC cells, CD45 IAC cells, and 9.5 dpc yolk sac EMPs. BFU-E, burst forming unit-erythroid; GEMM, granulocyte/erythroid/monocyte/megakaryocyte; GM, granulocyte/macrophage; Mac, macrophage; MK, megakaryocyte. Values and error bars are mean ± SD; n= 3 experiments. Frequencies of total progenitors are indicated above the bars. (I) Limiting dilution assays on OP9 stromal cells to determine the frequencies of progenitors in purified 10.5 dpc CD45+ IAC and 10.5 dpc CD45 IAC cells yielding B (CD45+CD19+B220mid/lo), myeloid (M) (Gr1+Mac1+ or Gr1+Mac1), and B+myeloid (B/M) cells in culture. Also shown are frequencies of progenitors in purified 10.5 dpc CD45+ IAC and 10.5 dpc CD45 IAC cells that produced T cells (CD90+ CD25+) when cultured on OP9 cells expressing the Notch ligand delta-like 1. Error bars; mean ± SD. Values and error bars are mean ± SD; n = 7. Frequencies of all progenitors are indicated above the bars. (J) Percentage of wells at the limiting cell dose containing B, M, or B/M cells from experiments in panel I. Values and error bars are mean ± SD; n = 8 experiments.

Comment in

References

    1. Hadland B, Yoshimoto M. Many layers of embryonic hematopoiesis: new insights into B-cell ontogeny and the origin of hematopoietic stem cells. Exp Hematol. 2018;60:1-9. - PMC - PubMed
    1. Auerbach R, Huang H, Lu L. Hematopoietic stem cells in the mouse embryonic yolk sac. Stem Cells. 1996;14(3):269-280. - PubMed
    1. Vanhee S, De Mulder K, Van Caeneghem Y, et al. In vitro human embryonic stem cell hematopoiesis mimics MYB-independent yolk sac hematopoiesis. Haematologica. 2015;100(2):157-166. - PMC - PubMed
    1. Goode DK, Obier N, Vijayabaskar MS, et al. Dynamic gene regulatory networks drive hematopoietic specification and differentiation. Dev Cell. 2016;36(5):572-587. - PMC - PubMed
    1. Baron CS, Kester L, Klaus A, et al. Single-cell transcriptomics reveal the dynamic of haematopoietic stem cell production in the aorta. Nat Commun. 2018;9(1):2517. - PMC - PubMed

Publication types

MeSH terms

Substances