. 2020 Jun 16;52(6):1039-1056.e9.
doi: 10.1016/j.immuni.2020.04.005. Epub 2020 May 8.

Inflammatory Type 2 cDCs Acquire Features of cDC1s and Macrophages to Orchestrate Immunity to Respiratory Virus Infection

Affiliations

Inflammatory Type 2 cDCs Acquire Features of cDC1s and Macrophages to Orchestrate Immunity to Respiratory Virus Infection

Cedric Bosteels et al. Immunity. .

Abstract

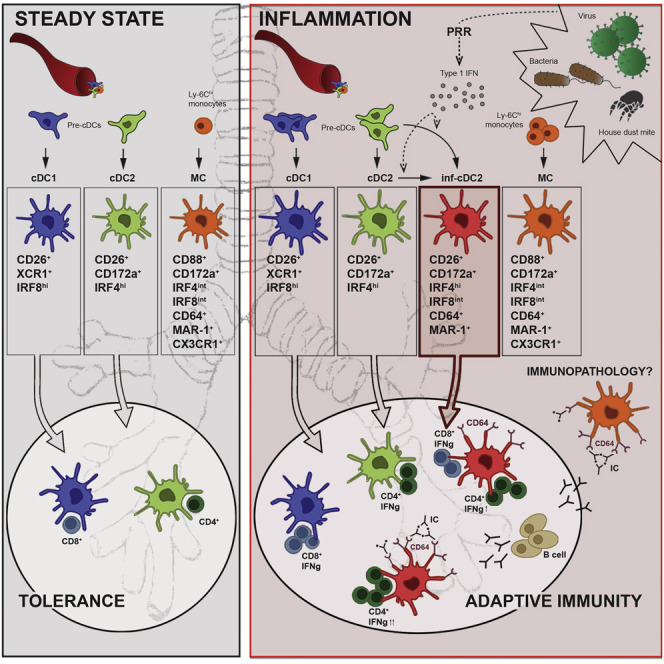
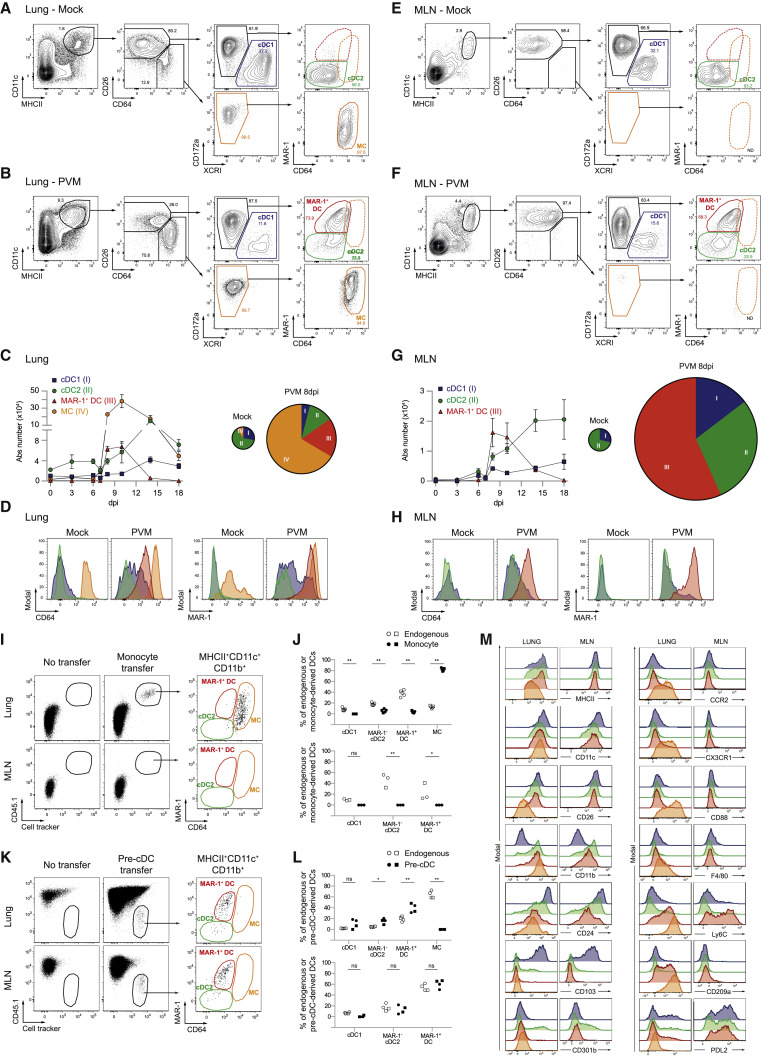
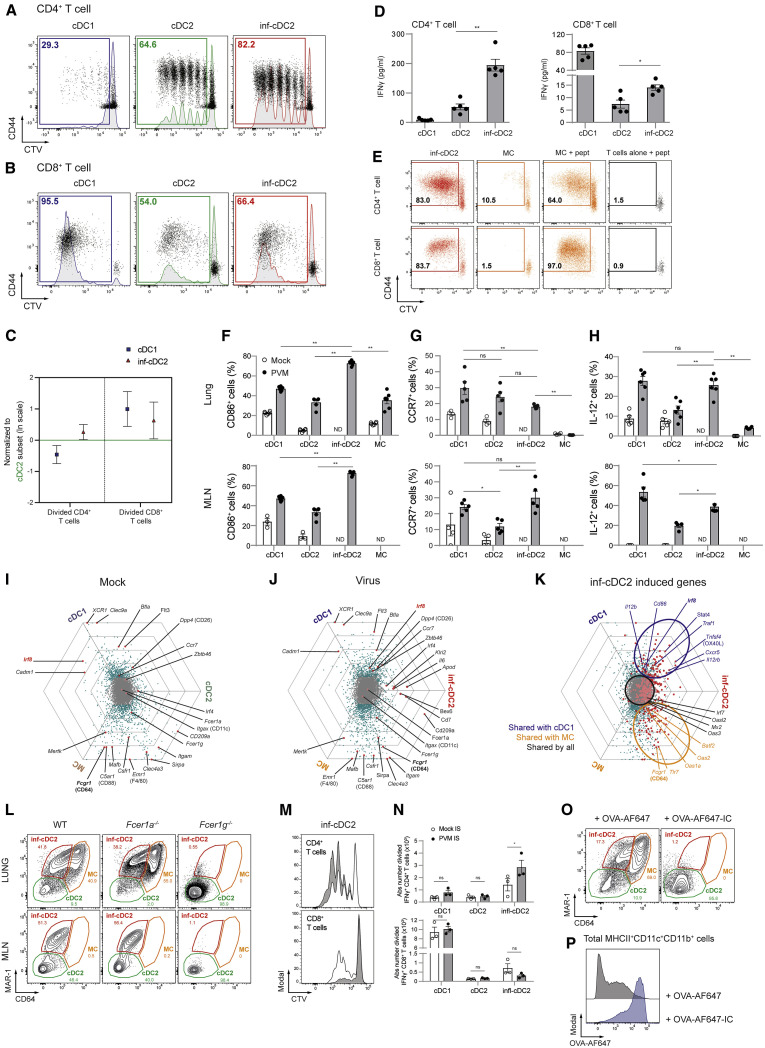
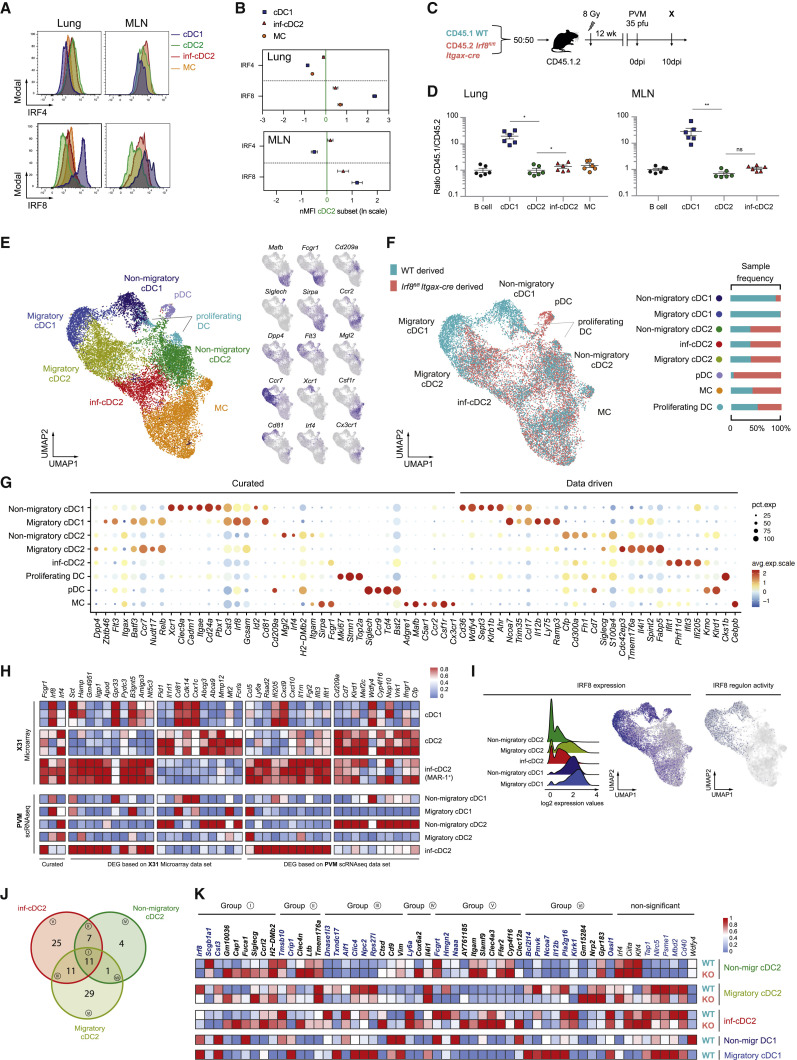
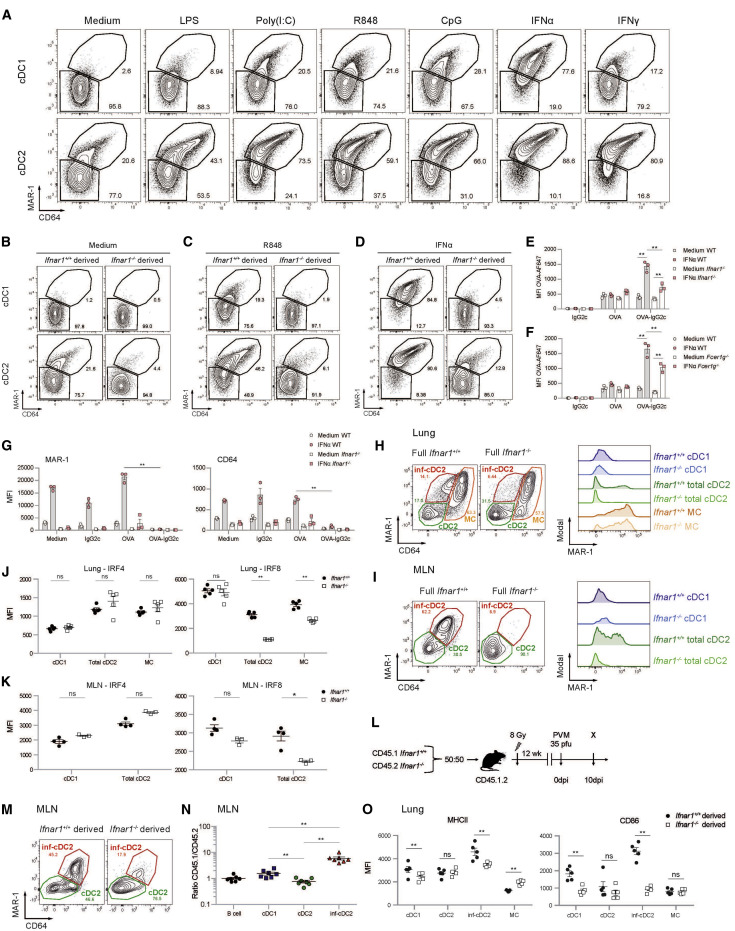
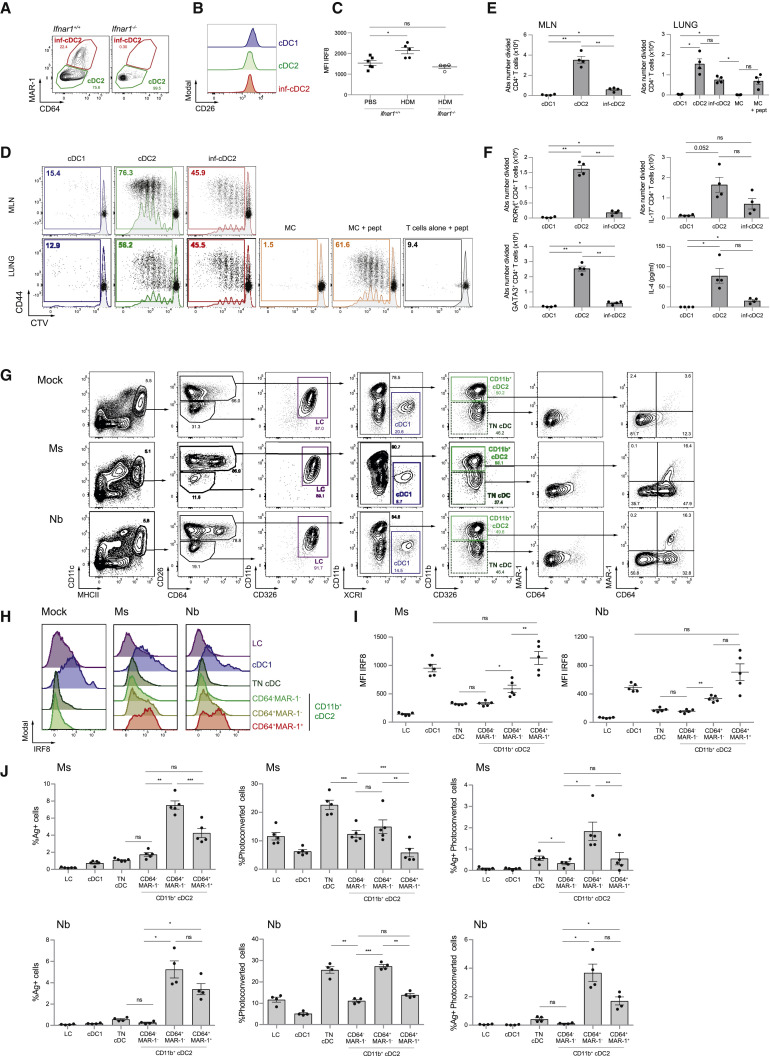
The phenotypic and functional dichotomy between IRF8+ type 1 and IRF4+ type 2 conventional dendritic cells (cDC1s and cDC2s, respectively) is well accepted; it is unknown how robust this dichotomy is under inflammatory conditions, when additionally monocyte-derived cells (MCs) become competent antigen-presenting cells (APCs). Using single-cell technologies in models of respiratory viral infection, we found that lung cDC2s acquired expression of the Fc receptor CD64 shared with MCs and of IRF8 shared with cDC1s. These inflammatory cDC2s (inf-cDC2s) were superior in inducing CD4+ T helper (Th) cell polarization while simultaneously presenting antigen to CD8+ T cells. When carefully separated from inf-cDC2s, MCs lacked APC function. Inf-cDC2s matured in response to cell-intrinsic Toll-like receptor and type 1 interferon receptor signaling, upregulated an IRF8-dependent maturation module, and acquired antigens via convalescent serum and Fc receptors. Because hybrid inf-cDC2s are easily confused with monocyte-derived cells, their existence could explain why APC functions have been attributed to MCs.

Keywords: CD64; Fc receptor; IRF8; convalescent serum; dendritic cell; inf-cDC2; inflammation; monocyte; transcription factor; type 1 interferon; virus.


Conflict of interest statement

Declaration of Interests The authors declare no competing interests.

Figures

None
Graphical abstract
Figure 1
Figure 1
CD26+MAR-1+CD64+ DCs Are Induced after Pneumovirus Infection (A and B) Gating strategy of lung DC subsets pre-gated on live CD3CD19 non-autofluorescent cells in mock-infected controls (A) or 8 dpi with PVM (B). cDC1s are shown in blue, cDC2s in green, MAR-1+ DCs in red, and MCs in orange gates. These colored gates are maintained throughout the manuscript. (C) Kinetics of different lung DC subset numbers upon PVM infection (left panel) and pie charts depicting relative distribution of DC subsets in the lung upon mock or 8 dpi PVM infection (right panel) (see also Figure S1A). Error bars indicate ± SEM. (D) Surface expression of CD64 and MAR-1 on different DC subsets in the lung 8 dpi with PVM. (E and F) Gating strategy of migratory MHCIIhi DC subsets in MLNs pre-gated on live CD3CD19 cells in mock-infected controls (E) or 8 dpi with PVM (F). (G) Kinetics of different migratory DC subset numbers in MLNs upon PVM infection (left panel) and pie charts depicting relative distribution of DC subsets in MLNs upon mock or 8 dpi PVM infection (right panel) (see also Figure S1B). (H) Surface expression of CD64 and MAR-1 on different DC subsets in MLN 8 dpi with PVM. (I) CD45.1.2 monocytes were sorted from eFl450+ cell tracker-labeled BM and transferred intravenously (i.v.) into CD45.2 Ccr2−/− recipient mice at 1 dpi with IAV. Four days later, donor cells were identified in the lungs and MLNs (see also Figures S1C–S1H). (J) Distribution of different DC subsets in the endogenous population (white) and adoptively transferred monocyte-derived population (black) in the lungs (top panel) and MLNs (bottom panel). (K) Pre-cDCs were sorted from eFl450+ CellTrace™ Violet (CTV)-labeled BM from FLT3L-treated CD45.2 WT mice and transferred i.v. into CD45.1.2 WT mice at 1 dpi with IAV. Four days later, donor cells were identified in the lungs and MLNs (see also Figures S1C–S1F). (L) Distribution of different DC subsets in the endogenous population (white) and adoptively transferred pre-cDC-derived population (black) in the lungs (top panel) and MLNs (bottom panel). (M) Histograms showing surface expression of commonly used DC and macrophage markers on different DC subsets in the lungs and MLNs 8 dpi with PVM. (A–H) Data are representative of at least 2 or 3 independent experiments with 4–6 mice per group. The size of the pie chart is proportional to the absolute number of DCs in the lungs (C) or MHCIIhi DCs in MLNs (G). (I–L) Data pooled from 2 independent experiments (circles and squares, n = 5 in total), analyzed with a two-way ANOVA with Sidak correction for multiple comparisons. p < 0.05, ∗∗p < 0.01; ns, not statistically significant.
Figure 2
Figure 2
Activated inf-cDC2s Share Characteristics with cDC1 and MC Subsets (A and B) Proliferation profile of CTV-labeled CD4+ (A) and CD8+ (B) PVM-specific TCR transgenic T cells cocultured for 4 days with different migratory cDC subsets sorted from 4–6 pooled MLNs 8 dpi with PVM (see also Figures S1K–S1P). (C) Number of divided CD4+ and CD8+ PVM TCR transgenic T cells cocultured for 4 days with different migratory cDC subsets sorted from MLNs 8 dpi with PVM relative to the cDC2 subset, which is set to 0. Error bars represent 95% confidence intervals. Data were pooled from 3 independent experiments (n = 5–7). (D) IFN-γ measured in supernatants of cocultured CD4+ and CD8+ PVM TCR transgenic T cells for 4 days with different MLN-derived cDC subsets sorted 8 dpi with PVM. Data are representative of 3 independent experiments. Error bars indicate ± SEM. Mann-Whitney U test; p < 0.05, ∗∗p < 0.01. (E) Proliferation profile of CTV-labeled CD4+ and CD8+ PVM TCR transgenic T cells cocultured for 4 days with T cells alone, inf-cDC2s, or MCs sorted from 3 pooled lungs 8 dpi with PVM. For peptide controls, 1 μg/mL of CD4+ (M37–M47) or CD8+ (N339–N347) immunodominant epitope was added ex vivo. (F–H) Percentage of CD86-expressing (F) and CCR7-expressing (G) and IL-12-producing (H) lung or migratory DC subsets in MLNs upon mock infection (white circles) or 10 dpi with PVM (black dots). For IL-12 staining, samples were restimulated ex vivo for 6 h. Data are representative of 2 independent experiments with 3–6 mice per group, analyzed with a two-way ANOVA with Sidak correction for multiple comparisons. Error bars indicate ± SEM. p < 0.05, ∗∗p < 0.01; ns, not statistically significant. (see also Figure S1J). (I–K) To visualize DEG between DC subsets sorted from the lungs 4 dpi after mock (I) and IAV infection (J) and those induced in inf-cDC2s (K), each gene was plotted in a hexagonal triwise diagram in which the direction of a point represents the relative higher expression in one or two populations, whereas the distance from the origin represents the magnitude of expression. Genes that are 32-fold or more differentially expressed are plotted on the outer grid line. Genes represented by gray dots in the center of the triwise plot are not differentially expressed (see also Figures S2A–S2D). (L) MAR-1 and CD64 staining of live CD3CD19MHCII+CD11c+CD172a+ cells 8 dpi with PVM in the lungs and MLNs of WT, Fcer1a−/−, and Fcer1g−/− mice. (M) Proliferation profile of CTV-labeled CD4+ and CD8+ PVM TCR transgenic T cells cocultured for 4 days with different migratory cDC subsets sorted from 4 pooled MLNs 8 dpi with PVM from mice that received mock (white) or PVM (gray) IS i.t. 6 dpi. (N) Absolute number IFNγ+ CD4+ and CD8+ PVM TCR transgenic T cells cocultured for 4 days with different migratory cDC subsets sorted from 4 pooled MLNs 8 dpi with PVM from mice that received mock (white) or PVM (gray) IS i.t. 6 dpi. Two-way ANOVA with Sidak correction for multiple comparisons. Error bars indicate ± SEM. p < 0.05, ∗∗p < 0.01; ns, not statistically significant. (see also Figures S3A and S3B). (O and P) MAR-1 and CD64 staining of live CD3CD19MHCII+CD11c+CD11b+ cells (O) 8 dpi with PVM in lungs of mice treated i.t. at 6 dpi with 50 μg Alexa Fluor 647 (AF647)-labeled OVA administered alone (left panel) or as OVA-AF647-IgG2c-IC (right panel) and the respective uptake of OVA-AF647 by these cells (P) (see also Figures S3C and S3D).
Figure 3
Figure 3
IRF8 Controls the Gene Network in inf-cDC2s (A) Expression of IRF4 (top panel) and IRF8 (bottom panel) by different DC subsets in the lungs and MLNs 10 dpi with PVM. (B) Normalized Median Fluoresent Intensity (MFI) for IRF4 and IRF8 relative to the cDC2 subset, which is set to 0 for DC subsets in the lungs (top panel) or the different migratory cDC subsets in MLNs (bottom panel) 10 dpi with PVM. Error bars represent 95% confidence intervals. Data are representative of 3 independent experiments with 4–6 mice per group. (C) Schematic representation of CD45.1 WT:CD45.2 Irf8fl/flItgax-cre BM chimeras. (D) Normalized CD45.1/CD45.2 ratio relative to B cells of DC subsets in the lungs (left panel) and migratory cDCs in MLNs (right) 10 dpi with PVM. Data are representative of 2 independent experiments with 4–6 mice per group, analyzed with a one-way ANOVA with Sidak correction for multiple comparisons. Error bars indicate ± SEM. p < 0.05, ∗∗p < 0.01; ns, not statistically significant. (E) UMAP plot of scRNA-seq data of pooled, sorted, live CD3-CD19-SiglecF-CD11c+MHCII+ cells from lungs of CD45.1 WT:CD45.2 Irf8fl/flItgax-cre chimeric mice 10 dpi with PVM, showing assigned clusters, and UMAPs showing expression of key annotation markers by color (gray, low expression; blue, high expression) (see also Figures S5A–S5C). (F) UMAP plot overlay (left panel) similar to (E) but with the colors representing origin of the WT (teal) or Irf8fl/flItgax-cre (red) compartment and sample frequency per cluster (right panel). (G) Dot plot heatmap showing expression of selected (curated) and top DEG (data driven) per cluster. The dot size represents the percentage of cells expressing the gene, and the color represents the average expression of that gene within a cluster. (H) Heatmap showing relative expression of the top DEG retrieved from a microarray dataset of cDC2s and inf-cDC2s sorted from IAV-infected lungs 4 dpi, plotted on lung inf-cDC2s, migratory and non-migratory cDC1 and cDC2 clusters of an scRNA-seq dataset 10 dpi with PVM, and vice versa. Relative expression was calculated by transforming the normalized expression values to a 0-1 scale for each gene separately. (I) Histogram showing Irf8 RNA expression profiles of different lung cDC clusters derived from the WT compartment of WT:Irf8fl/flItgax-cre chimeras 10 dpi with PVM (left panel), UMAP showing Irf8 expression (center panel), and a UMAP plot showing Irf8 regulon activity as predicted by SCENIC (right panel) on lung cells derived from the WT and Irf8−/− compartments. Cells in which the Irf8 regulon is active (i.e., regulon activity exceeds a regulon-specific area under the curve [AUC] threshold) are shown in blue. (J) Venn diagram detailing overlap between different cDC2 subsets of Irf8-dependent DEG reaching a log-fold change of ± 0.25. (K) Heatmap of normalized expression of Irf8-dependent genes in cDC2 subsets derived from lungs of CD45.1 WT:CD45.2 Irf8fl/flItgax-cre chimeric mice 10 dpi with PVM. Genes with a log fold-change lower than −0.25 (i.e., intrinsically induced by IRF8) are shown in bold blue, and genes with a log fold-change higher than 0.25 (i.e., intrinsically suppressed by IRF8) are shown in bold black. Group names are based on the cDC2 subsets in which the log fold threshold was reached (J).
Figure 4
Figure 4
MAR-1, CD64, and IRF8 Are Induced in a Type I IFN-Dependent Manner in cDC2s (A) On day 8, Flt3L bone marrow dendritic cells (BMDCs) were stimulated with LPS (200 ng/mL), poly(I:C) (1,000 ng/mL), R848 (10 ng/mL), CpG (100 ng/mL), IFNα (200 ng/mL), or IFNγ (200 ng/mL). cDCs were harvested 20 h later and analyzed for expression of MAR-1 and CD64. (B–D) Flt3L culture of a 50:50 mix of CD45.1 WT (Ifnar1+/+) and CD45.2 Ifnar1−/− DCs that was unstimulated (B) or stimulated with R848 (C) or IFNα (D) and harvested 20 h later (see also Figures S3E and S3F). (E–G) Uptake of OVA-AF647 (10 μg/mL) added alone or as OVA-AF647-IgG2c-IC to Flt3L culture of a 50:50 mix of CD45.1 WT and CD45.2 Ifnar1−/− (E) or Fcer1g−/− (F) type 2 cDCs and surface expression (MFI) of MAR-1 and CD64 (G) on Flt3L (un)stimulated WT and Ifnar1−/− BM-derived type 2 cDCs 20 h after addition of OVA-AF647 (10 μg/mL) alone or as OVA-AF647-IgG2c-IC. Data are representative of 3 independent experiments with 3 mice per group, analyzed with a two-way ANOVA with Sidak correction for multiple comparisons. Error bars indicate ± SEM. ∗∗p < 0.01 (see also Figures S3G and S3H). (H and I) Flow cytometry plots pre-gated on live CD3CD19CD172a+ DCs in the lungs (H) and migratory DCs in MLNs (I) of WT (Ifnar1+/+) and Ifnar1−/− mice 10 dpi with PVM. Histograms show expression of MAR-1 on the different DC subsets (see also Figures S2H–S2J). (J and K) Expression of IRF4 and IRF8 shown as MFI by DC subsets in the lungs (J) and MLNs (K) of WT (Ifnar1+/+) and Ifnar1−/− mice 4 dpi with IAV. Data are representative of 2 independent experiments with 4–5 mice per group and were analyzed with a two-way ANOVA with Sidak correction for multiple comparisons. p < 0.05, ∗∗p < 0.01; ns, not statistically significant. (L) Schematic representation of CD45.1 WT:CD45.2 Ifnar1−/− BM chimeras. (M) Flowcytometry plots pre-gated on WT (Ifnar1+/+) or Ifnar1−/−−derived live CD3CD19 migratory CD172a+ DCs in MLNs of CD45.1 WT:CD45.2 Ifnar1−/− chimeric mice 10 dpi with PVM. (N) Normalized CD45.1/CD45.2 ratio relative to B cells of migratory cDCs in the MLN 10 dpi with PVM. Data are representative of 2 independent experiments with 5–7 mice per group, analyzed with a one-way ANOVA with Sidak correction for multiple comparisons. Error bars indicate ± SEM. ∗∗p < 0.01. (O) Expression of MHCII and CD86 shown as MFI by DC subsets in the lungs of CD45.1 WT:CD45.2 Ifnar1−/− chimeric mice 10 dpi with PVM. Data are representative of 2 independent experiment with 5–7 mice per group and were analyzed with a two-way ANOVA with Sidak correction for multiple comparisons. ∗∗p < 0.01; ns, not statistically significant.
Figure 5
Figure 5
Inf-cDC2s Are Found in Other Models of Inflammation and Infection (A) Flowcytometry plots pre-gated on live CD3CD19 migratory CD172a+ DCs in MLNs of WT (Ifnar1+/+) and Ifna1r−/− mice 3 days after 100 μg HDM administration i.t. (B) CD26 expression by the different DC subsets in MLNs of WT mice 3 days after 100 μg HDM administration i.t. (C) Expression of IRF8, shown as MFI, by the total cDC2 subset in MLNs of WT (Ifnar1+/+) and Ifnar1−/− 3 days after 100 μg HDM administration i.t. The experiment had 4–6 mice per group and was analyzed with a one-way ANOVA with Sidak correction for multiple comparisons. p < 0.05; ns, not statistically significant. (D) Proliferation profile of CTV-labeled Der p 1-specific CD4+ TCR transgenic T cells cocultured for 4 days with the different DC subsets sorted from MLNs (top row) or lungs (bottom row) 72 h after i.t. challenge with HDMs (75 μg) in combination with LPS (300 ng) and beta-glucans (30 μg). For the peptide control, 1 μg/mL of Der p 1 peptide was added ex vivo. (E and F) Absolute number total divided (E) and RORγt+, IL-17+, and GATA3+ (F) Der p 1-specific TCR transgenic CD4+ T cells and IL-4 measured in supernatants of coculture as in (D). One-way ANOVA with Sidak correction for multiple comparisons. Error bars indicate ± SEM. p < 0.05, ∗∗p < 0.01; ns, not statistically significant. (G) Gating strategy of DC subsets in ELNs 48 h after i.d. injection of the ear pinna with mock, nonviable Ms or Nb L3 larvae; pre-gated on live CD3B220Ly6GLy6C cells. (H and I) Expression of IRF8 by different DC subsets in ELNs 48 h after i.d. immunization of the ear pinna with Ms or Nb or mock immunization, shown in representative histograms (H) and as MFI (I). Data are representative of 2 independent experiment with 5 mice per group and were analyzed with a one-way ANOVA with Sidak correction for multiple comparisons. p < 0.05, ∗∗p < 0.01; ns, not statistically significant. (J) Proportion of CTFR-Ms+/Nb+ and/or photoconverted DC subsets in ELNs 48 h after i.d. immunization and violet laser exposure of the ear pinna. Data are representative of 2 independent experiments with 4 Kaede mice per group and were analyzed with a one-way ANOVA with Sidak correction for multiple comparisons. p < 0.05, ∗∗p < 0.01; ns, not statistically significant.

Comment in

References

    1. Aibar S., González-Blas C.B., Moerman T., Huynh-Thu V.A., Imrichova H., Hulselmans G., Rambow F., Marine J.C., Geurts P., Aerts J. SCENIC: single-cell regulatory network inference and clustering. Nat. Methods. 2017;14:1083–1086. - PMC - PubMed
    1. Ainsua-Enrich E., Hatipoglu I., Kadel S., Turner S., Paul J., Singh S., Bagavant H., Kovats S. IRF4-dependent dendritic cells regulate CD8+ T-cell differentiation and memory responses in influenza infection. Mucosal Immunol. 2019;12:1025–1037. - PMC - PubMed
    1. Ando R., Hama H., Yamamoto-Hino M., Mizuno H., Miyawaki A. An optical marker based on the UV-induced green-to-red photoconversion of a fluorescent protein. Proc. Natl. Acad. Sci. USA. 2002;99:12651–12656. - PMC - PubMed
    1. Bagadia P., Huang X., Liu T.-T., Durai V., Grajales-Reyes G.E., Nitschké M., Modrusan Z., Granja J.M., Satpathy A.T., Briseño C.G. An Nfil3-Zeb2-Id2 pathway imposes Irf8 enhancer switching during cDC1 development. Nat. Immunol. 2019;20:1174–1185. - PMC - PubMed
    1. Bain C.C., Scott C.L., Uronen-Hansson H., Gudjonsson S., Jansson O., Grip O., Guilliams M., Malissen B., Agace W.W., Mowat A.M. Resident and pro-inflammatory macrophages in the colon represent alternative context-dependent fates of the same Ly6Chi monocyte precursors. Mucosal Immunol. 2013;6:498–510. - PMC - PubMed

Publication types

MeSH terms