. 2020 May 7;21(9):3300.
doi: 10.3390/ijms21093300.

Targeting RGS4 Ablates Glioblastoma Proliferation

Affiliations

Targeting RGS4 Ablates Glioblastoma Proliferation

Maheedhara R Guda et al. Int J Mol Sci. .

Abstract

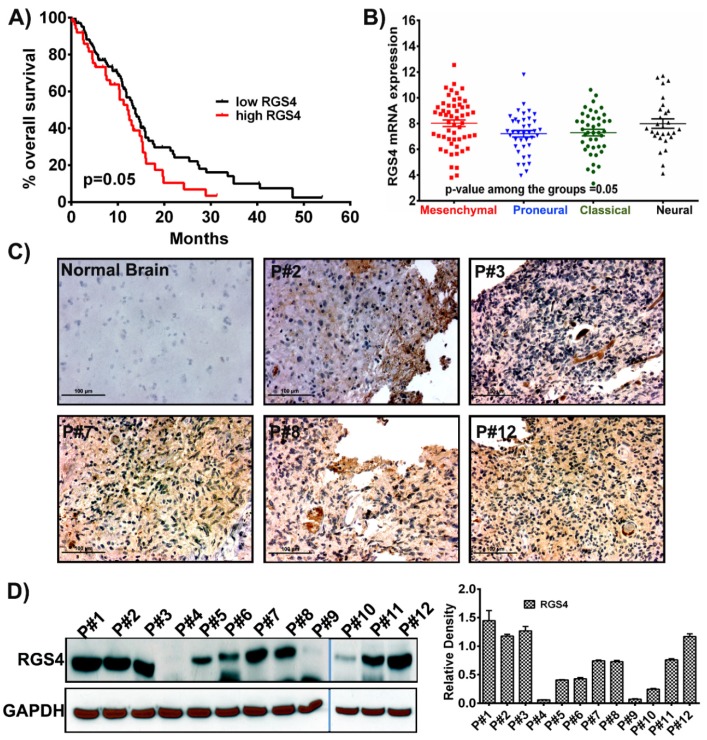
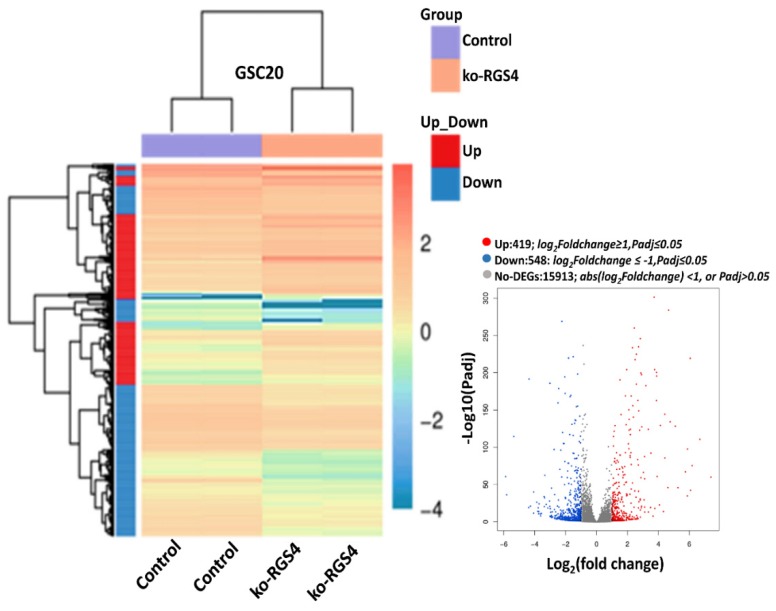
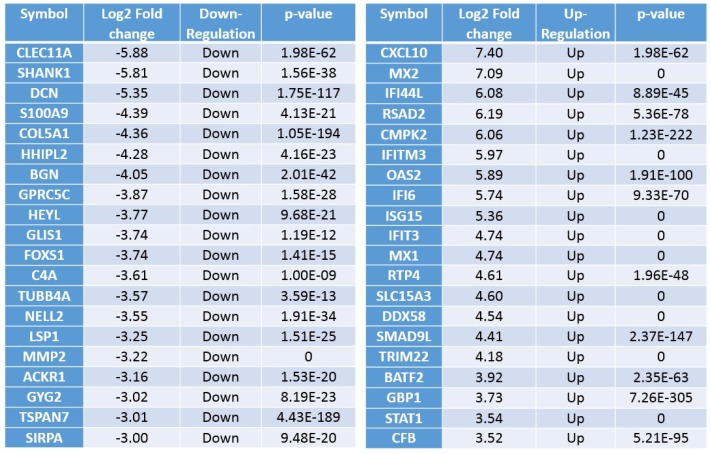
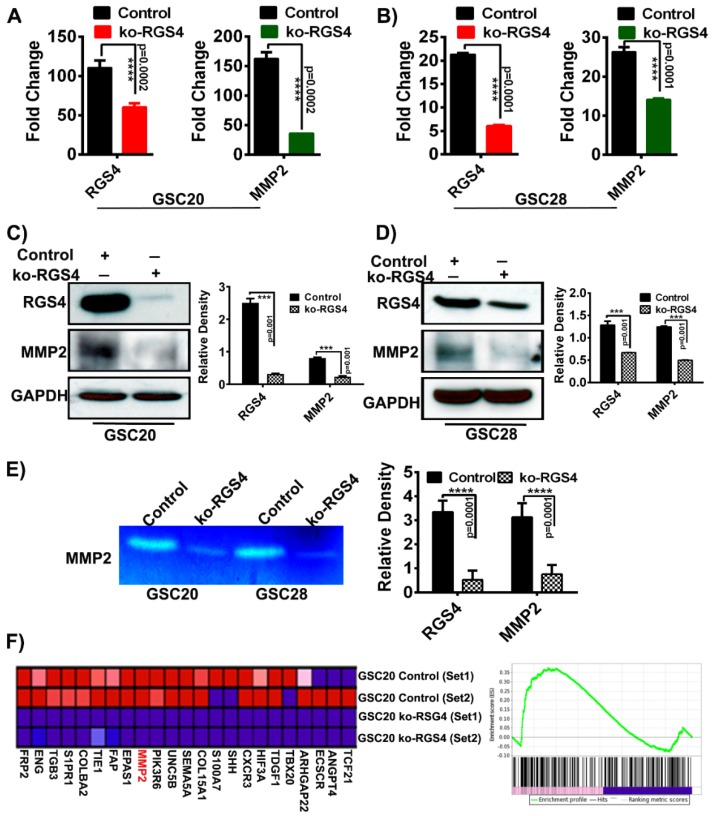
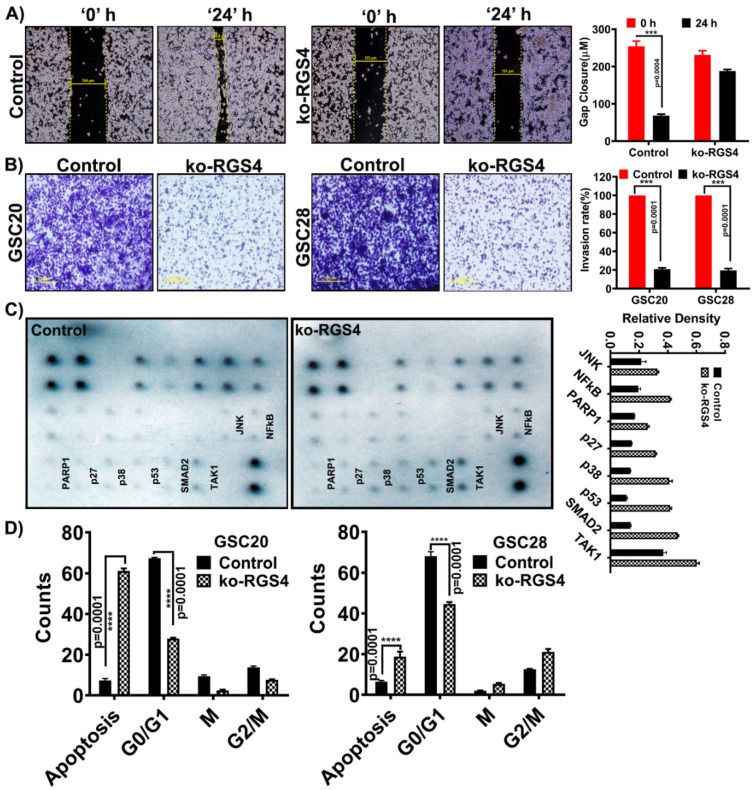
Glioblastoma (GBM) is the most common type of adult primary brain tumor with a median survival rate of less than 15 months, regardless of the current standard of care. Cellular heterogeneity, self-renewal ability and tumorigenic glioma cancer stem cell (GSC) populations contribute to the difficulty in treating GBM. G-protein-coupled receptors (GPCRs) are the largest group of membrane proteins and mediate many cellular responses. Regulators of G-protein signaling 4 (RGS4) are negative regulators of G-protein signaling, and elevated levels of RGS4 are reportedly linked with several human diseases, including cancer. This study investigates the effect of silencing RGS4, resulting in inhibition of GSC growth, invasion and migration. Data obtained from The Cancer Genome Atlas (TCGA) demonstrated poor patient survival with high expression of RGS4. Immunohistochemistry and immunoblot analysis conducted on GBM patient biopsy specimens demonstrated increased RGS4 expression correlative with the TCGA data. RNA sequencing confirmed a significant decrease in the expression of markers involved in GSC invasion and migration, particularly matrix metalloproteinase-2 (MMP2) in knockout of RGS4 using CRISPR plasmid (ko-RGS4)-treated samples compared to parental controls. Gelatin zymography confirmed the reduced activity of MMP2 in ko-RGS4-treated samples. Silencing RGS4 further reduced the invasive and migratory abilities and induction of apoptosis of GSCs as evidenced by Matrigel plug assay, wound healing assay and human apoptosis array. Collectively, our results showed that the silencing of RGS4 plays an important role in regulating multiple cellular functions, and is an important therapeutic target in GBM.

Keywords: MMP2; RGS4; apoptosis; glioma stem cells.


Conflict of interest statement

The authors declare no conflict of interest that exists with this manuscript.

Figures

Figure 1
Figure 1
RGS4 expression in glioblastoma samples. (A) Kaplan–Meier curve plotted from the data obtained from The Cancer Genome Atlas (TCGA) shows that increased regulators of G-protein signaling 4 (RGS4) expression corresponds to decreased survival (n = 172). p-value is calculated by log rank test (p = 0.05). (B) The mRNA expression levels of RGS4 plotted in different subtypes of glioblastoma (n = 163; mesenchymal = 42; proneural = 55; classical = 27; neural; = 39). The error bars are plotted based on the standard error of mean (SEM). (C) Immunohistochemical staining for RGS4 with anti-RGS4 antibody (brown, diaminobenzidine; light blue, nuclear counter stain with 4′,6-diamidino-2-phenylindole (DAPI); P = glioblastoma specimen) showed positive staining in the glioblastoma (GBM) patient specimens. Negative staining is observed in the normal brain sample specimen (Bar = 100 µM). (D) Immunoblot analysis of RGS4 expression in different patient samples (human GBM (hGBM) patient samples = 12). GAPDH (Glyceraldehyde 3-phosphate dehydrogenase) is used as a loading control. The density levels were quantified and represented as a bar graph.
Figure 2
Figure 2
RNA sequencing analysis. Hierarchical clustering RNA sequencing (RNA-seq) data from untreated control and ko-RGS4-treated glioma cancer stem cell (GSC)20 cells. The gradient legend at the top right of the graph represents the FPKM (fragments per kilobase of exon model per million reads mapped) value that has been logarithmically converted. Each column represents a sample, each row represents a gene, different colors represent different expression levels—red for high expression and blue for low expression. Inlet: Volcano plot of differentially expressed genes (DEGs) (red = highly expressed; blue = highly downregulated; grey = unchanged).
Figure 3
Figure 3
Differentially expressed genes. Top upregulated and downregulated genes when silencing RGS4 in GSC20 cells.
Figure 4
Figure 4
RGS4 modulate matrix metalloproteinase-2 (MMP2) expression. RT-PCR and immunoblot analysis of RGS4 and MMP2 in GSC20 and GSC28 cells treated with knockout-RGS4 (ko-RGS4) and untreated control cells (AD) (n = 3) (**** p = 0.0002; **** p = 0.0001; *** p = 0.001). GAPDH was used as a loading control. The density levels were quantified and represented as a bar graph. (E) MMP2 activity was evaluated by gelatin zymography by using conditioned media from control and ko-RGS4-transfected GSC20 and GSC28 cells collected 48 h after transfection. Bar graph represents the densitometry analysis of MMP2 activity. (F) Gene set enrichment analysis (GSEA) using gene set involved in maintaining GSC angiogenesis after ko-RGS4 treatment. The green line demonstrate the enrichment profile. The error bars are plotted based on the SEM (standard error of mean).
Figure 5
Figure 5
Functional analysis of targeting RGS4 in GSC. (A) GSC20 cells were cultured on Poly-D-Lysine-coated six-well plate and treated with ko-RGS4. After 48 h of transfection, a straight scratch was made in individual wells. This point was considered 0 h, and the width of wound was photographed under a microscope. After 24 h, cells were checked for wound healing and again photographed under a microscope. Wound closure distances were used to plot the bar graph (p = 0.001, n = 3) (*** p = 0.004). Yellow bar explains the percentage of wound contraction/repair (Bar = 100 µM). (B) Using Matrigel plug invasion assay, ko-RGS4-treated GSC20/GSC28 cells and untreated control cells were plated in a six-well plate. After 24 h, cells penetrating the membrane were fixed and stained with 0.1% crystal violet. The pictograms were captured using an Olympus IX71 microscope. The percent invasion was calculated by taking the untreated control cell invasion as 100% and the treatments were compared against the controls. The data are presented as a bar graph (p = 0.001, n = 3) (*** p = 0.001) (Bar = 100 µM). (C) Using a human apoptosis signaling pathway array (Ray Biotech AAH-APOSIG), we recorded increased expression levels of apoptosis markers such as PARP1, p27, p53, SMAD and TAK1 and other markers in the ko-RGS4-treated cells when compared to the untreated control cells. The band densities were plotted in a bar graph (n = 2). (D) Cell cycle analysis using flow cytometry confirmed increased apoptosis upon ko-RGS4 treatment. Graphical representation of the percentage of cells in each stage of the cell cycle was represented in a bar graph (n = 3) (**** p = 0.0001). The error bars are plotted based on the SEM (standard error of mean).

References

    1. Stupp R., Mason W.P., van den Bent M.J., Weller M., Fisher B., Taphoorn M.J., Belanger K., Brandes A.A., Marosi C., Bogdahn U., et al. Radiotherapy Plus Concomitant and Adjuvant Temozolomide for Glioblastoma. N. Engl. J. Med. 2005;352:987–996. doi: 10.1056/NEJMoa043330. - DOI - PubMed
    1. Stupp R., Hegi M.E., Mason W.P., van den Bent M.J., Taphoorn M.J., Janzer R.C., Ludwin S.K., Allgeier A., Fisher B., Belanger K., et al. Effects of Radiotherapy with Concomitant and Adjuvant Temozolomide Versus Radiotherapy Alone on Survival in Glioblastoma in a Randomised Phase III Study: 5-Year Analysis of the EORTC-NCIC Trial. Lancet Oncol. 2009;10:459–466. doi: 10.1016/S1470-2045(09)70025-7. - DOI - PubMed
    1. Yamashita D., Bernstock J.D., Elsayed G., Sadahiro H., Mohyeldin A., Chagoya G., Ilyas A., Mooney J., Estevez-Ordonez D., Yamaguchi S., et al. Targeting Glioma-Initiating Cells Via the Tyrosine Metabolic Pathway. J. Neurosurg. 2020;1:1–12. doi: 10.3171/2019.11.JNS192028. - DOI - PMC - PubMed
    1. Liebelt B.D., Shingu T., Zhou X., Ren J., Shin S.A., Hu J. Glioma Stem Cells: Signaling, Microenvironment, and Therapy. Stem Cells Int. 2016;2016:7849890. doi: 10.1155/2016/7849890. - DOI - PMC - PubMed
    1. Gimple R.C., Kidwell R.L., Kim L.J.Y., Sun T., Gromovsky A.D., Wu Q., Wolf M., Lv D., Bhargava S., Jiang L., et al. Glioma Stem Cell Specific Super Enhancer Promotes Polyunsaturated Fatty Acid Synthesis to Support EGFR Signaling. Cancer Discov. 2019;9:1248–12678. doi: 10.1158/2159-8290.CD-19-0061. - DOI - PMC - PubMed

MeSH terms