. 2020 Jul 28;142(4):365-379.
doi: 10.1161/CIRCULATIONAHA.119.041231. Epub 2020 May 12.

Suppression of Endothelial AGO1 Promotes Adipose Tissue Browning and Improves Metabolic Dysfunction

Affiliations

Suppression of Endothelial AGO1 Promotes Adipose Tissue Browning and Improves Metabolic Dysfunction

Xiaofang Tang et al. Circulation. .

Erratum in

Abstract

Background: Metabolic disorders such as obesity and diabetes mellitus can cause dysfunction of endothelial cells (ECs) and vascular rarefaction in adipose tissues. However, the modulatory role of ECs in adipose tissue function is not fully understood. Other than vascular endothelial growth factor-vascular endothelial growth factor receptor-mediated angiogenic signaling, little is known about the EC-derived signals in adipose tissue regulation. We previously identified Argonaute 1 (AGO1; a key component of microRNA-induced silencing complex) as a crucial regulator in hypoxia-induced angiogenesis. In this study, we intend to determine the AGO1-mediated EC transcriptome, the functional importance of AGO1-regulated endothelial function in vivo, and the relevance to adipose tissue function and obesity.

Methods: We generated and subjected mice with EC-AGO1 deletion (EC-AGO1-knockout [KO]) and their wild-type littermates to a fast food-mimicking, high-fat high-sucrose diet and profiled the metabolic phenotypes. We used crosslinking immunoprecipitation- and RNA-sequencing to identify the AGO1-mediated mechanisms underlying the observed metabolic phenotype of EC-AGO1-KO. We further leveraged cell cultures and mouse models to validate the functional importance of the identified molecular pathway, for which the translational relevance was explored using human endothelium isolated from healthy donors and donors with obesity/type 2 diabetes mellitus.

Results: We identified an antiobesity phenotype of EC-AGO1-KO, evident by lower body weight and body fat, improved insulin sensitivity, and enhanced energy expenditure. At the organ level, we observed the most significant phenotype in the subcutaneous and brown adipose tissues of KO mice, with greater vascularity and enhanced browning and thermogenesis. Mechanistically, EC-AGO1 suppression results in inhibition of thrombospondin-1 (THBS1/TSP1), an antiangiogenic and proinflammatory cytokine that promotes insulin resistance. In EC-AGO1-KO mice, overexpression of TSP1 substantially attenuated the beneficial phenotype. In human endothelium isolated from donors with obesity or type 2 diabetes mellitus, AGO1 and THBS1 are expressed at higher levels than the healthy controls, supporting a pathological role of this pathway.

Conclusions: Our study suggests a novel mechanism by which ECs, through the AGO1-TSP1 pathway, control vascularization and function of adipose tissues, insulin sensitivity, and whole-body metabolic state.

Keywords: AGO1; TSP1/THBS1; adipose tissue; angiogenesis; endothelial cells; insulin resistance; obesity.


Figures

Figure 1.
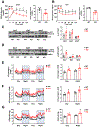
Figure 1.. Generation and phenotyping of EC-specific AGO1-KO mice.
(A) Targeting strategy to create EC-AGO1-KO mice. Red arrows indicate the location of primers used for genotyping (P1) (in B). Blue arrows indicate primers used for qPCR (P2-P6) (in C). (B) PCR-based genotyping of WT, heterozygous, and homozygous KO for the floxed-AGO1 allele(s). (C) qPCR was performed with lysates collected from SAT microvascular EC isolated from 24-week-old male mice. ECs from 3 mice were pooled into one sample in each of the three experiments. (D) Immunoblotting was performed with lysates from microvascular ECs isolated from lungs of 8-week-old male mice. (E-J) Male WT and KO mice were kept on chow or HFHS diet for 16 weeks (y-axis) starting at 8 weeks old. (E) Body weight comparison between indicated groups (n=20 mice/group). Note that dashed blue (WT-Chow) vs dashed pink (KO-Chow) has no significant difference (N.S.), solid black (WT-HFHS) vs dashed blue (WT-Chow) show significant difference (*P < 0.05), and solid black (WT-HFHS) vs solid red (KO-HFHS) also show significant difference (**P < 0.005). (F-J) Representative picture of whole body (in F), body composition measured by Echo MRI, with lean and fat mass plotted as percentage of body weight (in G), weight of multiple organs (in H), and representative images of SAT and BAT obtained from HFHS diet-fed WT and EC-AGO1-KO littermates (I and J) (n=15 mice/group). Scale bars = 1 cm. Data are presented as mean ± SEM. *P < 0.05, ** P < 0.005, *** P < 0.0005 derived from Student’s t tests in (E, G, and H) and *Bonferroni-corrected P < 0.05 in (C).
Figure 2.
Figure 2.. Improved insulin sensitivity and increased energy expenditure in EC-AGO1-KO mice under HFHS diet.
Male EC-AGO1-KO mice and their WT littermates were fed HFHS diet for 16 weeks starting at 8 weeks old (n=6 mice/group). (A, B) Glucose tolerance test (GTT) and insulin tolerance test (ITT). (C, D) Immunoblotting analysis of p-AKT (Ser473) and p-AMPK (Thr172) in adipose tissues. (E-G) Whole body oxygen consumption rate (in E), carbon dioxide production date (in F), and energy expenditure (in G) normalized to body weight. Data are presented as mean ± SEM. *P < 0.05, *** P < 0.0005.
Figure 3.
Figure 3.. AGO1-EC-KO mice show higher browning activity and vascularization in SAT and BAT.
Mice were fed HFHS diet as in Figure 2. (A) Representative images of HE staining of SAT (n=6 mice/group). (B) Quantification of sizes and numbers of adipocytes (n=6 mice/group). (C) Immunohistochemical (IHC) staining of UCP1 in SAT (n=5 mice/group). (D) qPCR analysis of mRNA levels of genes as indicated in SAT (n=7 mice/group). (E) Immunofluorescent (IF) staining of CD31 in SAT (n=5 mice/group). (F) qPCR detection of VEGFA mRNA level in SAT (n=5 mice/group). (G) Heat map showing SAT gene expression profiled by RNA-seq plotted with log2TPM (n=3 mice/group). (H-L) HE staining (in H), UCP1 IHC (in I), qPCR analysis (in J and L), and CD31 IF (in K) in BAT (n=5 mice/group). Scale bars = 50 μm in (A), (C), (H), and (I); scale bars in (E and K) = 200 μm. Data are presented as mean ± SEM. *P < 0.05, ** P < 0.005, *** P < 0.0005 in (B, C, E, F, I, K, and L) and *Bonferroni-corrected P < 0.05 in (D and J).
Figure 4.
Figure 4.. AGO1 mediates THBS1 targeting and suppression in hypoxic ECs.
(A-G) Human microvascular endothelial cells (HMVECs) in biological duplicates were subjected to normoxia (Nx, 21% O2; time 0) or hypoxia (Hx, 2% O2) for 12, 24, and 48 hour (hr). RNA-seq was performed for all time points and iCLIP-seq was performed for time 0 and 24 hr treatment. (A) Bioinformatics approach to identify genes that are differentially regulated by hypoxia with significant changes in AGO1 binding, including 169 “hypoxia-suppressed” and 160 “hypoxia-desuppressed”. (B) Heatmap showing the mRNA expression of genes in significantly enriched angiogenesis pathways. (C) A polar bar plot showing the number of genes in each of the significantly enriched GO terms. (D) Changes of 3’UTR-AGO1 binding in hypoxia vs. normoxia for 169 hypoxia-suppressed genes, quantified by log10 absolute change in CLIP-seq reads, with 20 genes involved in angiogenesis pathways indicated. (E) Line plots of the hypoxia-suppressed mRNA expression of 20 genes involved in angiogenesis based on TPM from times-series RNA-seq. (F) Illustration of CLIP-seq reads aligned to 3’UTR of THBS1 under normoxia and hypoxia. Arrows indicate the regions of 3’UTR cloned in luciferase reporter constructs used (in I). (G) Chimeric reads revealing Let-7-THBS1 3’UTR targeting. (H) Quantification of THBS1 mRNA bound to AGO1 under normoxia and hypoxia in HMVECs (n=3). (I) Bovine aortic ECs were transfected with luciferase reporter constructs containing 3’UTR from THBS1 then subjected to normoxia and hypoxia for 24 h (n=5). (J) HMVECs were transfected with scramble (siCtrl) or AGO1 siRNA (20 nM). mRNA levels of AGO1 and THBS1 were quantified by qPCR (n=3). Data are presented as mean ± SEM. *P in (J) and Bonferroni-corrected P in (I) < 0.05.
Figure 5.
Figure 5.. EC-AGO1-KO mice have decreased expression of TSP1 and associated changes in adipose tissues and ECs.
Mice were fed HFHS diet as in Figure 2. (A) qPCR analysis of THBS1 mRNA expression levels in SAT (n=7 mice/group). (B) Immunohistochemistry of TSP1 in SAT (n=5 mice/group). Scale bar = 50 μm. (C) Co-IF of TSP1 and CD31 in SAT (representative of n=5 mice/group). Scale bar = 50 μm. (D, E) TSP1 mRNA and protein expression levels in microvascular ECs isolated from SAT from HFHS diet-fed WT and EC-AGO1-KO mice (n=6 mice/group). (F) Heat map showing miRNA levels in SAT profiled by small RNA-seq (n=3 mice/group). (G) Taqman miRNA qPCR for Let-7e and −7k levels in ECs isolated from SAT (n=3 mice/group). (H) qPCR analysis of indicated mRNA in EC isolated from SAT (n=6 mice/group). Data are presented as means ± SEM. *P in (A, B, and D) or Bonferroni-corrected P in (G and H) < 0.05.
Figure 6.
Figure 6.. Ectopic expression of TSP1 abolishes the effect of EC-AGO1-KO in SAT browning.
(A) Experimental design of adenoviral injection of TSP1 into EC-AGO1-KO mice under HFHS diet. (B) IF showing positive GFP signal at Day 3 and 7 in SAT after local adenoviral injection. Scale bar = 50 μm. (C) Flow cytometry quantification of TSP1-positive cells after 7 days of local adenoviral injection, with IgG as an isotype control. (D) qPCR for indicated gene expression levels in SAT. (E-G) IF of CD31 (E) and F4/80 (F) and Masson’s Trichrome staining (G) in SAT from wild-type or EC-AGO1-KO littermates after local delivery of Ad-GFP or Ad-TSP1. Scale bars = 50 μm. (H) Body weight measurements in EC-AGO1-KO mice receiving systemic administration of Ad-GFP or Ad-TSP1. n=3 mice/group. Data are presented as mean ± SEM. *Bonferroni-corrected P in (D) < 0.05 and ** P < 0.005 in (H).
Figure 7.
Figure 7.. AGO1-THBS1 in intima isolated from human vessels and a working model.
(A) qPCR analysis of AGO1 and THBS1 mRNA levels in the intima isolated from human mesenteric arteries. Data are presented as mean ± SEM in scatter plots. Indicated P values based on Student’s t tests between the healthy donors and obese/T2D donors. (B) Spearman’s correlation of mRNA levels of AGO1 and THBS1 in the intima from human donors. (C) Schematic illustration of EC-AGO1-THBS1-regulated adipose tissue function and metabolic homeostasis. Under obese condition, induction of AGO1-THBS1/TSP1 pathway in ECs may suppress angiogenesis, reduce vascularization, and promote insulin resistance of adipose tissues. The induction of THBS1 can also contribute to inflammation and fibrosis. Together with impaired insulin sensitivity, these changes contribute to the metabolic disorders such as obesity and T2D.

Comment in

  • Endotheliopathy of Obesity.
    Cooke JP. Cooke JP. Circulation. 2020 Jul 28;142(4):380-383. doi: 10.1161/CIRCULATIONAHA.120.047574. Epub 2020 Jul 27. Circulation. 2020. PMID: 32718250 Free PMC article. No abstract available.

Similar articles

Cited by

References

    1. Kahn SE, Hull RL and Utzschneider KM. Mechanisms linking obesity to insulin resistance and type 2 diabetes. Nature. 2006;444:840–846. - PubMed
    1. Fuster JJ, Ouchi N, Gokce N and Walsh K. Obesity-Induced Changes in Adipose Tissue Microenvironment and Their Impact on Cardiovascular Disease. Circ Res. 2016;118:1786–1807. - PMC - PubMed
    1. Sun K, Kusminski CM and Scherer PE. Adipose tissue remodeling and obesity. J Clin Invest. 2011;121:2094–2101. - PMC - PubMed
    1. Gealekman O, Guseva N, Hartigan C, Apotheker S, Gorgoglione M, Gurav K, Tran KV, Straubhaar J, Nicoloro S, Czech MP, et al. Depot-specific differences and insufficient subcutaneous adipose tissue angiogenesis in human obesity. Circulation. 2011;123:186–194. - PMC - PubMed
    1. Shimizu I, Aprahamian T, Kikuchi R, Shimizu A, Papanicolaou KN, MacLauchlan S, Maruyama S and Walsh K. Vascular rarefaction mediates whitening of brown fat in obesity. J Clin Invest. 2014;124:2099–2112. - PMC - PubMed

Publication types

MeSH terms